

Abstract
The pre-T cell receptor (pre-TCR) is a pTα-β heterodimer functioning in early αβ T cell development. Although once thought to be ligand-autonomous, recent studies show that pre-TCRs participate in thymic repertoire formation through recognition of peptides bound to major histocompatibility molecules (pMHC). Using optical tweezers, we probe pre-TCR bonding with pMHC at the single molecule level. Like the αβTCR, the pre-TCR is a mechanosensor undergoing force-based structural transitions that dynamically enhance bond lifetimes and exploiting allosteric control regulated via the Cβ FG loop region. The pre-TCR structural transitions exhibit greater reversibility than TCRαβ and ordered force-bond lifetime curves. Higher piconewton force requires binding through both complementarity determining region loops and hydrophobic Vβ patch apposition. This patch functions in the pre-TCR as a surrogate Vα domain, fostering ligand promiscuity to favor development of β chains with self-reactivity but is occluded by α subunit replacement of pTα upon αβTCR formation. At the double negative 3 thymocyte stage where the pre-TCR is first expressed, pre-TCR interaction with self-pMHC ligands imparts growth and survival advantages as revealed in thymic stromal cultures, imprinting fundamental self-reactivity in the T cell repertoire. Collectively, our data imply the existence of sequential mechanosensor αβTCR repertoire tuning via the pre-TCR.
Keywords: allosteric regulation, cell differentiation, cell surface receptor, crystallography, major histocompatibility complex (MHC), nuclear magnetic resonance (NMR), optical tweezers, mechanobiology, pre-T cell receptor, structural transition
Introduction
The mammalian adaptive immune system protects its host against infectious diseases as well as tumors in a highly specific manner. At the core of αβ T lymphocyte recognition is self- versus non-self-discrimination, a functionality endowed by clonal cell-surface T cell receptors (TCRs)4 (1–3). In the mammalian thymus, the millions of distinct TCRs expressed create a repertoire that is refined to eliminate unwanted autoreactive specificities prior to export into the peripheral lymphoid compartment (Ref. 4 and references therein).
The earliest thymocytes, termed double negative (DN1–4), lack both CD4 and CD8 and expression of αβTCR complexes (hereafter termed αβTCRs) (5). Within the DN3 stage, a pre-TCR complex is generated comprised of a variable TCRβ chain disulfide-linked to the invariant pTα subunit. In turn, the pTα-β heterodimer is noncovalently complexed with the same CD3 dimers as found in the αβTCR, namely CD3ϵγ, CD3ϵδ, and CD3ζζ (1, 2). This pre-TCR complex triggers cellular survival and expansion and, importantly, induces expression of CD4 and CD8 co-receptors so that the thymocytes transit to the DP (CD4+CD8+) thymocyte stage where rearrangement of the TCRα gene occurs. Only at the DP stage is the αβTCR expressed. The pre-TCR signaling process, termed β selection, also controls allelic exclusion of the TCRβ locus in a given cell (6). Pre-TCR signaling components include tyrosine kinases Lck, Fyn, and ZAP-70 (7–9) with Notch-1, Notch-1 ligand DL4, interleukin 7, and CXCR4 supporting pre-TCR function (5, 10). Although αβTCR DP thymocyte selection processes involve pMHC-dependent positive (survival) and negative (deletion) selection, pre-TCR signaling by contrast has been viewed as ligand-independent (11).
In recent studies, however, we showed both by solution NMR and biomembrane force probe analyses that the pre-TCR is a pMHC-binding receptor whose ligation triggers calcium flux and modulates DP development (12). In line with this, pre-TCR ligand independence previously ascribed to pTα charge-based receptor oligomerization has been impugned (13). The ligand-dependent pre-TCR pathway operates in parallel with mechanisms that foster “tonic” developmental progression (12), explaining why pre-TCR ectodomain deletions (14) or MHC loss (15) does not abrogate thymocyte progression.
During immune surveillance, mature αβ T cells scan their environment, physically binding and crawling over structures while undergoing cell motility processes that can generate tensile and shear stresses over a wide range of forces (pN to nN). Additionally, forces within the cell through cytoskeletal (actin, microtubule, etc.) rearrangements can couple to membrane-bound structures such as the αβTCR complex (16). Direct evidence that the TCR acts as a mechanosensor was experimentally shown through optical tweezer-based measurements that presented pMHC-coated beads to surface-bound αβTCRs, where mere binding without force was insufficient for triggering, but tangential force resulted in T cell activation, leading us to propose a mechanical model for signal transduction (17). The concept of bond strengthening with force reconciles the discrepancy between the exquisite sensitivity and specificity of the αβTCR on the one hand and its low affinity for ligand in the absence of physical load on the other hand (17–20). A nonlinear response of the αβTCR-pMHC bond was recently shown in biomembrane force probe and optical trap assays where single molecule interactions are probed (21, 22). As a consequence of these and additional studies, the role of force in TCR-based signaling is becoming more readily appreciated (21–24).
Similar to surveillance motions found in mature T cells, developing thymocytes go through a series of migratory cell motions both at the DN and post-DN stages. At the DP thymocyte stage, expression of plexinD1, which controls β1 integrin and chemokine-linked motility of maturing thymocytes, is modulated, directing them toward the thymic medulla and setting the stage for positive and negative selection of the large αβTCR repertoire noted above (Refs. 25, 26 and references therein). Although there are many models that may help to elucidate T-lineage maturation, given that cell motion is associated with this process, there is likely to be a strong mechanical component to thymocyte development. Of note, if proper pre-TCR signaling is not present, the DN thymocytes do not progress effectively to DP thymocytes (6).
Given that the αβTCR has been shown to function as a mechanosensor (Ref. 27 and references therein) and the pre-TCR shares many structural features, we here used single molecule (SM) analysis to reveal that the pre-TCR apparatus employs similar dynamic bond strengthening under load involving structural transition and allosteric control to pretune β chain function prior to that of the αβTCR. Force-based discrimination, central to the function of the αβTCR, is now shown to be conserved in its developmental precursor, the pre-TCR. Moreover, there are reversible structural rearrangements necessary for strengthened binding under force, a long sought-after conformational change accompanying pMHC ligation, revealed with techniques targeted to a receptor evolved to leverage the dynamic nature of a mature T cell or progenitor scanning its environment. This conformational change is essential for determining receptor specificity in both TCR and pre-TCR.
Results
Pre-TCR Shares Ligand Recognition Features with TCR
The pre-TCR heterodimer has an unpaired Vβ domain and an exposed hydrophobic patch, whereas the TCRαβ heterodimer comprises a paired V module that occludes the patch (Fig. 1A). The more membrane-proximal constant module in the TCRαβ heterodimer consists of α and β constant domains (Cα and Cβ, respectively). In the pre-TCR, the constant module incorporates pTα and Cβ domains. The Cβ FG-loop, a functionally critical structure (28, 29) shown to gate ligand discrimination in the clonotypic TCRαβ heterodimer (hereafter TCRαβ) (21), remains similarly structured in the pre-TCR. However, receptor performance is strikingly impacted by Vβ pre-TCR topology. Highly reversible structural transitions and relaxed pMHC specificity are fostered in the pre-TCR as described below.
FIGURE 1.
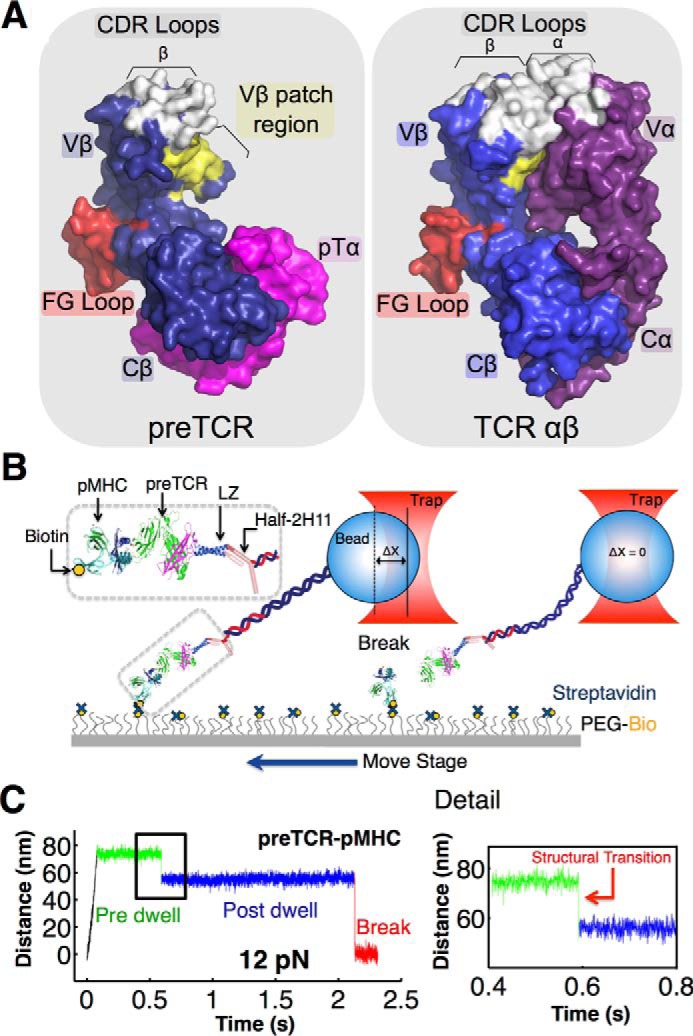
Single molecule assay for measuring pre-TCR/pMHC interaction. A, comparison of pre-TCR (left) and TCRαβ (right) extracellular domains. The pre-TCR contains three domains as follows: Cβ and Vβ (blue) and pTα (pink), an invariant partner much like the Cα domain. pMHC (not shown) interacts with Vβ CDR loops (white) and hydrophobic patch (yellow). The FG loop (red) buttresses the connection between Cβ and Vβ domains. The TCRαβ contains four domains, including additional CDR loops from Vα at the pMHC interacting surface. The patch is located at the dimerization interface of Vα with Vβ in TCRαβ. Figure was created using PyMOL (57) using Protein Data Bank entries 3OF6 (Pre-TCR) and 1NFD (TCRαβ). B, pre-TCR assay creates tethers between a pMHC bound through biotin streptavidin to a surface coated with a mixture of covalently attached PEG and PEG-biotin and a leucine zipper paired pTα-β heterodimer tethered to a bead through a 2H11 half-antibody linked to a 1-μm strand of DNA. The sample is moved and bead displacement is monitored in the trap exerting force on a tether until breakage. C, representative trace for pre-TCR/pMHC interactions. The tether is pulled to a fixed distance (black) where pre-dwell (green), post-dwell (blue), and tether break (red) features are observed. Details of the transition between pre- and post-dwell states show a structural transition of about 10 nm. Note that display of time-versus-distance plots is oriented in the opposite way to that of Ref. 21.
Probing Pre-TCR/pMHC Interaction Using SM Optical Tweezers Assay
The TCRαβ and pre-TCR pTα-β heterodimers consist of ectodomains, transmembrane segments, and cytoplasmic tails in each of their subunits. For pMHC binding studies, recombinant heterodimeric ectodomains were generated as described under “Experimental Procedures.” Our optical tweezers-based SM assay isolates the pre-TCR/pMHC interaction to a coverslip surface in a tethered bead configuration (Fig. 1B). The pTα-β heterodimer, fused to an acid-base leucine zipper (LZ) at the C terminus and expressed eukaryotically, is tethered through a 1-μm-long 3520-bp dsDNA molecule covalently linked to a zipper-specific half-antibody 2H11 (see Fig. 1B and “Experimental Procedures” for details) (21). Force-lifetime measurements were performed by translating the sample relative to the trapped bead and dwelling at a fixed position/force until bond rupture. The forces investigated are consistent with those observed physiologically based on tension sensors (30). Conformational extensions representing structural transitions are seen as displacements of the bead toward the trap center prior to bond breakage, which causes an abrupt snap back of the bead position within the trap (Fig. 1C).
Ligand Discrimination of Pre-TCR by Catch Bond Mechanism
To gauge the generality of our findings with respect to pMHC binding by pre-TCRs, we expressed and purified two pre-TCR pTα-β heterodimers using distinct β chains, one derived from the N15TCRαβ and a second from the N30TCRαβ (31). Although these CD8 cytotoxic T cell-derived αβTCRs both recognize the vesicular stomatitis virus nucleoprotein octapeptide (VSV8) bound to H-2Kb MHC class I molecule (VSV8/Kb), the respective peptide specificities of the pre-TCRs have not been explored in depth (12). We discuss each of these in turn beginning with the N15pre-TCR. As shown in Fig. 2, A and B, mechanical force dramatically enhances the bond lifetime of pre-TCR/pMHC interactions. For the N15pre-TCR interaction with VSV8/Kb ligand, for example, bond lifetime counter-intuitively lengthens with increasing force with a peak lifetime centered at 10–20 pN, not dissimilar to the N15TCRαβ interaction with VSV8/Kb (Fig. 2, A and B). This behavior is characteristic of “catch bond” phenomena described for TCRs and other receptor ligand interactions (Refs. 21, 22, 32 and references therein). By varying the peptides bound to the H-2 MHC class I Kb molecule, including VSV8/Kb, chicken ovalbumin OVA(257–264)/Kb, the ovalbumin variant Q4H7/Kb, the Sendai virus nucleoprotein SEV9(324–332)/Kb, as well as the class II MHC-bound peptide complex OVA(323–339)/I-Ad, we were able to gauge the cross-reactive potential of the pre-TCR. The N15pre-TCR also forms a strong catch bond with Q4H7/Kb, a weak catch bond with OVA/Kb, and a slip bond with SEV9/Kb (Fig. 2B). The interaction with OVA(323–339)/I-Ad is not shown because it formed very few tethers and was too weak to measure. Although the response to ligands for this N15pre-TCR is broader than that of the N15TCRαβ (12), the force lifetime plots (Fig. 2B) nevertheless suggest that the pre-TCR discriminates among peptides bound to the same MHC class I molecule (Kb).
FIGURE 2.
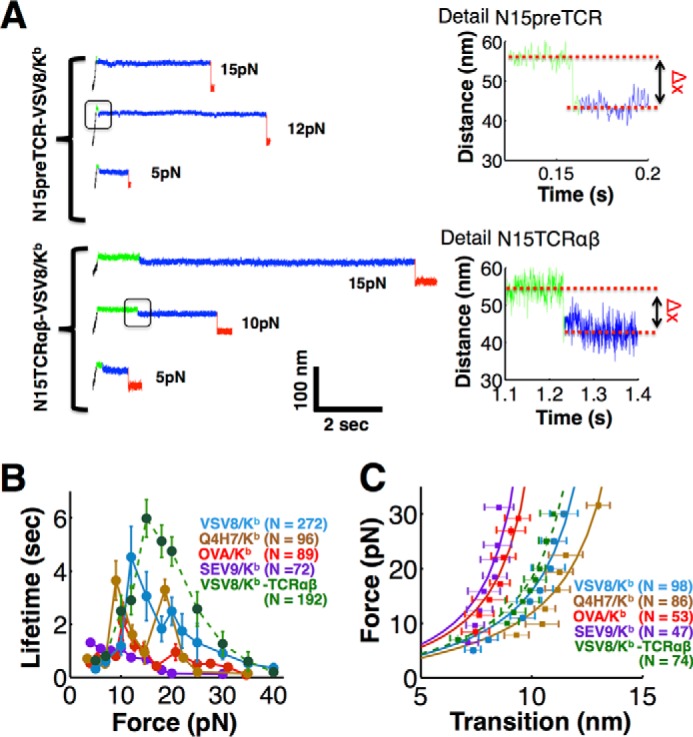
Pre-TCR manifests pMHC-dependent bond strengthening and structural transition. A, representative traces for the N15pre-TCR (top) and N15TCRαβ (bottom) pulling records with details of the transition (right) corresponding to the boxed area in the left trace. B, lifetime versus force plots for N15pre-TCR interacting with a variety of pMHC complexes (H-2Kb bound with indicated peptides) (solid colored traces). A two-peak structure is seen for VSV8 and Q4H7 compared with a single peak for the N15TCRαβ interacting with VSV8 (dashed green). C, force displacement plots for N15 receptors interacting with the Kb bound peptides shown in B. WLC fits were performed for N15pre-TCR conformational transitions for a series of pMHC interactions. The apparent contour lengths for N15pre-TCR were 17.1, 15.5, 12.6, and 11.9 nm for Q4H7, VSV8, OVA, and SEV9, respectively. A persistence length of 0.61 nm for an unfolded polypeptide was assumed in the fits. Although the WLC fits (solid lines in C) assume an unfolded polypeptide and extend to zero transition distance, they help to parameterize the overall structural transition observed in our pulling traces, spanning 6–15 nm, which can be due to multiple sources such as unfolding, domain rotation, and conformational change. B and C, points show mean ± S.E.
Structural Transition of the Pre-TCR during pMHC Ligation
During pMHC recognition, a structural transition is seen for the pre-TCRs consistent with that previously observed with N15TCRαβ (21). Representative distance versus time traces for single loaded pre-TCR/pMHC and TCRαβ/pMHC interactions are shown in Fig. 2A. In contrast to the TCRαβ, the pre-TCR transition appears at slightly weaker force, occurring earlier in our traces, typically during the force ramp phase or immediately after force loading (Fig. 2A, left panel). The total displacement magnitude of the force-induced transition is somewhat higher for the N15pre-TCR compared with the N15TCRαβ (Fig. 2C). Furthermore, as observed for the TCRαβ (21), the transition magnitude correlates with bond lifetime (Fig. 2, B and C). Worm-like chain (WLC) fits were performed for the N15pre-TCR conformational transitions for a series of pMHC interactions, namely Q4H7, VSV8, OVA, and SEV9, and apparent contour lengths were computed. Note the WLC fits assume a model where the transition represents unfolding of a polypeptide, and the persistence length of the unfolded elements is much smaller than the contour length. Here the apparent contour length may include unfolding as well as conformational change and domain rotations, which manifests a profile of a WLC fit (33). Thus, fit results should be interpreted to quantify the relative changes associated with this series of pMHC interactions rather than full unfolding. These observations are consistent with the greater compliance of the pre-TCR due to the pTα-β lacking a Vα domain to buttress or restrict Vβ, in contrast to the four domain TCRαβ.
Pre-TCR Manifests a Complex Force-bond Lifetime Curve
The N15 pre-TCR/pMHC force-lifetime plots (Fig. 2B) manifest a more complex profile than that of N15TCRαβ, which appears as a single peak (Fig. 2B). For the N15pre-TCR interaction with VSV8/Kb, we observe two peaks, one at ∼12 pN and the second at 20 pN, with an average lifetime of 4 and 2.5 s, respectively. This dual catch bond profile is particularly evident for the pMHC ligand Q4H7/Kb.
Vβ Patch Is Essential for High Force Binding in the Pre-TCR
To determine how the Vβ patch contributes to this complex structured profile of bond lifetime, we prepared an N15β triple alanine mutant (12) that diminishes exposure of surface patch residues (Q37A/L43A/F103A) and paired it with pTα to form the MP3pre-TCR. We performed rupture measurements on MP3 using two strong pMHC binders (Fig. 3A). As shown, MP3 forms a catch bond at ∼8 pN with VSV8/Kb and Q4H7/Kb with short lifetimes of 2 s relative to N15pre-TCR (dark versus light colors, respectively in Fig. 3A). Representative comparisons of bond lifetimes at 10 pN for N15pre-TCR and N15MP3pre-TCR with VSV8/Kb are shown in Fig. 3B. Moreover, by comparison with N15pre-TCR, the stronger second catch bond peak with the N15MP3pre-TCR for these pMHC ligands is abrogated. Both the reduction in lifetime of the first catch bond and loss of the second catch bond for MP3 suggest that the patch domain plays a significant role in bond strengthening as quantified in Fig. 3C. Mutating the patch also impacts the pre-TCR ligand discrimination observed at higher force when comparing specificity for VSV8/Kb versus SEV9/Kb (Fig. 3D). Of note, the pre-TCR peptide specificity is significantly less than that of the N15TCRαβ. The weakened N15MP3pre-TCR interaction with pMHC seen in these studies clarifies why MP3 yielded reduced proliferation and development of post-DN3 thymocytes in thymic stromal cultures described previously (12) and in light of new functional data herein.
FIGURE 3.

Patch region has significant influence on pre-TCR force-dependent bond strengthening. A, comparison of Vβ patch mutant N15 MP3pre-TCR (MP3) (dark curves) with wild-type N15pre-TCR (N15) (light curves) with indicated H-2Kb-bound peptides. The N15pre-TCR curves were taken from Fig. 2B for ease of overlay comparison of force bond lifetimes. B, representative traces comparing N15MP3pre-TCR to N15pre-TCR interacting with VSV8/Kb (VSV8) demonstrate reduced bond lifetime for the patch mutant. C, relative gain in lifetime due to the presence of patch region binding, comparing N15pre-TCR to N15MP3pre-TCR for VSV8/Kb (blue) and Q4H7/Kb (brown). Lifetime gain = (N15pre-TCR lifetime)/(N15MP3pre-TCR lifetime). D, sensitivity index (S.I = (bond lifetime with VSV8/Kb)/(bond lifetime with SEV9/Kb)) as a function of force for N15pre-TCR (blue), N15TCRαβ (green), and N15MP3pre-TCRmutant (red) with details of boxed area to the right. A, C, and D, points show mean ± S.E.
Conformational Changes Are Necessary for pMHC Bond Lifetime Prolongation with Pre-TCR as Well as TCR
The loaded pre-TCR/pMHC interaction consists of pre-transition and post-transition dwell periods. For the pre-TCR and TCRαβ, we pooled and calculated the cumulative dwell time distributions and find they exhibit single exponential kinetics with ∼4.6 times longer post-transition dwells compared with pre-transition dwells (Fig. 4, A and B). Dwell times for TCRαβ increased 2-fold relative to the more compliant pre-TCR. Plots for both pre-TCR and TCRαβ bond lifetimes as a function of force demonstrate that the post-transition state exhibits the catch bond profile, although the slip character of the pre-dwell suggests structural transition occurs prior to bond strengthening (Fig. 4, C and D). Slip bond lifetimes exponentially decay with load accelerating the rate of bond rupture. Catch bonds exhibit an initial increase in lifetime, strengthening with force, followed by a decrease in lifetime with even more force. Thus, force catalyzes structural transitions in pre-TCR and TCRαβ, giving rise to a new extended conformation primarily responsible for stabilization and strengthened binding. Mathematical fitting of the pre-dwell as a function of force demonstrates a longer distance to the transition state for the pre-TCR compared with TCRαβ (Table 1). The greater the distance, the more influence force has over the energetics of the transition state barriers. Relatively slower rates and shorter distance to transition state for TCRαβ implies that it is stabilized compared with the pre-TCR.
FIGURE 4.
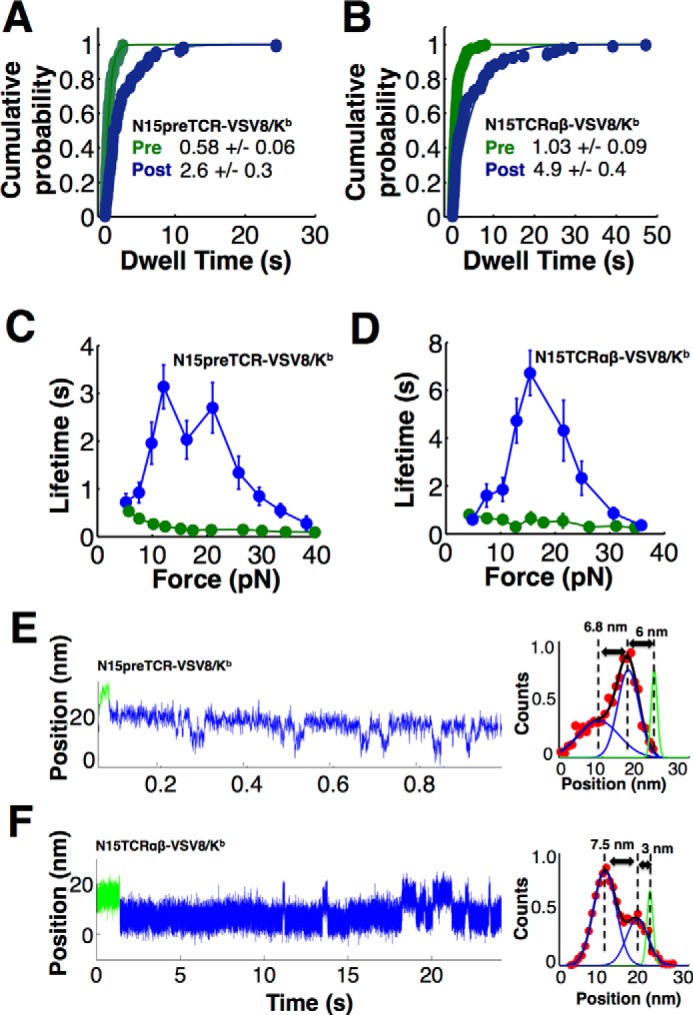
Bond strengthening for pre-TCR and TCRαβ occurs following the structural transition with reversible hopping of receptor molecules between states. A, pre-TCR cumulative probability for pre-dwell (green) and post-dwell (blue) distributions exhibit single exponential character with time constants (in seconds) shown. B, comparable TCRαβ cumulative probability analysis shows single exponential fitting. For both pre-TCR and TCRαβ, the post-dwell time is ∼5 times larger compared with the pre-dwell time. Force versus lifetime plots for pre-TCR (C) and TCRαβ (D) show bond strengthening in the post-transition state. Points show mean ± S.E. Representative traces at ∼10 pN showing reversible transitioning for pre-TCR (E) and TCRαβ (F). Position distributions (shown to the right of each panel) reveal the relative population of dwells in the compact or extended state under load. The initial location of the pre-dwell, prior to any extension, is indicated in green. The position distributions, which spans the reversible region of the trace shown in blue, is fit to the sum of two Gaussian distributions separated by the displacements indicated in the graph. A small displacement is typically observed between the initial green dwell location and the states that exhibit reversible transitioning. Force influences the relative probability of being in the more compact or extended state. E, system favors the more compact state. F, longer dwells are observed in the more extended state.
TABLE 1.
Bell model fit parameters for pre-dwell and reversible transition kinetics
| System | Case | k1 | x1≠ | k2 | x2≠ |
|---|---|---|---|---|---|
| s−1 | nm | s−1 | nm | ||
| Pre-dwell fits to the full transition | |||||
| N15preTCR-VSV8/Kb | Pre-dwell | 0.544 ± 0.49 | 1.16 ± 0.41 | 5.47 ± 1.86 | 0.064 ± 0.07 |
| N15TCRαβ-VSV8/Kb | Pre-dwell | 1.09 ± 0.176 | 0.134 ± 0.05 | ||
| Reversible transition fits | |||||
| N15preTCR-VSV8/Kb | Extended | 3.46 ± 1.2 | 0.39 ± 0.13 | ||
| N15preTCR-VSV8/Kb | Compact | 263 ± 106 | 0.81 ± 0.22 | ||
| N15TCRαβ-VSV8/Kb | Extended | 1.06 ± 0.37 | 0.48 ± 0.14 | ||
| N15TCRαβ-VSV8/Kb | Compact | 168 ± 108 | 1.03 ± 0.51 | ||
Reversible Structural Transitions during Single Binding Events
The pre-TCR transition exhibited a reversible two-state behavior (Fig. 4E). Transitioning between states was also seen in TCRαβ but with much lower probability (Fig. 4F). A close examination of the reversible transition magnitude indicates that the complete transition includes one or more intermediate states. Energetically, force acting over the transition distance will modify the probability of the system being in the compact or extended state. At low force, the compact state is favored. As force increases, the extended state is favored. The direction is opposite for the forward and reverse transition, and thus force across the system will favor the extended state and disfavor the compact. The respective dwell periods, and corresponding transition rates, are exponentially related to the change in force/energy, for a given transition distance. We calculated the transition kinetics as a function of force for both N15pre-TCR and N15TCRαβ systems interacting with VSV8/Kb and found linear relationships on a log rate versus force plot (Fig. 5A). The crossing points where the forward and reverse transition rates are equal, in equilibrium, are at 14.5 and 13.8 pN for the N15pre-TCR and N15TCRαβ respectively (Fig. 5A). These crossing points represent the force where both receptors have an equal probability of being compact or extended with an average lifetime of 0.073 and 0.19 s for N15pre-TCR and N15TCRαβ, respectively. Given the equilibrium force is similar in both pre-TCR and TCRαβ, a common β subunit is presumably the element responsible for controlling the transition. Fig. 5B shows a schematic of one such receptor hopping between compact and extended states. In comparing the pre-TCR with TCRαβ, the overall reversible transition rate for N15pre-TCR is 1 order of magnitude faster than N15TCRαβ (Fig. 5C) suggesting the Vα domain stabilizes the extended conformation of N15TCRαβ.
FIGURE 5.
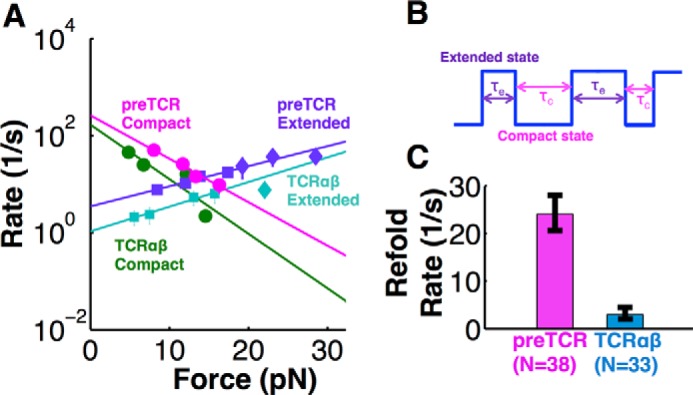
Kinetic analysis of reversible and single transitions. A, log of compact/extended rate versus force plots of reversible transitions (circles for compact, square for extended) and single transitions (diamonds) for VSV8/Kb with pre-TCR and TCRαβ. Points show mean ± S.E. In reversible transition, the rate of transitioning to the compact state (kc) for both the pre-TCR (events, n = 38) and TCRαβ (n = 33) decreases with force. The rate of extending (ke) increases with force for both pre-TCR (n = 41) and TCRαβ (n = 43). Plots are fitted using logarithmic equation of Bell model: k = k1exp(ΔxF/kbT) (Table 1). Compact and extended transition rates converge at a point, the equilibrium force, where faster rates are observed for the pre-TCR compared with TCRαβ. B, schematic profile of a reversible transition, showing hopping between compact and extended states with the compact rate (kc = 1/τe) and extended rate (ke = 1/τc), where τe is the lifetime of extended state, and τc is the lifetime of compact state. C, overall average refolding/compact rate (kc) for pre-TCR and TCRαβ with VSV8/Kb. Bars show mean ± S.E.
Cβ FG Loop Is Critical for Pre-TCR Ligand Discrimination at Higher Force
The similarity in mechanosensor performance between pre-TCR and TCRαβ systems suggests that receptor selection and development are largely controlled by modulating the strength of binding at the pMHC-receptor interface. Because the TCRαβ interaction with pMHC was shown to be modulated by the Cβ FG loop (21), we ascertained whether this is also the case for the pre-TCR, either by ligating the loop with H57 Fab (34) to lock this element in place (Fig. 6, A and B) or, alternatively, by deleting the FG loop through site-directed mutagenesis. As shown in Fig. 6, B and C, stabilizing the FG loop with the H57 Fab dramatically increases the N15pre-TCR/pMHC bond lifetime. The catch bond formed at ∼15 pN has an average lifetime of ∼40 s as opposed to 4 s without Fab addition. Irrelevant control Fab addition (H28) was without effect (data not shown). In contrast, deleting the FG loop destabilizes the pMHC interaction with the pre-TCR (Fig. 6C). As shown in Fig. 6D, the N15pre-TCR mutant ΔFGpre-TCR converts a catch bond profile to a slip bond for both VSV8/Kb and SEV9/Kb suggesting that the FG loop allosterically modulates the β chain-mediated pMHC interaction thereby controlling the mechanosensing of the pre-TCR apparatus. In comparison with the wild type (WT) N15pre-TCR ligand specificity profile in Fig. 2B, this result as further detailed in Fig. 6E is striking. With respect to the pre-TCR, it is noteworthy that the developmental transition of DN3 to DN4 thymocytes is reduced in N15ΔFGpre-TCR Rag2−/− mice relative to WTN15pre-TCR Rag2−/− mice (29). The present results imply that diminution of pre-TCR/pMHC bond lifetime negatively impacts expansion and developmental progression as described below.
FIGURE 6.

Cβ FG loop allosterically controls pTα-β heterodimer bond strength contributing to force-initiated dynamic signaling. A, single molecule assay showing stabilization of the pre-TCR-VSV8/Kb bond via the Cβ FG loop-specific H57 Fab. Box shows the schematic structural representation of pre-TCR·H57 Fab complex. This was created by visually overlaying TCRβ within PDB 1NFD onto TCRβ from PDB 3OF6 to place H57 onto the pre-TCR using PyMOL (57). B, H57 causes bond strengthening, revealed in force versus lifetime plot for VSV8/Kb. C, representative traces at indicated forces showing bond strengthening and sustained binding in H57 Fab (top trace) at 15 pN which typically do not exhibit a transition. In contrast, early transitioning is observed in the N15ΔFGpre-TCR-VSV8/Kb system (bottom traces). The transition is indicated by the green color followed by a post-transition state in blue. For the FG loop deletion, the transition occurs early in the pulling records, typically during the ramp phase. Rupture (red color) also occurs during the ramp phase for these records at 10, 16, and 20 pN. D, FG loop deletion in the N15pre-TCR (ΔFGpre-TCR) abolishes strengthened binding. The N15preTCR curve derives from Fig. 2B. E, ΔFGpre-TCR lacks ligand discrimination, with similar bond lifetimes with VSV8/Kb and SEV9/Kb. B, D, and E, points show mean ± S.E.
No Evidence for Pre-TCR Dimerization Relevant to Sustain pMHC Interaction
Because earlier crystallographic studies suggested that pre-TCR homodimers might exist either in head-to-tail or head-to-head configurations (35, 36), we directly tested those possibilities by tethering pre-TCRs on beads as well as surfaces (Fig. 7A). Although formally both parallel (36) and antiparallel (35) arrangements (Fig. 7A, boxed) are possible in this single molecule system, the strength of the pre-TCR/pre-TCR interaction was minimal compared with that of the pre-TCR/pMHC (VSV8/Kb) (Fig. 7B) and showed low tether counts per field of view. Tether counts for MP3 patch mutant homodimers were much lower than counts for WT (3.9 ± 0.3/field of view weakly associated tethers compared with 21.6 ± 0.5 measurable tethers/field for WT interactions, p < 0.00001), suggesting any such dimerization interaction is through the patch. However, because the Vβ patch is critical for strong pre-TCR binding to pMHC but occluded by pre-TCR homodimerization, these data reveal that an individual pTα-β heterodimer rather than a dimer of heterodimers is the receptor for pMHC in early thymocyte development. Whether pre-TCR homodimerization might negatively regulate pMHC binding under physiological conditions remains a formal possibility but appears unlikely given its weakness relative to the pre-TCR/pMHC interaction strength in SM analysis conducted here.
FIGURE 7.

Direct test of dimerization interaction with surface and bead tethered pre-TCRs. A, single molecule assay for pre-TCR dimerization. B, comparison between N15pre-TCR/N15pre-TCR interaction (black) and N15pre-TCR/pMHC (blue) bond lifetimes over different forces. This comparison uses N15pre-TCR/pMHC data from Fig. 2B. Points show mean ± S.E.
Force-induced Ligand Discrimination Is Also Observed for the N30pre-TCR
The N30pre-TCR (12, 31), which utilizes a distinct Vβ from N15pre-TCR, Vβ13 versus Vβ 5.2, with only 40% identity between V domains, exhibits binding profiles qualitatively similar to those seen for the N15 TCR and pre-TCR for a variety of pMHC ligands, including the canonical N30TCRαβ ligand VSV8/Kb (Fig. 8A). The N30pre-TCR forms a weak catch bond at 10 pN with VSV8/Kb exhibiting an average lifetime of 2 s, but it forms stronger catch bonds with OVA and Q4H7 compared with the VSV8 (Fig. 8, A and B). Like the N15pre-TCR, the N30pre-TCR forms a two-peak profile with Q4H7/Kb at 10 and 20 pN (Fig. 8B). Note, however, a second peak is not evident for N30pre-TCR with the other ligands tested. Thus, the N15 and N30 pre-TCRs manifest distinct pMHC ligand binding preferences. A similar transition to that seen in N15pre-TCR is observed with N30pre-TCR, but note how the N30pre-TCR manifests an ∼4-nm larger transition distance for OVA compared with VSV8 (Fig. 8, B and C). We also find that N30pre-TCR exhibits reversible transitioning in its interaction with OVA/Kb and Q4H7/Kb (Fig. 8, D and E, respectively) demonstrating the generality of this phenomena among pre-TCR and pMHC ligands.
FIGURE 8.
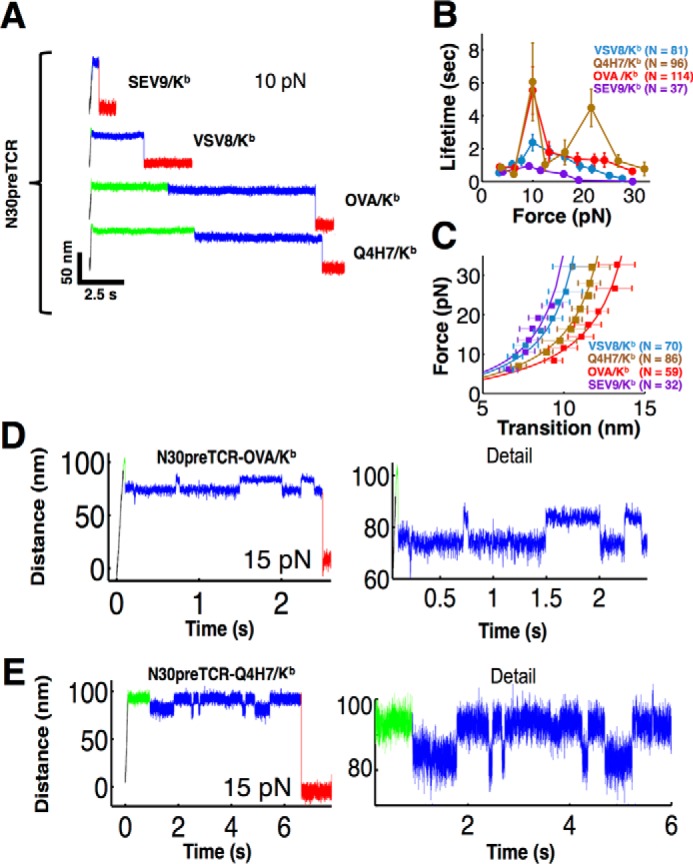
Force-induced bond strengthening, structural transition, and reversible hopping are also seen in N30pre-TCR/pMHC interactions. A, representative traces of N30pre-TCR/pMHC interaction. Pulling records are at ∼10 pN for N30pre-TCR/pMHC interactions. Colors indicate the ramp phase (black), pre-dwell (green), post-dwell (blue), and rupture (red). The weak binding ligands SEV9/Kb and VSV8/Kb transition early in the trace, and the stronger interacting ligands OVA/Kb and Q4H7/Kb show more extended lifetime. B, lifetime versus force plots for N30pre-TCR interacting with a variety of pMHC complexes (H-2Kb bound with indicated peptides) (solid colored traces). A two-peak structure is seen for Q4H7 (orange). B and C, points show mean ± S.E. C, force versus extension plots for N30pre-TCR interacting with the peptides shown in B along with WLC fits. The apparent contour lengths for the N30pre-TCR were 17.6, 15.7, 13.8, and 12.9 nm for OVA, Q4H7, VSV8, and SEV9, respectively. Representative traces at ∼15 pN exhibiting reverse transitioning in the N30pre-TCR with OVA/Kb (D) and Q4H7/Kb (E). The full trace is shown (left) and detail (right).
Functional Demonstration of Importance of the Vβ Patch Region
As shown in Fig. 9A, the N15 MP3pre-TCR as well as the comparable N30 MP3pre-TCR mutant drove significantly diminished thymocyte expansion beyond the DN3 thymocyte stage (DN4, immature single positive, DP, and mature single positive thymocytes) than their wild type pre-TCR counterparts. Significant differences were also observed at the DN3 stage as well (data not shown). These data confirm the importance of the patch in early thymocyte development. Note that not all pre-TCR-expressing thymocytes progress equivalently through subsequent developmental stages. Hence, the N30pre-TCR induces greater development and proliferation of post-DN3 cells than the N15pre-TCR. Because N30β is utilized as a subunit in the dominant TCRαβ specific for VSV8/Kb in B6 mice (31) this is of interest, implying that early fitness for self-pMHC at the DN stage may have contributed to repertoire selection for mature N30 αβT cells. As the Vβ CDR3 residues impact patch region access and distinct Vβ domains display sequence differences therein, some differential patch binding to pMHC among pre-TCRs is expected (Fig. 9B). Note that the CDR3 of N30β potentially modifies ligand accessibility to patch residues, in comparison with CDR3 of N15β that leaves a more “open” approach, illustrating the potential for recombination to change patch accessibility, perhaps modulating developmental progression. Variability in patch residues between germline V genes may also likely impact binding behavior.
FIGURE 9.
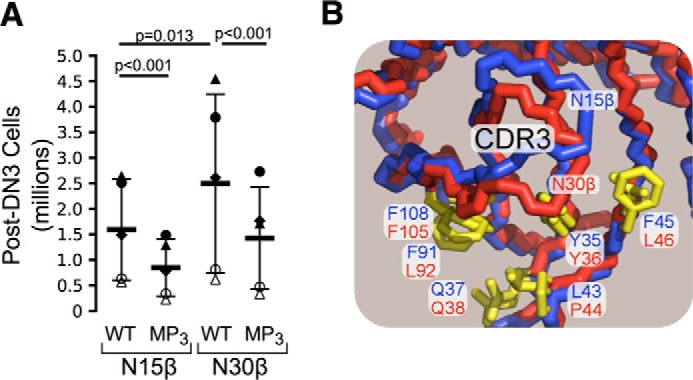
Impact of hydrophobic patch on pre-TCR function. A, mutagenesis of patch residues in N15β or N30β produces defects in proliferation and development beyond DN3 stage (MP3). TCRβ-transduced rag2−/− fetal liver progenitor cells were cultured for 7 days in the OP9-DL4 stromal cell culture system, and development was followed as described (12). n = 5 independent experiments. Each of the five symbols corresponds to a separate experiment. Thick bars represent mean, and thin bars represent S.D. with p values indicated. B, CDR3 structural variability modulates patch access. Backbone trace of N15β (blue) and N30βTCR (red) shown from the approximate perspective of an approaching pMHC. Highlighted are side chain stick representations of hydrophobic patch region residues in yellow with labels of each residue in blue or red for N15β or N30β. PDB files 3Q5Y and 3Q5T were used for N15β and N30β, respectively.
Pre-TCR Promotes Expansion of pMHC-reactive Thymocytes
Using CRISPR/Cas9 to create MHC-deficient OP9-DL4 stromal cells (Fig. 10A), we were able to show significantly diminished DN3 thymocyte proliferation and progression through DN4 to DP (Fig. 10B). This finding clearly underscores the pMHC dependence of a major component of early thymocyte development on self-pMHC. This diminishment of proliferation at the DN3 thymocyte stage and beyond was reversed with reintroduction of single chain VSV8-H-2Kb into the MHC class I null stromal cultures (Fig. 10B), in agreement with the importance of pre-TCR recognition of pMHC on thymic stroma for developmental progression. These results show that, in fact, it is the pre-TCR/self-pMHC interaction that fosters proliferation and progression. Of further interest, at the DN3 stage pre-TCR cross-linking with anti-CD3ϵ mAb, a strong activation stimulus, alone or in conjunction with the co-stimulator anti-CD28 mAb does not induce reduction in cell numbers (Fig. 11A) or apoptosis as assessed by annexin staining (Fig. 11, B and C) in contrast to these consequences at the DP or other post-DN3 stages. These findings are consistent with a role for the pre-TCR in propagating thymocytes selected by ligand-induced activation. We find no evidence for a “negative” selection process at the DN3 stage of development. Once the cells progress to DN4 and beyond, however, apoptosis is readily activated, pointedly even in the absence of TCRαβ because we introduced the β chain into Rag2−/− thymocytes with no capacity to rearrange endogenous TCRα genes. These findings show that developmental programming of receptor activation at the DN3 stage is quite distinct from that occurring at later stages.
FIGURE 10.

Elimination of pMHC in stromal cell cultures causes defects in proliferation of DN3 thymocytes and progression beyond DN3. A, generation of H-2 class I-negative OP9-DL4 stromal cells and re-expression of VSV8/H-2Kb. Left panel, parental OP9-DL4 cells expressing H-2 class I (WT). Center panel, β2-microglobulin and tap2-deficient OP9-DL4 cells (H-2 neg). Right panel, H-2 neg cells transfected with single chain VSV8 β2m-H-2Kb (H-2 neg + sc-H-2Kb). For each FACS panel the red line indicates rat IgG isotype control, and the green line depicts staining with rat M1–42 pan-H-2 class I. B, N15 or N30β-transduced Rag2−/− fetal liver progenitor cells were cultured for 7–8 days in the OP9-DL4 stromal cell culture system with either WT, β2m−/tap2− (H-2 neg), or H-2 neg transduced with sc-H-2Kb (H-2 neg + sc-H-2Kb) prior to analysis via FACS for cell numbers at DN3 or DN4, CD8ISP, and DP (post-DN3). For N15β, n = 11 independent experiments; for N30β, n = 10. Individual experimental results are shown with mean ± S.D. denoted as in Fig. 9.
FIGURE 11.
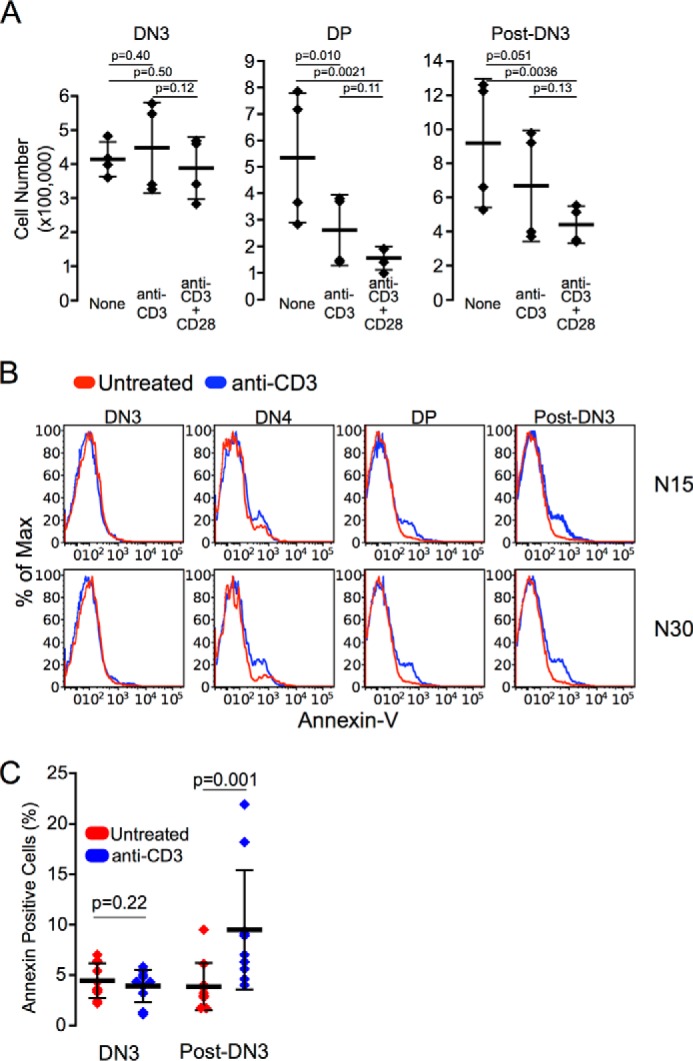
Strong activation of pre-TCR results in no apoptosis or reduced cellularity at the DN3 stage of development. A, activation of pre-TCR-expressing thymocytes results in loss of cellularity only after progression past DN3 stage. TCRβ-transduced Rag2−/− progenitor cells were cultured for 6 days in the OP9-DL4 stromal cell culture system prior to transfer of equivalent numbers to plates coated with anti-CD3, anti-CD3 + anti-CD28 mAbs, or untreated control plates. After 24 h, thymocytes were analyzed for development and cell numbers. Post-DN3 represents DN4, CD8 immature single positive and DP cells. n = 4 independent experiments with all data points, mean and S.D., and p values provided. B, TCRβ-transduced (N15 or N30) cells were cultured for 3 days in the OP9-DL4 stromal cell culture system prior to transfer of equivalent numbers to plates coated with anti-CD3 mAb or untreated control plates. After 24 h, thymocytes were analyzed by FACS for development, viability, and annexin V levels. Representative traces are shown. C, annexin V-positive cells are more prevalent in pre-TCR-activated anti-CD3 treated cultures only after progression beyond DN3. B and C, n = 5 independent experiments. A and C, bars show mean ± S.D.
Discussion
From an energetic perspective, the TCR transitions ∼10 nm at a force of ∼15 pN representing ∼150 pN·nm, or about 37 kBT, of work done on the system. Similar energetics apply to the pre-TCR. This is the equivalent to the energy available from hydrolysis of ∼2 ATP molecules. The initial extension, reversible transition, or both may energize the mechanosensor apparatus, transferring energy to drive conformational changes in CD3 domain transmembrane segments of the receptor complex, membrane lipid constituents, or other species coupled to the loaded structure. Such energy can facilitate downstream signaling, delivering energy to membrane-bound pre-TCR or αβTCR complex components, and ultimately lead to T-lineage activation. Given the reversible nature of the transition, this energy can potentially be stored in the extended state and returned to the system through recoil of the receptor complex. The extended structure may permit binding of pre-TCR or αβTCR complex components such as CD3 dimers to cryptic sites on pTα-β or TCRαβ heterodimers not normally accessible to unloaded states. The fact that both pre-TCR and TCRαβ have similar energetic requirements suggests the following. 1) They power a common cellular mechanism. 2) The pre-TCR Vβ CDR loops likely partner with the Vβ patch to mediate binding to achieve the threshold for energizing this mechanosensor, whereas the TCRαβ exploits Vβ and Vα CDRs (Fig. 1). 3) The mechanosensor operates far from thermal equilibrium, driven by an energetically rich environment using energy harvested from cell motility and other surveillance operations regulated by chemokines, integrins, plexins, and semaphorins (25, 37). Although the pre-TCR and TCRαβ have similar energetic requirements, the pre-TCR exhibits more reversible transitioning (Fig. 5C). The signaling requirements for DN3 and DN4 thymocytes are probably different compared with DP or single positive thymocytes or mature T cells. Given the increased ligand binding promiscuity of the pre-TCR, the opportunity for triggering and mechanosensor activation might be more readily available and facilitated by access to active Lck in the absence of co-receptor sequestration (38). In contrast, the less reversible TCRαβ, while still able to transition, stabilizes both the compact and extended states slowing both forward and reverse rates in comparison with the pre-TCR while maintaining a similar equilibrium force. This added stability may tighten the requirements for triggering in TCRαβ and help to ensure high fidelity antigen-specific triggering. The similarity in equilibrium force may reflect tight coupling of pre-TCR and TCRαβ heterodimer linkages to the associated CD3 mechanotransduction apparatus.
Our results support the view that the pre-TCR Vβ patch functions as a surrogate Vα-binding surface, strengthening Vβ interactions with pMHC mediated by its CDRs to a point where the mechanosensor apparatus can be engaged (Fig. 12). The mechanosensor features, including allosteric FG loop control, bond strengthening, ligand discrimination, and conformational transition are intrinsic to the pre-TCR apparatus. Our study, surveying a range of pMHC ligands interacting with both N15 and N30 pre-TCRs, revealed striking alterations in force-dependent binding signatures, conformational extension, and dynamics. Assuming these examples are representative of the β chain repertoire within the thymus, these features underscore the complexity of the mechanosensor system, which appears to leverage combinatorial binding synergies between patch and CDR loops with the ability to couple to subtle differences in receptor ligand interactions. Differences between the pre-TCR and TCRαβ performance trend with the greater compliance of the pre-TCR and its exposed patch associated with more promiscuous ligand specificity. This broader ligand focus allows a β chain to interact with multiple self-pMHC ligands in the richly pMHC-arrayed stromal environment, affording DN3 growth/survival advantage to pMHC binding competent pre-TCRs and imprinting self-reactivity in the developing repertoire. Self-reactivity can be modulated further through subsequent TCRα pairing at the DP stage of thymic selection to eliminate TCRαβ clonotypes with dangerous autoreactivity while preserving weak self-MHC binding of αβTCRs required for homeostatic T-cell proliferation (39, 40) also linked to enhanced reactivity toward foreign peptide-MHC antigen (41). The pre-TCR DN stage facilitates such properties through β testing. The reversible nature of the pre-TCR extensions may allow for repeated transitions through a recoil mechanism in this dynamic structure coupled to CD3 signaling dimers. At least in part, this behavior may relate to the activated state of thymocytes in this DN3 compartment (11). Understanding of the pre-TCR will offer insights into how the TCR is tuned and functions to recognize pMHC ligands through stringent filters of selection. Not surprisingly, this process is complexly ordered, given the critical task of imbuing the adaptive T-cell immune system with accurate self- versus non-self discrimination.
FIGURE 12.

Model of force-initiated pre-TCR signaling. During chemokine-driven DN3 movement (from left to right), interaction of a pre-TCR on a thymocyte with self-pMHC on a stromal cell initiates via Vβ CDR3s (white oval with cyan circumference) resulting in formation of the first of two catch bonds, followed by conformational change, Vβ patch interaction (white oval with red circumference) forming the second catch bond at higher force and β chain extension. Subsequently, alterations of transmembrane segments, plasma membrane, and associated lipid constituents (yellow ball) occur. Immunoreceptor tyrosine-based activation module (blue cylinders) are released from the various CD3 subunits' cytoplasmic segments, with downstream signaling following Lck-mediated phosphorylation (not shown). Release, recoil, and shortening perpetuate membrane changes to prolong signaling. Note that extension of the pre-TCR/pMHC complex may include conformational change, domain rotation, and unfolding. Only a section of the thymocyte membrane is shown. CD3ζζ is in dark grey, pictured to the left for clarity. Other CD3 components are as follows: CD3δ (yellow), CD3γ (green), and CD3ϵ (mint) with a second CD3ϵ obscured in this view. The β subunit is in blue; pTα is in pink, and the Cβ FG loop is represented by the undulatory magenta lines.
Experimental Procedures
TCRαβ and Pre-TCR Production and Purification
N15 TCRαβ was produced as described previously (21, 42). Briefly, separate chains were expressed in Freestyle 293F cells and purified from supernatants as a LZ paired heterodimer utilizing an anti-LZ mAb. The TCR and pre-TCR constructs consist of V and C ectodomains connected to the 20-amino acid LZ motif via a 15-residue flexible linker sequence. The heterodimer was covalently linked via the native disulfides located at the C-terminal end of each ectodomain. Folded protein was purified via LZ-specific antibody affinity column purification, as described previously (42). For the pre-TCR, pTα was fused to the basic component of the LZ, whereas N15 or N30β (12) was fused with the acidic component as before. Yields were uniformly lower for the pre-TCR than for the TCRαβ constructs, with pTα-β having a final yield of 0.4 μg/ml culture medium compared with 4 μg/ml previously seen for the N15TCRαβ heterodimer. The presence of both pTα and TCRβ was confirmed through SDS-PAGE separation, excision of the single band, trypsin digestion, and detection of peptides unique to both pTα and TCRβ by electrospray mass spectrometry. In cases where more than a single band was resolved via SDS-PAGE on material eluted from affinity columns, a single column separation using Superdex S200 size exclusion chromatography was sufficient to isolate a single correct species.
Production of N15ΔFGpre-TCR and N15MP3pre-TCR
The N15βΔFG construct wherein the Cβ FG loop was excised, as described in Ref. 21, was used for co-transfection with pTα to create N15pTαβΔFG, also referred to as ΔFGpre-TCR. Additionally, a triple mutant (Q37A/L43A/F103A) of TCRβ V domain residues known to be important in pMHC binding and promoting pre-T cell development (12), termed N15βMP3, was constructed and co-expressed with pTα.
Preparation of Biotinylated pMHC and H57 Fab
Biotinylated VSV8/Kb and SEV9/Kb were produced as described previously (21). Other pMHC complexes were obtained from the Tetramer Facility, National Institutes of Health. Relevant peptide sequences were as follows: VSV8, RGYVYQGL; SEV9, FAPGNYPAL; OVA(257–264), SIINFEKL; Q4H7, SIIQFEHL; and OVA(323–339), ISQAVHAAHAEINEAGR. All peptides bind Kb with the exception of OVA(323–339) that binds I-Ad. Fab fragments of H57 mAb (42) were produced using a Pierce micro preparation kit (Thermo Scientific).
Covalently Coupling the Half-antibody (2H11) to Single-stranded DNA
ssDNA containing a 5′-phosphate and 3′-amine ends was purchased from IDT. The IgG type LZ antibody (2H11) was cleaved to form half-antibodies by 2-mercaptoethylamine reduction. This half-antibody was then subsequently purified using desalted columns and covalently linked with the 3′ end of ssDNA by using a sulfosuccinimidyl 4-(N-maleimidomethyl)cyclohexane-1-carboxylate cross-linker.
Synthesis of DNA Handles and Tethers Binding to Beads
Carboxyl-polystyrene beads (1 μm diameter, Polysciences) were functionalized by cross-linking 3520-bp double-stranded DNA oligonucleotide tethers to the bead surface using a carbodiimide cross-linker strategy (EDC chemistry). We utilized the reverse primer TTT CCC GTG TCC CTC TCG AT/idSp/TTG AAA TAC CGA CCG TGT GA and forward primer AAT CCG CTT TGC TTC TGA CT. The dsDNA strands containing a 20-bp overhang on one end and an amine group on the other end were synthesized by PCR of a 3500-bp region of the M13mp18 plasmid with 5′ primers of an amino group and a 20-nucleotide overhang. DNA was covalently cross-linked to the bead surface with 1-ethyl-3-(3–4-dimethylaminopropyl) carbodiimide hydrochloride (Pierce Protein Research Products) as described earlier (43). The reaction was quenched with 50 mm Tris-HCl, pH 7.6, and the beads were washed extensively with TE buffer (10 mm Tris-HCl, pH 8.0, 1 mm EDTA) to remove free oligonucleotides. Beads containing DNA handles were stored at 4 °C. The DNA overhangs were eventually used as a handle for fusion with a complementary ssDNA containing the half-antibody 2H11.
Immobilizing TCRαβ and Pre-TCRs on Beads
The 20-nucleotide single-stranded overhang (5 phosphate-AT CGA GAG GGA CAC GGG AAA-3 prime amino modifier with a six-carbon spacer) at the distal end of the bead-bound DNA tether was designed to be complementary to that of the oligonucleotide attached to the half-antibody 2H11. The strategy provides a “sticky end” and allows for direct covalent coupling of the 2H11 and the functionalized beads via DNA ligation. For ligation, beads having dsDNA were equilibrated in T4 DNA ligase buffer (New England Biolabs), mixed with a complementary ssDNA strand covalently linked to 2H11 and T4 DNA ligase (New England Biolabs), and incubated overnight at 16 °C. After ligation, the 2H11 half-antibodies were extended from the bead surface by a 3520-bp tether of dsDNA. These beads were then centrifuged and resuspended with PBS buffer to remove excess ssDNA. The resulting beads were then incubated with the pre-TCR or TCRαβ heterodimers (50 ng/μl) for 30 min at room temperature. Excess receptors were separated from the beads by repetitive centrifugations and resuspension with PBST buffer. Beads were stored on ice prior to being introduced within the flow cell of the optical tweezers experiments.
Single Molecule Optical Tweezers Experiments
For single molecule measurements, the N15pre-TCR and pMHC complex was tethered via a DNA spacer between a trapped bead and glass surface as shown in Fig. 1B. Cover glass surfaces were functionalized with 1% biotin/PEG silane mixed with 99% PEG/silane similar to previously described work (21). Streptavidin (1 mg/ml) was introduced into a 10-μl flow cell prepared using double-sided sticky tape, incubated for 10 min, and exchanged with PBS buffer. A 20-μl volume of biotinylated pMHC (50 ng/1 μl) was introduced and incubated for 30 min and exchanged again with PBS buffer. The next incubation stage introduced a mixture of pre-TCR (100 ng/1 μl) and half-2H11-DNA-beads (200 ng/μl), ±H57 (1 mg/ml), which were incubated for 30 min followed by exchange/wash of 100 μl of PBS buffer and sealing with nail polish. The flow cell was loaded on the optical-trapping instrument for measurements. Tethers were found by eye and centered in the coincident trap/detector laser using an automated centering procedure (44). Trap stiffness was typically ∼0.20 pN/nm. Load was applied by displacing the piezo stage relative to the trap, and bead positions were antialias filtered at 1.5 kHz and recorded at 3 kHz until rupture. After rupture, beads were calibrated for position sensing using automated procedures. Control experiments where N15pre-TCR was excluded from the assay resulted in the formation of no tethers. The strength of the connecting elements along the loading pathway were verified by the increased lifetime and high force sustained by TCR-pMHC in the presence of H57 Fab, which contains identical connectivity.
Single Molecule Assay for Pre-TCR Dimerization
The pre-TCR dimerization assay (Fig. 7A) utilized a biotin-PEG functionalized cover glass to construct a flow cell as described above. Streptavidin (1 mg/ml) was introduced and incubated for 20 min. Excess streptavidin was removed by washing with 50 μl of PBS + 0.02% w/v Tween 20 (PBST). Next, 20 bp of DNA containing biotin at one end and the N15pre-TCR at the other end was introduced at 20 ng/μl and incubated for 30 min followed by a PBST wash. N15pre-TCR functionalized beads were then introduced and incubated for 30 min. Excess beads were removed by repetitive washing with PBST. N15pre-TCR dimers formed 21.6 ± 0.5 tethers per field of view (∼11,000 μm2). MP3 dimers exhibited 3.9 ± 0.3 tethers per field of view.
Fits to Extract Force-dependent Transition Rates
Bell model fits (Table 1) (45, 46) were performed for the N15pre-TCR-VSV8/Kb and N15TCRαβ-VSV8/Kb pre-dwell distributions found in Fig. 4, C and D. The fits were to Equation 1,
| (Eq. 1) |
where parameters k1 and k2 represent the unloaded rates and x1≠ and x2≠ represent the distance to the transition state. A two-exponential fit was optimal for the N15pre-TCR-VSV8/Kb and a single exponential fit for the N15TCRαβ-VSV8/Kb systems. The force-dependent extension kN(f) and reverse transition rates ku(f) were also determined by Bell model fits to our single molecule data (Fig. 5A) for both N15pre-TCR and N15TCRαβ with VSV8/Kb. We obtained the rate of forward and reverse transition at zero force as well as distances to the transition states for these directions (Table 1) according to Equation 2,
| (Eq. 2) |
where k1 represent the unloaded rate and x1≠ the distance to the transition state for the forward or reverse transition as indicated. The slope (x1≠) for forward transition (extended) is positive and negative for reverse transition (compact).
Contour Length Estimation from SM Pulling Experiments
We applied a worm-like chain model (47) to fit the pre-TCR conformational transition to obtain an effective contour length (Figs. 2C and 8C). A persistence length of 0.61 nm was assumed in the fits. The agonist pMHC exhibits a larger unfolding distance compared with a weak or irrelevant one. The WLC model fits (appropriate for an unfolded polypeptide where the persistence length is much smaller than the contour length) help to parameterize the observed transitions. Although we believe a portion of the transition may involve domain unfolding, other motions such as conformational change and domain rotation may contribute to the total transition distance.
OP9-DL4 Stromal Cell Culture
Development of pre-T cells was assayed as described in detail in Ref. 12. Pre-TCR containing a Vβ patch mutant of N30β (Q37A/P43A/F104A, N30β-MP3) was constructed analogously to the N15β-MP3 (12).
OP9-DL4 Stromal Cell Culture Apoptosis Measurements
Apoptosis was measured in a modified version of this procedure wherein TCRβ-transduced (N15 or N30) fetal liver progenitor cells from Rag2−/− mice were cultured for 3 or 6 days for the annexin V analysis or cell number analysis, respectively, in the OP9-DL4 stromal cell culture system prior to transfer of equivalent cell numbers to plates coated with anti-CD3 mAb (clone 145-2C11, 10 μg/ml, 2 ml/well), anti-CD3 and anti-CD28 (Pharmingen, 10 μg/ml), or untreated control plates. After 24 h, thymocytes were analyzed for development, viability, cell numbers, and/or annexin V levels. In place of the previously reported array of mAbs for analysis (12), cells were initially gated as 7-aminoactinomycin D low populations to exclude permeable/dead cells prior to gating for FSC/SSC, GFP, CD4/CD8, and DN1–4 (CD44/CD25) and finally annexin V-APC (eBioscience).
OP9-DL4 MHC-deficient and sc-VSV8-H-2Kb Cell Lines
To eliminate surface expression of the multigenic H-2 class I loci in OP9-DL4 stromal cells (48), the B2m and Tap2 loci were targeted for deletion using the CRISPR/Cas9 gene modification technique (49, 50). Using the CRISPR design portal, gRNA targeting exons 1 and 2 of B2m and exon 2 of Tap2, respectively, were designed and inserted into the pSpCas9(BB)-2A-Puro vector (PX459; Addgene (51)). Pairs of Cas9-gRNA constructs representing differing combinations of one B2m-targeting gRNA and one Tap2-targeting gRNA were transfected into OP9-DL4 cells. Following 5 days selection in puromycin, residual cells with surface H-2 class I were detected using the pan-MHC class I monoclonal antibody M1/42 (Biolegend (52)), and negative cells were selected. Following expansion, the sorting procedure was repeated, and several lines were established that were H-2 class I negative, as represented in Fig. 10A. Confirming the targeting of the desired loci, not only was H-2 suppressed but also the β2-microglobulin-dependent expression of CD1d (data not presented). To confirm the H-2-dependent functionality of OP9-DL4 in stimulating thymocyte development, H-2Kb was re-expressed in the OP9-DL4 H-2 negative cells using a single chain construct pcDNA3.1-sc-VSV-β2m-H-2Kb expressing VSV peptide, β2-m, and H-2Kb as a single chain (kindly provided by Dr. Nicholas Gascoigne (53)). Following selection in G418, individual clones of H-2Kb-expressing cells (detected by M1/42) were isolated of which clone 1.9 depicted in Fig. 10A is representative. Note that we detected no MHC class II on the surface of OP9-DL4 cells as reported previously (54, 55).
Statistical Analysis of Developmental Assays
Significance (p) was calculated by linear regression analysis to account for inter-experimental variability using the R software package (56).
Author Contributions
D. K. D. and R. J. M. designed and conducted the experiments, performed data analysis and interpretation, and drafted the manuscript. J. S. D.-C., R. E. H., and P. W. T. conducted thymic development experiments. M. H. conducted single molecule pre-TCR rupture experiments. G. W. provided editorial support and discussed project direction. M. J. L. and E. L. R. designed experiments, interpreted the data, and drafted the manuscript.
Acknowledgments
We thank the National Institutes of Health Tetramer Core Facility at Emory University and Cheng Zhu for providing the biotinylated OVA(257–264)/Kb, Q4H7/Kb, and OVA/I-Ad. We thank Wonmuk Hwang and Kendall Smith for helpful discussions.
This work was supported by National Institutes of Health Grants R01AI100643, R01AI37581, and P01GM047467; National Science Foundation Grant MCB-1330792; the Singapore-Massachusetts Institute of Technology Alliance for Research and Technology (SMART) Program; and American Association for Cancer Research Grant SU2C-AACR-DT-13-14. The authors declare that they have no conflicts of interest with the contents of this article. The content is solely the responsibility of the authors and does not necessarily represent the official views of the National Institutes of Health.
This article was selected as a Paper of the Week.
- TCR
- T cell receptor
- pre-TCR
- pre-T cell receptor
- pN
- piconewton
- DN3
- double negative 3
- CDR
- complementarity determining region
- DN
- double negative
- SM
- single molecule
- WLC
- worm-like chain
- LZ
- leucine zipper
- ssDNA
- single-stranded DNA
- PDB
- Protein Data Bank
- OVA
- ovalbumin
- DP
- double positive.
References
- 1. Wang J. H., and Reinherz E. L. (2012) The structural basis of αβ T-lineage immune recognition: TCR docking topologies, mechanotransduction, and co-receptor function. Immunol. Rev. 250, 102–119 [DOI] [PMC free article] [PubMed] [Google Scholar]
- 2. Rudolph M. G., Stanfield R. L., and Wilson I. A. (2006) How TCRs bind MHCs, peptides, and coreceptors. Annu. Rev. Immunol. 24, 419–466 [DOI] [PubMed] [Google Scholar]
- 3. Yin L., Scott-Browne J., Kappler J. W., Gapin L., and Marrack P. (2012) T cells and their eons-old obsession with MHC. Immunol. Rev. 250, 49–60 [DOI] [PMC free article] [PubMed] [Google Scholar]
- 4. Goldrath A. W., and Bevan M. J. (1999) Selecting and maintaining a diverse T-cell repertoire. Nature 402, 255–262 [DOI] [PubMed] [Google Scholar]
- 5. Ciofani M., and Zúñiga-Pflücker J. C. (2006) A survival guide to early T cell development. Immunol. Res. 34, 117–132 [DOI] [PubMed] [Google Scholar]
- 6. von Boehmer H. (2014) The thymus in immunity and in malignancy. Cancer Immunol. Res. 2, 592–597 [DOI] [PubMed] [Google Scholar]
- 7. Cheng A. M., Negishi I., Anderson S. J., Chan A. C., Bolen J., Loh D. Y., and Pawson T. (1997) The Syk and ZAP-70 SH2-containing tyrosine kinases are implicated in pre-T cell receptor signaling. Proc. Natl. Acad. Sci. U.S.A. 94, 9797–9801 [DOI] [PMC free article] [PubMed] [Google Scholar]
- 8. Groves T., Smiley P., Cooke M. P., Forbush K., Perlmutter R. M., and Guidos C. J. (1996) Fyn can partially substitute for Lck in T lymphocyte development. Immunity 5, 417–428 [DOI] [PubMed] [Google Scholar]
- 9. Malissen M., Gillet A., Ardouin L., Bouvier G., Trucy J., Ferrier P., Vivier E., and Malissen B. (1995) Altered T cell development in mice with a targeted mutation of the CD3-ϵ gene. EMBO J. 14, 4641–4653 [DOI] [PMC free article] [PubMed] [Google Scholar]
- 10. Trampont P. C., Tosello-Trampont A. C., Shen Y., Duley A. K., Sutherland A. E., Bender T. P., Littman D. R., and Ravichandran K. S. (2010) CXCR4 acts as a costimulator during thymic β-selection. Nat. Immunol. 11, 162–170 [DOI] [PMC free article] [PubMed] [Google Scholar]
- 11. Yamasaki S., Ishikawa E., Sakuma M., Ogata K., Sakata-Sogawa K., Hiroshima M., Wiest D. L., Tokunaga M., and Saito T. (2006) Mechanistic basis of pre-T cell receptor-mediated autonomous signaling critical for thymocyte development. Nat. Immunol. 7, 67–75 [DOI] [PubMed] [Google Scholar]
- 12. Mallis R. J., Bai K., Arthanari H., Hussey R. E., Handley M., Li Z., Chingozha L., Duke-Cohan J. S., Lu H., Wang J. H., Zhu C., Wagner G., and Reinherz E. L. (2015) Pre-TCR ligand binding impacts thymocyte development before αβTCR expression. Proc. Natl. Acad. Sci. U.S.A. 112, 8373–8378 [DOI] [PMC free article] [PubMed] [Google Scholar]
- 13. Smelty P., Marchal C., Renard R., Sinzelle L., Pollet N., Dunon D., Jaffredo T., Sire J. Y., and Fellah J. S. (2010) Identification of the pre-T-cell receptor α chain in nonmammalian vertebrates challenges the structure-function of the molecule. Proc. Natl. Acad. Sci. U.S.A. 107, 19991–19996 [DOI] [PMC free article] [PubMed] [Google Scholar]
- 14. Irving B. A., Alt F. W., and Killeen N. (1998) Thymocyte development in the absence of pre-T cell receptor extracellular immunoglobulin domains. Science 280, 905–908 [DOI] [PubMed] [Google Scholar]
- 15. Crump A. L., Grusby M. J., Glimcher L. H., and Cantor H. (1993) Thymocyte development in major histocompatibility complex-deficient mice: evidence for stochastic commitment to the CD4 and CD8 lineages. Proc. Natl. Acad. Sci. U.S.A. 90, 10739–10743 [DOI] [PMC free article] [PubMed] [Google Scholar]
- 16. Ilani T., Vasiliver-Shamis G., Vardhana S., Bretscher A., and Dustin M. L. (2009) T cell antigen receptor signaling and immunological synapse stability require myosin IIA. Nat. Immunol. 10, 531–539 [DOI] [PMC free article] [PubMed] [Google Scholar]
- 17. Kim S. T., Takeuchi K., Sun Z. Y., Touma M., Castro C. E., Fahmy A., Lang M. J., Wagner G., and Reinherz E. L. (2009) The αβ T cell receptor is an anisotropic mechanosensor. J. Biol. Chem. 284, 31028–31037 [DOI] [PMC free article] [PubMed] [Google Scholar]
- 18. Kim S. T., Shin Y., Brazin K., Mallis R. J., Sun Z. Y., Wagner G., Lang M. J., and Reinherz E. L. (2012) TCR mechanobiology: torques and tunable structures linked to early T cell signaling. Front. Immunol. 3, 76. [DOI] [PMC free article] [PubMed] [Google Scholar]
- 19. Ma Z., Discher D. E., and Finkel T. H. (2012) Mechanical force in T cell receptor signal initiation. Front. Immunol. 3, 217. [DOI] [PMC free article] [PubMed] [Google Scholar]
- 20. Kuhns M. S., and Davis M. M. (2012) TCR signaling emerges from the sum of many parts. Front. Immunol. 3, 159. [DOI] [PMC free article] [PubMed] [Google Scholar]
- 21. Das D. K., Feng Y., Mallis R. J., Li X., Keskin D. B., Hussey R. E., Brady S. K., Wang J. H., Wagner G., Reinherz E. L., and Lang M. J. (2015) Force-dependent transition in the T-cell receptor β-subunit allosterically regulates peptide discrimination and pMHC bond lifetime. Proc. Natl. Acad. Sci. U.S.A. 112, 1517–1522 [DOI] [PMC free article] [PubMed] [Google Scholar]
- 22. Liu B., Chen W., Evavold B. D., and Zhu C. (2014) Accumulation of dynamic catch bonds between TCR and agonist peptide-MHC triggers T cell signaling. Cell 157, 357–368 [DOI] [PMC free article] [PubMed] [Google Scholar]
- 23. Hu K. H., and Butte M. J. (2016) T cell activation requires force generation. J. Cell Biol. 213, 535–542 [DOI] [PMC free article] [PubMed] [Google Scholar]
- 24. Li Y. C., Chen B. M., Wu P. C., Cheng T. L., Kao L. S., Tao M. H., Lieber A., and Roffler S. R. (2010) Cutting edge: mechanical forces acting on T cells immobilized via the TCR complex can trigger TCR signaling. J. Immunol. 184, 5959–5963 [DOI] [PubMed] [Google Scholar]
- 25. Choi Y. I., Duke-Cohan J. S., Chen W., Liu B., Rossy J., Tabarin T., Ju L., Gui J., Gaus K., Zhu C., and Reinherz E. L. (2014) Dynamic control of β1 integrin adhesion by the plexinD1-sema3E axis. Proc. Natl. Acad. Sci. U.S.A. 111, 379–384 [DOI] [PMC free article] [PubMed] [Google Scholar]
- 26. Choi Y. I., Duke-Cohan J. S., Ahmed W. B., Handley M. A., Mann F., Epstein J. A., Clayton L. K., and Reinherz E. L. (2008) PlexinD1 glycoprotein controls migration of positively selected thymocytes into the medulla. Immunity 29, 888–898 [DOI] [PMC free article] [PubMed] [Google Scholar]
- 27. Brazin K. N., Mallis R. J., Das D. K., Feng Y., Hwang W., Wang J. H., Wagner G., Lang M. J., and Reinherz E. L. (2015) Structural features of the αβTCR mechanotransduction apparatus that promote pMHC discrimination. Front. Immunol. 6, 441. [DOI] [PMC free article] [PubMed] [Google Scholar]
- 28. Sasada T., Touma M., Chang H. C., Clayton L. K., Wang J. H., and Reinherz E. L. (2002) Involvement of the TCR Cβ FG loop in thymic selection and T cell function. J. Exp. Med. 195, 1419–1431 [DOI] [PMC free article] [PubMed] [Google Scholar]
- 29. Touma M., Chang H. C., Sasada T., Handley M., Clayton L. K., and Reinherz E. L. (2006) The TCR Cβ FG loop regulates αβ T cell development. J. Immunol. 176, 6812–6823 [DOI] [PubMed] [Google Scholar]
- 30. Liu Y., Blanchfield L., Ma V. P., Andargachew R., Galior K., Liu Z., Evavold B., and Salaita K. (2016) DNA-based nanoparticle tension sensors reveal that T-cell receptors transmit defined pN forces to their antigens for enhanced fidelity. Proc. Natl. Acad. Sci. U.S.A. 113, 5610–5615 [DOI] [PMC free article] [PubMed] [Google Scholar]
- 31. Imarai M., Goyarts E. C., van Bleek G. M., and Nathenson S. G. (1995) Diversity of T cell receptors specific for the VSV antigenic peptide (N52–59) bound by the H-2Kb class I molecule. Cell. Immunol. 160, 33–42 [DOI] [PubMed] [Google Scholar]
- 32. Le Trong I., Aprikian P., Kidd B. A., Forero-Shelton M., Tchesnokova V., Rajagopal P., Rodriguez V., Interlandi G., Klevit R., Vogel V., Stenkamp R. E., Sokurenko E. V., and Thomas W. E. (2010) Structural basis for mechanical force regulation of the adhesin FimH via finger trap-like β sheet twisting. Cell 141, 645–655 [DOI] [PMC free article] [PubMed] [Google Scholar]
- 33. Castro C. E., Dong J., Boyce M. C., Lindquist S., and Lang M. J. (2011) Physical properties of polymorphic yeast prion amyloid fibers. Biophys. J. 101, 439–448 [DOI] [PMC free article] [PubMed] [Google Scholar]
- 34. Wang J., Lim K., Smolyar A., Teng M., Liu J., Tse A. G., Liu J., Hussey R. E., Chishti Y., Thomson C. T., Sweet R. M., Nathenson S. G., Chang H. C., Sacchettini J. C., and Reinherz E. L. (1998) Atomic structure of an αβ T cell receptor (TCR) heterodimer in complex with an anti-TCR fab fragment derived from a mitogenic antibody. EMBO J. 17, 10–26 [DOI] [PMC free article] [PubMed] [Google Scholar]
- 35. Pang S. S., Berry R., Chen Z., Kjer-Nielsen L., Perugini M. A., King G. F., Wang C., Chew S. H., La Gruta N. L., Williams N. K., Beddoe T., Tiganis T., Cowieson N. P., Godfrey D. I., Purcell A. W., et al. (2010) The structural basis for autonomous dimerization of the pre-T-cell antigen receptor. Nature 467, 844–848 [DOI] [PubMed] [Google Scholar]
- 36. Zhou B., Chen Q., Mallis R. J., Zhang H., Liu J. H., Reinherz E. L., and Wang J. H. (2011) A conserved hydrophobic patch on Vβ domains revealed by TCRβ chain crystal structures: implications for pre-TCR dimerization. Front. Immunol. 2, 5. [DOI] [PMC free article] [PubMed] [Google Scholar]
- 37. Love P. E., and Bhandoola A. (2011) Signal integration and crosstalk during thymocyte migration and emigration. Nat. Rev. Immunol. 11, 469–477 [DOI] [PMC free article] [PubMed] [Google Scholar]
- 38. Nika K., Soldani C., Salek M., Paster W., Gray A., Etzensperger R., Fugger L., Polzella P., Cerundolo V., Dushek O., Höfer T., Viola A., and Acuto O. (2010) Constitutively active Lck kinase in T cells drives antigen receptor signal transduction. Immunity 32, 766–777 [DOI] [PMC free article] [PubMed] [Google Scholar]
- 39. Ernst B., Lee D. S., Chang J. M., Sprent J., and Surh C. D. (1999) The peptide ligands mediating positive selection in the thymus control T cell survival and homeostatic proliferation in the periphery. Immunity 11, 173–181 [DOI] [PubMed] [Google Scholar]
- 40. Goldrath A. W., and Bevan M. J. (1999) Low-affinity ligands for the TCR drive proliferation of mature CD8+ T cells in lymphopenic hosts. Immunity 11, 183–190 [DOI] [PMC free article] [PubMed] [Google Scholar]
- 41. Fulton R. B., Hamilton S. E., Xing Y., Best J. A., Goldrath A. W., Hogquist K. A., and Jameson S. C. (2015) The TCR's sensitivity to self- peptide-MHC dictates the ability of naive CD8(+) T cells to respond to foreign antigens. Nat. Immunol. 16, 107–117 [DOI] [PMC free article] [PubMed] [Google Scholar]
- 42. Liu J., Tse A. G., Chang H. C., Liu Jh, Wang J., Hussey R. E., Chishti Y., Rheinhold B., Spoerl R., Nathenson S. G., Sacchettini J. C., and Reinherz E. L. (1996) Crystallization of a deglycosylated T cell receptor (TCR) complexed with an anti-TCR Fab fragment. J. Biol. Chem. 271, 33639–33646 [DOI] [PubMed] [Google Scholar]
- 43. Kaiser C. M., Goldman D. H., Chodera J. D., Tinoco I. Jr., and Bustamante C. (2011) The ribosome modulates nascent protein folding. Science 334, 1723–1727 [DOI] [PMC free article] [PubMed] [Google Scholar]
- 44. Lang M. J., Asbury C. L., Shaevitz J. W., and Block S. M. (2002) An automated two-dimensional optical force clamp for single molecule studies. Biophys. J. 83, 491–501 [DOI] [PMC free article] [PubMed] [Google Scholar]
- 45. Bell G. I. (1978) Models for the specific adhesion of cells to cells. Science 200, 618–627 [DOI] [PubMed] [Google Scholar]
- 46. Goldman D. H., Kaiser C. M., Milin A., Righini M., Tinoco I. Jr., and Bustamante C. (2015) Ribosome. Mechanical force releases nascent chain-mediated ribosome arrest in vitro and in vivo. Science 348, 457–460 [DOI] [PMC free article] [PubMed] [Google Scholar]
- 47. Liphardt J., Onoa B., Smith S. B., Tinoco I. Jr., and Bustamante C. (2001) Reversible unfolding of single RNA molecules by mechanical force. Science 292, 733–737 [DOI] [PubMed] [Google Scholar]
- 48. Mohtashami M., Shah D. K., Nakase H., Kianizad K., Petrie H. T., and Zúñiga-Pflücker J. C. (2010) Direct comparison of Dll1- and Dll4-mediated Notch activation levels shows differential lymphomyeloid lineage commitment outcomes. J. Immunol. 185, 867–876 [DOI] [PubMed] [Google Scholar]
- 49. Bjorkman P. J., and Parham P. (1990) Structure, function, and diversity of class I major histocompatibility complex molecules. Annu. Rev. Biochem. 59, 253–288 [DOI] [PubMed] [Google Scholar]
- 50. Pyzocha N. K., Ran F. A., Hsu P. D., and Zhang F. (2014) RNA-guided genome editing of mammalian cells. Methods Mol. Biol. 1114, 269–277 [DOI] [PubMed] [Google Scholar]
- 51. Ran F. A., Hsu P. D., Wright J., Agarwala V., Scott D. A., and Zhang F. (2013) Genome engineering using the CRISPR-Cas9 system. Nat. Protoc. 8, 2281–2308 [DOI] [PMC free article] [PubMed] [Google Scholar]
- 52. Stallcup K. C., Springer T. A., and Mescher M. F. (1981) Characterization of an anti-H-2 monoclonal antibody and its use in large-scale antigen purification. J. Immunol. 127, 923–930 [PubMed] [Google Scholar]
- 53. Hoerter J. A., Brzostek J., Artyomov M. N., Abel S. M., Casas J., Rybakin V., Ampudia J., Lotz C., Connolly J. M., Chakraborty A. K., Gould K. G., and Gascoigne N. R. (2013) Coreceptor affinity for MHC defines peptide specificity requirements for TCR interaction with coagonist peptide-MHC. J. Exp. Med. 210, 1807–1821 [DOI] [PMC free article] [PubMed] [Google Scholar]
- 54. Dai B., and Wang P. (2009) In vitro differentiation of adult bone marrow progenitors into antigen-specific CD4 helper T cells using engineered stromal cells expressing a notch ligand and a major histocompatibility complex class II protein. Stem Cells Dev. 18, 235–245 [DOI] [PMC free article] [PubMed] [Google Scholar]
- 55. Zúñiga-Pflücker J. C. (2004) Innovation–T-cell development made simple. Nat. Rev. Immunol. 4, 67–72 [DOI] [PubMed] [Google Scholar]
- 56. R Core Team (2015) A Language and Environment for Statistical Computing. Version 3.3.1 R Foundation for Statistical Computing, Vienna, Austria [Google Scholar]
- 57. DeLano W. L. (2010) The PyMOL Molecular Graphics System, Version 1.3r1 Schrödinger, LLC, New York [Google Scholar]