

Abstract
Nrf2 is a master transcription factor that regulates a wide variety of cellular proteins by recognizing and binding to antioxidant response elements (AREs) in their gene promoter regions. In this study we show that increasing cellular Nrf2 results in transcriptional activation of the gene for mTOR, which is central to the PI3K signaling pathway. This is the case in cells with normal physiological PI3K. However, in cells with abnormally active PI3K increased cellular Nrf2 levels have no effect on mTOR. ChIP assays results show that increased Nrf2 binding is associated with decreased p65 binding and H3-K27me3 signal (marker of gene repression) as well as increased H3-K4me3 signal (marker of gene activation). However, in cells with PI3K activation, no effect of cellular Nrf2 increase on mTOR transcription was observed. In these cells, increasing Nrf2 levels increases Nrf2 promoter binding marginally, whereas p65 binding and H3-K27me3 mark were significantly increased, and H3-K4me3 signal is reduced. Together, these data show for the first time that Nrf2 directly regulates mTOR transcription when the PI3K pathway is intact, whereas this function is lost when PI3K is activated. We have identified a link between the Nrf2 system of sensing environmental stress and mTOR, which is a key cellular protein in metabolism. Studies in cells with activating mutations in the PI3K pathway suggest that Nrf2 transcriptional regulation of mTOR is related to promoter binding of p65 and of methylation of histone residues permissive of transcription.
Keywords: histone methylation, mammalian target of rapamycin (mTOR), NF-κB (NF-KB), nuclear factor 2 (erythroid-derived 2-like factor) (NFE2L2) (Nrf2), phosphatidylinositol kinase (PI kinase)
Introduction
The cellular detoxification system plays a vital role in maintaining cell homeostasis and providing a defense mechanism against oxidative and electrophilic stresses (1, 2). These stressors are known to cause cell injury and/or cancer-specific metabolic reprogramming. Nrf2, a cap'n collar basic leucine zipper transcription factor, is a vital part of the cyto-protective apparatus of the cellular detoxification system (3). It is responsible for the activation of various detoxifying proteins including intracellular redox-balancing proteins, phase II drug metabolizing enzymes, and Phase III membrane efflux transporters such as multidrug resistance-associated proteins (4–6). In normal physiological conditions, Nrf2 maintains a housekeeping expression of target genes by forming a complex with Keap1 and Cul3 in the cytosol, resulting in the degradation of the Nrf2 protein by the ubiquitin-proteasome pathway (4, 7). However, in the presence of stressors, Nrf2 escapes the inhibitory effect of Keap1 and/or Cul3, and translocates to the nucleus where it dimerizes with other bZIP proteins, like small Maf proteins, and binds to the anti-oxidant response elements (AREs)3 to activate a battery of cytoprotective and anti-oxidant gene targets (1). AREs are cis-acting regulatory elements present in the promoters of Nrf2 target genes and are present as single or multiple copies (8). Numerous studies using deletion and mutational analysis identified the core ARE sequence to be 5′-TGACNNNGC-3′ (9, 10). This same core ARE sequence has also been used, via bioinformatics algorithms, to identify putative targets of Nrf2 (9).
The phosphatidylinositol 3-kinase (PI3K) pathway plays a vital role in cell survival and is involved in metabolism, apoptosis, cell growth, differentiation, calcium signaling, and insulin signaling (11). The main components of this pathway include AKT, TSC2, and mTOR. The latter has a central role in various signaling pathways responsible for the intra- and extracellular detection of nutrient levels, functioning as a metabolic regulator of cellular anabolic and catabolic processes, which couple growth signals to nutrient availability via ribosome biogenesis and autophagy, many processes that can generate reactive oxygen species (12–16). mTOR is a component of two functionally and structurally distinct complexes, namely, rapamycin-sensitive mTOR complex 1 (mTORC1) and rapamycin-insensitive mTOR complex 2 (mTORC2) (13, 14). mTORC1 is involved in the regulation of translation, autophagy, growth, lipid biosynthesis, mitochondria, and ribosome biogenesis, whereas mTORC2 is known to control cell survival and proliferation (13, 14). Inhibition of mTOR activity has been the aim of intense anti-cancer clinical research in recent years, including in anti-cancer therapeutics, as it is a critically important feature of cancer cells (17–19).
Some cross-talk between Nrf2 signaling and other prominent signaling pathways has been documented, including PI3K and ERK pathways (20–23). Utilizing the core ARE motif, a combination of ChIP-Seq, global transcriptional profiling, and microarrays were performed to elucidate different targets and the multiple regulatory networks of Nrf2. This has shed light on the functional significance of Nrf2 as a transcription factor regulating genes unrelated to cytoprotection (10), long considered the primary functional targets of Nrf2. Directly or indirectly, Nrf2 levels modulate a myriad of cell survival processes such as cell cycle, apoptosis, autophagy, and inflammation (10). Interestingly, Nrf2 has been shown to indirectly regulate members of the PI3K pathway. A mutated form of Nrf2 affects mTOR activity indirectly via another protein called RagD (24), whereas another study showed that Nrf2 affects melanogenesis by modulating the activity of different components of the PI3K pathway, including AKT, S6K, and mTOR (25).
However, to our knowledge, no studies have determined whether modulation of Nrf2 expression directly leads to a change in mRNA and protein expression of components of the PI3K pathway nor the mechanism of any such effects. Preliminary data in our laboratory in human cell lines showed that in cells with a normal physiological PI3K pathway, increasing the level of Nrf2 results in higher mTOR protein levels. It is, however, not clear whether this regulation happens at the transcription or at the protein level only and whether it is a direct or indirect interaction. The goal of the present is to elucidate the nature of regulation of mTOR by Nrf2.
Results
Measure of mRNA and Protein Levels
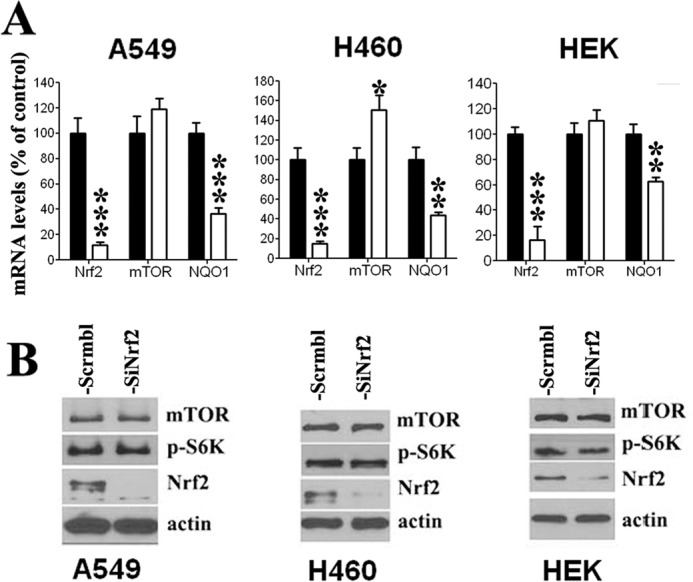
In the case of Nrf2 induction, two human non-small cell lung cancer cell lines, A549 and H460, were transfected with Nrf2 cDNA (FLAG-Nrf2), resulting in Nrf2 overexpression in both cell lines as measured by mRNA (Fig. 1A) and protein levels (Fig. 1B). Interestingly, the effect of Nrf2 increase on mTOR was different in the two cell lines. In A549 cells, which bear no PI3K pathway mutations, both mRNA and protein levels of mTOR were increased in the presence of higher Nrf2 levels (Fig. 1, A and B). In contrast, in H460, which has a recognized activating PI3K mutation, a small decrease, although not significant, was observed in MTOR mRNA levels (Fig. 1A), whereas no apparent change in mTOR protein levels was observed (Fig. 1B). To generate conditions of decreased cellular Nrf2, the two cell lines were transfected with siNrf2, leading to a strong decrease in Nrf2 expression (Fig. 2, A and B). In A549 cells, Nrf2 down-regulation had no effect on mTOR expression (Fig. 2, A and B), whereas in H460 cells, Nrf2 knockdown was associated with an increase in MTOR mRNA levels (Fig. 2A), but no apparent change in levels of mTOR protein was observed (Fig. 2B). To determine if the observed Nrf2 effect is restricted to malignant cells, we measured mTOR expression in conditions of Nrf2 overexpression and Nrf2 knockdown in the human embryonic kidney (HEK) cells, a non-malignant immortalized cell line. When Nrf2 was overexpressed, mTOR mRNA and protein levels were increased (Fig. 1, A and B), whereas mTOR levels were not affected after Nrf2 knockdown (Fig. 2, A and B), a result similar to that observed in A549 cells. Increase of mTOR expression in A549 and HEK cells translated into increased mTOR activity, as phosphorylation of its downstream targets, phospho-S6K and p4E-BP1, were up-regulated in both cell lines (Fig. 1B). In contrast, in H460 cells the increase in MTOR mRNA levels observed Nrf2 knockdown did not lead to a change in mTOR protein expression or activity (Fig. 2B). As a control for Nrf2 activity, we measured the effect of Nrf2 modulation on NQO1 expression, a well documented target of Nrf2. As expected, NQO1 expression in the three cell lines increased after Nrf2 induction (Fig. 1A) and decreased after Nrf2 knockdown (Fig. 2A).
FIGURE 1.

Nrf2 overexpression modulates mTOR expression in a cell line-dependent manner. A, increased Nrf2 levels induces up-regulates mTOR transcription both in A549 and HEK cells, whereas a modest decrease was observed in H460 cells. As a positive control, NQO1 mRNA levels were increased in the three cell lines after Nrf2 overexpression. Values represent a ratio relative to GAPDH mRNA levels and are expressed as percentage of pcDNA-transfected controls. B, protein levels as well as mTOR activity (assessed by p-S6K levels) were increased after Nrf2 overexpression both in A549 and HEK cells. Increased Nrf2 levels in H460 cells did not induce any significant change in mTOR protein levels or mTOR activity. mRNA data are expressed as the mean ± S.D. (n = 3). *, p < 0.05; **, p < 0.01; ***, p < 0.001 versus control pcDNA-transfected cells. The Western blot figure is representative of at least three different experiments.
FIGURE 2.
Nrf2 down-regulation had little effect on mTOR expression and activity. A, decreased Nrf2 levels had no effect on mTOR transcription in A549 and HEK cells, whereas a small increase in mTOR mRNA levels was observed in H460 cells. NQO1 mRNA levels significantly decreased in the three cell lines after Nrf2 knockdown. Values represent a ratio relative to GAPDH mRNA levels and expressed as percentage of scrambled-transfected controls. B, protein levels as well as activity of mTOR did not change after Nrf2 down-regulation in the three cell lines. mRNA data are expressed as the mean ± S.D. (n = 3). *, p < 0.05; **, p < 0.01; ***, p < 0.001 versus scrambled-transfected cells. The Western blot figure is representative of at least three different experiments.
Nrf2 Can Regulate MTOR Promoter Activity
To demonstrate that Nrf2 affects MTOR transcription by acting on its promoter, we cloned promoter fragments containing the ARE core sequence from MTOR and NQO1 upstream of firefly luciferase (pGL3-MTOR and pGL3-NQO1 vectors, respectively) (Fig. 3A) and transfected them into the studied cell lines. The relative luciferase activity of the MTOR promoter was expressed as a ratio of the pGL3-MTOR (or pGL3-NQO1 in the case of NQO1) reporter activity to that of the control plasmid pRL (Renilla luciferase) and was measured in conditions of Nrf2 down-regulation and Nrf2 overexpression. Consistent with our findings at the mRNA and protein levels, Nrf2 induction led to an increased MTOR promoter activity in A549 and HEK cells (Fig. 3B), whereas in H460 cells we observed a small decrease, which is not significant, in MTOR promoter activity (Fig. 3B). On the other hand, Nrf2 down-regulation significantly increased MTOR promoter activity in H460 cells (Fig. 3B) and had no effect on MTOR in A549 and HEK cells (Fig. 3B), which is consistent with data observed from mRNA and protein analysis.
FIGURE 3.

A, promoter region constructs of mTOR and NQO1 genes used in luciferase (Luc) assay. The ARE we identified in mTOR promoter is located 723 bp upstream of TSS. The mutant ARE in the MTOR promoter is lacking 3 bp of the ARE sequence (TCA in bold). The ARE in the NQO1 promoter is located 185 bp upstream of TSS. The mutant ARE in NQO1 promoter is lacking 3 bp of the ARE sequence (TGA in bold). B, Nrf2 acts on promoter regions of mTOR and NQO1; Nrf2 down-regulation had no effect on mTOR promoter activity in A549 and HEK cells, whereas an increase in activity was observed in H460 cells. Nrf2 overexpression increased mTOR promoter activity in both A549 and HEK cells, whereas a small decrease was observed in H460 cells. Mutation of the ARE sequence in the mTOR promoter cancelled the Nrf2 effects. The NQO1 promoter activity was regulated by Nrf2 modulation. Promoter activity increased when Nrf2 was up-regulated and decreased in the case of Nrf2 knockdown. As expected, when the ARE sequence of NQO1 promoter was mutated, promoter activity did not respond to changes in Nrf2 levels. C, mutation of the ARE sequence had no significant effect on MTOR promoter activity in H460 and HEK cells, whereas it had a significant decrease (−25%) in A549 cells. Mutation of ARE dramatically decreased NQO1 promoter activity in the three cell lines. The results are presented as the percentage of luciferase activity of pCDNA-transfected controls in the case of Nrf2 overexpression and as a percentage of luciferase activity of scrambled siRNA-transfected controls in the case of Nrf2 down-regulation. Data are expressed as the mean ± S.D. of at least three different experiments. *, p < 0.05; ***, p < 0.001compared to control condition.
Mutation in the ARE sequence of MTOR promoter, which consisted of the deletion of 3 bp of the ARE consensus sequence (Fig. 3A), led to a small increase (not significant) in promoter activity in H460 cells and a modest decrease in A549 (p < 0.05 compared with WT promoter) and HEK cells (Fig. 3C), suggesting that Nrf2 do not play a major role in the basal expression of MTOR. Mutation of the ARE sequence also abolished the changes observed after Nrf2 modulation (Fig. 3B). In other words, both the increase observed in A549 and HEK cells after Nrf2 induction (Fig. 3B) and the increase observed in H460 after Nrf2 knockdown (Fig. 3B) were abolished, confirming that the observed regulation of MTOR expression by Nrf2 acts through an Nrf2-ARE interaction. As a control for Nrf2 activity, we used pGL3-NQO1 vector, a promoter known to be targeted by Nrf2. As expected, the activity of the NQO1 promoter decreased in the three cell lines after Nrf2 knockdown (Fig. 3B). On the other hand, overexpression of Nrf2 led to an increased NQO1 promoter activity (Fig. 3B). Mutation of 3 bp of NQO1 ARE, which consisted of deletion of 3 bp of the consensus sequence, dramatically decreased NQO1 promoter activity (Fig. 3C). On the other hand, mutation of the ARE completely abolished all the changes in the activity of NQO1 promoter that followed Nrf2 modulation. Thus, an increase of Nrf2 as well as the decrease of Nrf2 had no significant effect on mutant NQO1 promoter activity (Fig. 3B).
In Vitro Binding of Nrf2 to MTOR ARE Region
To determine if Nrf2 acts directly by binding to the ARE sequence of MTOR, we performed pulldown assays using a 30-bp biotin-labeled DNA probe (Table 1) corresponding to the MTOR promoter region that contains the ARE sequence (WT MTOR probe). As a control, we used a mutated biotin-labeled probe having the same sequence as the previous one but with a scrambled sequence of the ARE region (Table 1). A negative control (no probe) was also included in the pulldown assay. Results suggest that Nrf2 binds to the ARE present in the MTOR promoter region, as Nrf2 protein amount pulled down with the WT MTOR probe was 2-fold higher than the amount pulled down with the mutant MTOR probe (Fig. 4A). As a positive control for Nrf2 binding, pulldown assays were also performed with a biotinylated probe corresponding to NQO1 ARE region (WT NQO1 probe) and its scrambled version (mutant NQO1 probe) (Table 1). Nrf2 binding to the ARE sequence of WT NQO1, was stronger than Nrf2 binding to scrambled NQO1 AREs. Results using these MTOR and NQO1 probes suggest that binding of Nrf2 to the MTOR probe is weaker than the binding of Nrf2 to NQO1 probe, as demonstrated by the intensity of the Nrf2 bands in both conditions (Fig. 4A), but that it does occur.
TABLE 1.
Sequence of primers and probes used in this study

FIGURE 4.

Nrf2 was capable of binding to the ARE region of the mTOR promoter. A, using a pulldown assay, Nrf2 binding to the sequence corresponding to the ARE sequence in mTOR promoter and to its mutated form. Nrf2 binding to mTOR probe significantly decreased when ARE was mutated compared with WT probe. As a positive control, we observed strong binding of Nrf2 to probe corresponding to ARE in NQO1 promoter, and mutation of this ARE strongly decreased Nrf2 binding. B, using EMSA assay and the same probes as in pulldown assay, results show that Nrf2 bound to mTOR probe and that mutation of ARE sequence in the mTOR probe significantly decreased Nrf2 binding (arrow). As a positive control, Nrf2 bound to NQO1 probe containing ARE located in the NQO1 promoter, and mutation of the ARE strongly decreased Nrf2 binding (arrow).
The binding of Nrf2 to ARE in the MTOR (and NQO1) promoter was further confirmed in vitro using an electrophoretic mobility shift assay (EMSA), which was performed using probes having the same sequence as for DNA pulldown assay. Probes were radiolabeled and incubated with the nuclear extract from A549 cells. Results show that Nrf2 binds to WT MTOR and WT NQO1 promoters and that Nrf2 binding to MTOR promoter is weaker compared with Nrf2 binding to NQO1 promoter (Fig. 4B). Mutation of the MTOR probe strongly decreased binding of Nrf2, further confirming that Nrf2 can directly bind to the ARE of MTOR promoter (Fig. 4B). As expected, introducing a mutation in the ARE sequence of NQO1 almost abolished Nrf2 binding to NQO1 ARE sequence (Fig. 4B). However, supershift using Nrf2 antibody was not conclusive, as it did not reveal any band either with NQO1 or MTOR probes. Therefore, more conclusive evidence was sought using chromatin immunoprecipitation (ChIP) assays.
PI3K Pathway Activation May Interfere with MTOR Regulation by Nrf2
Our findings from mRNA and protein expression as well as MTOR promoter activity suggest that whereas Nrf2 modulation may regulate mTOR expression and/or activity, this may be affected by the physiologic state of the PI3K pathway. To explore this further, we measured MTOR mRNA and protein expression in other human cancer cell lines having different PI3K pathway status. In addition to the three cell lines used in this study (A549, H460, and HEK), we used seven additional cell lines, five of which have an activated PI3K pathway (MCF7, T47D, and BT20 (PI3KCA activating mutation), MDA468 (inactivating mutation of PTEN, which is an inhibitor of mTOR), MDA231 (BRAF and PDGFRA activating mutations)) and two bearing physiologic the PI3K pathway (H322 and H358). Western blots using total protein confirmed the activation status of PI3K/mTOR in these cells, as levels of p-4EBP1 and/or phospho-S6K, which are markers of PI3K pathway activation, were stronger in T47D, BT20, MDA468, MDA231, MCF7, and H460 cells. In contrast, levels of p-S6K or p-4EBP1 were relatively low in A549, HEK, H358, and H322 (Fig. 5). Interestingly, if we include H460, A549, and HEK cells, none of the cells with activated PI3K pathway had increased mTOR expression after Nrf2 induction. In contrast, in cells with physiologic PI3K pathway, mTOR expression was increased in three of four cell lines, including A549 and HEK (Fig. 1) as well as H358 (Fig. 6) but not in H322 cells. These findings strongly suggest that Nrf2 modulation have a different effect on mTOR depending on whether the PI3K pathway is activated or not. This provides the opportunity to interrogate the possible mechanisms of the differential effects of Nrf2 and whether Nrf2 acts directly or indirectly on MTOR promoter to achieve its effects.
FIGURE 5.
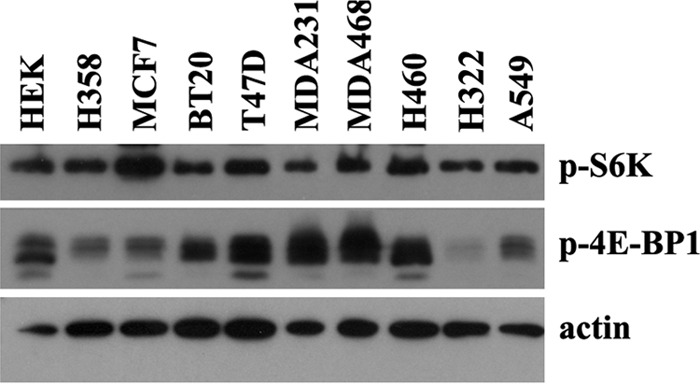
PI3K pathway activation status in different cell lines. Protein levels of phospho-S6K and phospho-4EBP1, which are markers of PI3K pathway activation, were measured in 10 different cell lines. p-S6K and/or p-4EBP1 levels were stronger in MCF7, MDA231, BT20, T47D, MDA468, and H460cells, all expected to have activated PI3K pathway by virtue of different mutations, whereas expression of the two phosphoproteins was lower in HEK, A549, H358, and H322 cells, which have no reported mutations activating PI3K pathway.
FIGURE 6.

Activation of PI3K pathway seemed to interfere with the mTOR regulation by Nrf2. A, except for T47D, Nrf2 overexpression did not regulate mTOR protein levels in cell lines that bear the dysregulated PI3K pathway, i.e. MCF7, BT20, BT20, and MDA468. In T47D, Nrf2 increase lead to a decrease in mTOR activity as p-S6K and p-4EBP1 were decreased, and the decrease was not related to a change in MTOR transcription or protein levels. On the other hand, Nrf2 overexpression increased mTOR protein expression in H358 cells but not in H322; both cell lines were believed to have a physiological PI3K pathway. Increased mTOR expression translated into up-regulated mTOR activity levels of p-4EBP1 and p-S6K. B, analysis of mRNA levels confirmed that mTOR expression was regulated by Nrf2 overexpression in H358 cells, whereas no significant change was observed in the six remaining cell lines. Values represent a ratio relative to GAPDH mRNA levels and expressed as percentage of pcDNA-transfected controls for each cell line. mRNA data are expressed as the mean ± S.D. n = 3. **, p < 0.01, versus pCDNA transfected cells. The Western blot figure is representative of at least three different experiments.
Nrf2 Binds to MTOR Promoter in Vivo under Inducible Conditions
To confirm that Nrf2 binds in vivo to the ARE sequence in the MTOR promoter and in an attempt to explore the mechanisms behind the differential mTOR regulation by Nrf2, we performed ChIP assays coupled to detection by quantitative real-time PCR using primers described in (Table 1). Three cell lines having the activated PI3K pathway (H460, MDA468, and T47D) and two cell lines having the physiologic PI3K pathway (A549 and H358) were used in the ChIP assays. Chromatin extracts from these cells were immunoprecipitated with antibodies against Nrf2, RelA/p65, and with antibodies against histone modification markers: H3-K4me3 (histone 3 trimethylated at residue lysine 4) and H3-K27me3 (histone 3 trimethylated at residue lysine 27), which are associated with gene activation and gene repression, respectively. Anti-IgG antibody was used as negative control (mock). ChIP signals were divided by the IgG signals (considered as background), representing the ChIP signal as the -fold increase in signal relative to the background signal. Results show that Nrf2 binds the MTOR promoter in all five cell lines except T47D (Fig. 7), as -fold increase in Nrf2 binding to MTOR promoter was significantly higher than the background in A549 (3.52×), H460 (6.73×), MDA468 (1.98×), and H358 (1.78×). In T47D cells, the Nrf2 signal was comparable to the background. After Nrf2 induction, its binding to MTOR promoter increased in all cell lines (+108% in A549, +28% in H460, +42% in MDA468, and +84% in H358). In T47D, the increase in Nrf2 binding (+26%) was not significant compared with the pcDNA-transfected cells. Interestingly, in H460 and MDA468 cells (both having abnormally active PI3K pathway), the increase in Nrf2 binding was associated with an increase in p65 binding (+33% in H460; + 93%in MDA468) and with an increase in gene repression marker H3-K27me3 signal (+420% in H460, +33% in MDA468), concomitant with a decrease in gene activation marker H3-K4me3 signal (−30% in MDA468 and −78% in H460 cells) (Fig. 7). In the two cell lines bearing the physiologic PI3K pathway, we found the exact inverse. The signal for H3-K27me3 was decreased in both A549 and H358 (−34% and −62%, respectively), whereas the signal for H3-K4me3 was increased (+43%) in both cell lines. Furthermore, p65 binding was slightly decreased in both A549 and H358 cells (−14% and −15% respectively), but the decrease was not significant. ChIP results clearly show that Nrf2 binding to MTOR promoter has different effects on p65, H3-K27me3, and H3-K4me3 whether the PI3K pathway is activated or not, and this may explain, at least partly, the different regulation of MTOR after Nrf2 induction. As a control for Nrf2 activity, we also measured the binding of Nrf2 and p65 as well as measurements of H3-K27me3 and H3-K4me3 signals in the NQO1 promoter. Nrf2 induction led to an increase of Nrf2 binding in all cell lines. The effect of Nrf2 induction on the NQO1 promoter was almost the same as for the MTOR promoter, except for H3-K4me3 signal. Indeed, p65 binding to the NQO1 promoter as well as H3-k27me3 signal were increased in cells bearing the active PI3K pathway, whereas they were significantly decreased in cells with the physiologic PI3K pathway. In the other hand, H3-K4me3 was increased in all five cell lines studied regardless of the PI3K pathway activation status. In summary, the ChIP result suggests that, after Nrf2 induction, increase the of mTOR expression in cells having the physiologic PI3K pathway is associated with an increase in H3-K4me3 signal and a decrease of H3-K27me3 signal, whereas p65 does not seem to play a role as its binding to MTOR promoter did not change compared in Nrf2-transfected cells. In cells bearing the abnormally activated PI3K pathway, the non-response of mTOR to increased Nrf2 binding to the MTOR promoter was associated with an increased binding of p65 and increased H3-K27me3 signal, parallel to a decrease in H3-K4me3 signal.
FIGURE 7.

PI3K pathway activation status differentially affected changes in histone modifications as well as p65 binding to MTOR promoter. A, Nrf2 overexpression led to its increased binding to MTOR promoter. This led to different results depending on the activation state of PI3K pathway. In A549 and H358, which have physiologic PI3K pathway, increased Nrf2 binding led to increased H3-K4me3 signal parallel to a small decrease in H3-K27me3 and in p65 binding. In H460 and MDA468, both hosting abnormally activated PI3K pathway, increased Nrf2 binding resulted in higher p65 binding and higher H3-K27me3 signal, concomitant with a decrease in H3-K4me3 levels. In T47D cells, Nrf2 induction did not result in significant increase in Nrf2 binding, and no significant change was observed in H3-K27me3 and H3-K4me3 signals as well as p65 binding. B, Nrf2 overexpression led to its increased binding to NQO1 promoter. This led to decreased H3-K27me3 signal and p65 binding, whereas no significant change was observed in H3-K4me3 mark in A549 and H358 cells. In H460, MDA468, and T47D, H3-K27me3 mark and p65 binding were increased, whereas H3-K4me3 was significantly increased in H460 and MDA468 cells. -Fold increase data are expressed as the mean ± S.D. of three different experiments. *, p < 0.05; **, p < 0.01; ***, p < 0.001 compared with pcDNA-transfected controls.
Discussion
To our knowledge this is the first report showing that Nrf2 can act upstream of the PI3K pathway and transcriptionally regulates one of its major components, i.e. mTOR. We also provided evidence for a direct binding of Nrf2 on the MTOR promoter by in vitro and in vivo assays. Previous studies have already shown an indirect regulation of mTOR by Nrf2, with intermediary proteins acting post-translationally on mTOR. Nrf2 was shown to indirectly up-regulate mTOR activity by increasing the expression of RagD, a protein known as an activator of mTOR (16). In another study involving 90 cases of surgically treated lung squamous cell cancer patients, among which 14 cases were positive for a NRF2 gene mutation, expression of RagD was 3 times higher in the group of tumors having mutated Nrf2 compared with the ones with WT Nrf2, indicating a correlation between Nrf2 mutation and RagD expression and, thus, to mTOR activity (26). Nrf2 was also shown to regulate melanogenesis in normal human dermal melanocytes by directly modulating activity of components of the PI3K pathway, including AKT and mTOR (25). In the latter case, mTOR activity was found to be increased in cells with overexpressed Nrf2, but the precise mechanism and site of this action was not examined. Nonetheless, this represents another report showing that, in completely different cell lines from those used in our study, increased levels of Nrf2 results in mTOR activation (25).
In the present study, we showed that a similar initiating event, i.e. overexpression of Nrf2, leads to different outcomes depending on whether the PI3K pathway is activated by virtue of mutations or not. Increased cellular Nrf2 results in epigenetic transcriptional activation of mTOR in three of four cell lines bearing the physiologic PI3K pathway, whereas in all cell lines having the activated PI3K pathway by virtue of various mutations, Nrf2 induction had no effect on mTOR expression. Results from the ChIP assays first showed that Nrf2 is able to bind MTOR promoter in vivo and that induction of Nrf2 increased its binding to the MTOR promoter in all the cell lines studied. Due to the presence of a consensus sequence for p65 binding very close to the ARE sequence of the MTOR promoter (8 bp downstream of ARE sequence), we explored the possibility of p65 binding to the MTOR promoter near the ARE region. Although the anti-inflammatory role of p65 is well established, it is also known to interface with Nrf2 at several points to control the transcription or function of their downstream targets, sometimes synergizing and sometimes antagonizing their effects. For instance, deletion of Keap1, which results in Nrf2 activation, has also been shown to lead to the accumulation and stabilization of IKKβ and the consequent up-regulation of NF-κB (p65)-derived tumor angiogenic factors (27). p65, together with p50, is also able to induce transcription of Nrf2 in AML cells, thus encouraging resistance to chemotherapy-induced cytotoxicity (28). Synergy was also shown between NF-κB (p65) and Nrf2 in regulating antioxidative response in renal cells (29). On the other hand, Nrf2 and p65 can be functionally antagonistic. The absence of Nrf2 induces more aggressive inflammation through activation of p65 and downstream proinflammatory cytokines in astrocytes (30). Furthermore, activation of Nrf2-mediated antioxidative signaling attenuates NF-κB-mediated inflammatory response in a colitis-associated colorectal cancer model (31), and Nrf2−/− mice showed increased pulmonary NF-κB activity and inflammatory response after traumatic brain injury (32). p65 was also shown to physically bind to Keap1 in vitro and in vivo, leading to inhibition of Nrf2 pathway (33). Interestingly, in cells where p65 and Nrf2 were simultaneously activated, p65 unidirectionally antagonized the transcriptional activity of Nrf2 in a way that was independent of its own transcriptional activity (34). Rather, this was achieved by p65 binding to DNA and competing for the transcriptional co-activator CBP (cAMP-response element-binding protein (CREB)-binding protein)-p300 complex (34), leading to inhibition of Nrf2-regulated genes. In addition to p65, we also measured changes in markers of histone modification because aside from influencing local chromatin structure these modifications are also recognized by specific adaptor proteins that in turn recruit protein complexes and thereby affect gene regulation. Some of these histone marks such as trimethylation of residue lysine 4 of histone 3 (H3K4me3) are strongly associated with actively transcribed genes (35–38), whereas other modifications, including trimethylated lysine 27 of histone 3 (H3K27me3) are enriched within repressed regions (39, 40).
In the present study a deeper look at ChIP assay data in NQO1 and MTOR promoters provides a more complete picture of the possible mechanisms governing the regulation of these genes by Nrf2 and p65. In both promoters and only in cells bearing abnormally active PI3K pathway, Nrf2 induction led to an increase in p65 binding and in levels of H3-K27me3 mark, whereas Nrf2 overexpression decreased levels of H3-K27me3 signal and p65 binding (although not significantly in some cases) in cells with the physiologic PI3K pathway. On the other hand, the regulation of H3-K4me3 in both promoters is very interesting, as Nrf2 overexpression led to an increase of H3-K4me3 in NQO1 promoter in all cell lines, as opposed to the MTOR promoter where the increase was restricted to cells with the physiologic PI3K pathway. These results first show a strong correlation between p65 binding and markers of gene repression, consistent with a possible role for p65 as a negative regulator in both Nrf2-regulated promoters. The results also suggest that Nrf2 and p65 probably compete to regulate NQO1 and MTOR promoters. The only difference lies in the high abundance of Nrf2 proteins bound to NQO1 promoter as well as the strong levels of H3-K4me3, the combination of which likely renders an increase in p65 binding to the NQO1 promoter in PI3K-activated cells inadequate to compete for NQO1 promoter activity. These mechanisms of mTOR promoter regulation suggested by our results do not explain, however, how PI3K activation selectively regulates p65 binding to MTOR promoter after Nrf2 induction. It was shown for example that EGFR activates NF-κB (p65) through the PI3K/Akt pathway by promoting the nuclear translocation of p65 (41). Also, in PI3K-activated prostate cells, MTOR was shown to control p65 activity by increasing its translocation to the nucleus to induce its target genes (42). On the other hand, oncogenic H-Ras was shown to require PI3K and Akt to stimulate the transcriptional activity of p65 by stimulating the transactivation domain 1 of the p65 subunit rather than inducing p65 nuclear translocation (43). Several other studies confirm the role of activated PI3K pathway in the activity of p65 (44–47). Thus, the activated PI3K pathway leading to increased translocation of p65 to the nucleus or to posttranslational-activating modification of p65 are two possible mechanisms that may explain the selective regulation of MTOR promoter by Nrf2 in PI3K-activated cells.
In summary, our study definitely shows that Nrf2 can bind to the mTOR promoter and that Nrf2 induction can regulate the MTOR promoter. This is exclusive of cells bearing a mutationally active PI3K pathway where Nrf2-induced MTOR regulation is inhibited by increased p65 binding to the MTOR promoter and changes in histone modification markers favoring inhibition of promoter activity. To our knowledge this study is the first to show Nrf2 binding affects, either directly or indirectly, the methylation of lysine residues of histone 3 as a mechanism to regulate the expression of its target genes. It is also the first to suggest that the PI3K pathway can interfere with Nrf2 activity, especially in promoters where Nrf2 binding is not strong. Finally, it is the first report to show that p65 binds to MTOR promoter and plays a role in the MTOR regulation by Nrf2.
There is a very active area of research that seeks to modify Nrf2 levels both to prevent carcinogenesis and to sensitize tumors to anti-cancer therapies (48, 49). There is also and active clinical investigation of combinations of mTOR-modulating drugs with other therapeutic agents (50, 51). Our data suggest there may be an important opportunity to integrate these approaches, and this will necessarily include the PI3K pathway molecular profiling to identify patients whose tumors do not have a dysregulation of the pathway, which may render them insensitive to Nrf2 modulation. On the other hand, the high prevalence of PI3K pathway dysregulation in cancer cells could offer the opportunity to selectively modulate this pathway via Nrf2 in non-tumor cells, an approach that deserves exploration.
Experimental Procedures
Tissue Culture, Plasmids, and siRNAs
Different cell lines with activating mutations in the PI3K pathway (H460, MCF7, MDA468, BT20, T47D, and MDA231) and cell lines without any reported PI3K pathway mutations (A549, HEK293T, H358, H322) were cultured in RPMI media supplemented with 10% fetal bovine serum and 1% PenStrep (100 units/ml penicillin and 100 μg/ml streptomycin) and grown in 5% CO2 at 37 °C. For Nrf2 down-regulation, we used a Nrf2 stealth RNAi siRNA (#HSS181505) as well as Stealth RNAi™ siRNA Negative Control Hi GC Duplex #2 (Invitrogen). For Nrf2 overexpression, a Nrf2 cDNAs plasmid (NC16 pCDNA3.1-FLAG-NRF2), a gift from Randall Moon (Addgene plasmid # 36971), and a control pcDNA3.1 plasmid were used in our experiments.
Transfection Conditions
Cell lines were seeded to be ∼80% confluence on the day of transfection. Lipofectamine RNAiMax was used for siRNA transfections, whereas Lipofectamine LTX was used for cDNA transfections, as per the manufacturer's protocol (Invitrogen). In all cases the transfection mix was added to the cells for 6 h, then removed and replaced by the medium overnight. Cells were collected for total protein and total RNA extractions or processed for luciferase assay analysis.
Western Blot
Protein expression analysis was performed by Western blot. Cells were disrupted with lysis buffer (20 mm Tris, pH 7.5, 420 mm NaCl, 2 mm MgCl2, 1 mm EDTA, 10% glycerol, 0.5% Nonidet P-40, 0.5% Triton, 1 mm PMSF, 1 mm DTT, 2 mm NaF) for 30 min on ice followed by a 20-min spin at 13,000 rpm to pellet debris. The supernatant was then removed and quantified using the Bradford protein assay, and 40 μg of cell protein/lysate per sample was loaded and run through a 10% SDS-PAGE gel followed by electrophoretic transfer for 2 h onto a Bio-Rad nitrocellulose membrane (Bio-Rad). Blots were probed overnight at 4 °C with the following antibodies: rabbit anti-Nrf2 (catalog #2178-1, lot #YJ11151C, Epitomics, Burlingame, CA), rabbit anti-mTOR (catalog #2983, lot #14, New England Biolabs, Ipswich, MA), rabbit anti-phosphoS6K (catalog #9208, lot #3, New England BioLabs), and mouse anti-β-actin (catalog #A5316, lot#051M4892, Sigma), then incubated with specific secondary antibodies for 1 h at room temperature. The results were documented on X-ray film with ECL detection and autophotography.
RNA Extraction and Quantitative RT-PCR
Total RNA was isolated using EZ-10 DNAaway RNA Mini-Preps Kit (Bio Basic Canada INC, Markham, Canada) according to the manufacturer's protocol. 1 μg of total RNA from each sample was used to synthesize cDNAs using SuperScript® II Reverse Transcriptase (Invitrogen). cDNAs were used as a template for quantitative real-time PCR detection using the SensiFAST SYBR® and fluorescein kit (FroggabioBio Scientific solutions, Toronto, ON, Canada). The sequence of primers used to amplify NRF2, MTOR, NQO1, and GAPDH genes are described in Table 1. The amplification reactions were carried out with the Applied Biosystems 7500 Fast Real-time PCR System (Applied Biosystems, Waltham, MA). The comparative ΔΔCt method was used for relative quantification of the amount of mRNA in each sample normalized to GAPDH transcript levels.
Luciferase Assay Constructs
The core ARE sequence (TGACXXXGC) in both DNA strands was used to screen up to 1 kb upstream from the start of transcription site of MTOR. Bioinformatics algorithms, including InSilicase and Scope were used to identify potentially active ARE sequences in MTOR promoter. A putative ARE site was localized in MTOR promoter at 723 bp upstream of the transcription starting site (TSS), whereas for NQO1, a ARE site located at 185 upstream of TSS was already reported to be responsive to Nrf2 (52). Fosmid clones containing MTOR and NQO1 promoters (clone WI2–2664E12 and clone WI2–637O21, respectively) were purchased from BAC/PAC resources center (Children's Hospital, Oakland, CA) and used as the template to amplify the promoter region of MTOR and NQO1. A region of MTOR promoter reaching 1104 bp upstream of TSS and a region of NQO1 promoter (603 bp upstream of TSS) were amplified and cloned in pGL3-basic vector (Promega, Madison, WI), which lacks eukaryotic promoter and enhancer sequences, allowing maximum flexibility in cloning putative regulatory sequences. Inserts were cloned through SacI and MluI restriction sites to produce MTOR-pGL3 and NQO1-pGL3 plasmids, respectively (Fig. 3). For site-directed mutagenesis, the TGA portion of the AREs was deleted using the QuikChange II XL site-directed mutagenesis kit (Agilent Technologies, Santa Clara, CA), and the presence of mutation was ascertained by sequencing of ARE region. Primers used in promoter cloning and mutagenesis are described in Table 1. A potential binding motif sequence for p65 is also present 8 bp downstream of the ARE site (GAAATTCC; see complete sequence including ARE in Table 1).
Luciferase Assay
FLAG-Nrf2 or siNrf2 and their respective controls were co-transfected with pGL3 or vectors containing MTOR or NQO1 promoters. Renilla luciferase plasmid (pRL) was included in all transfections. 24 h after transfection the cells were lysed with passive lysis buffer (Promega), and luciferase activities were analyzed in 10 μl of cell extracts with the dual luciferase assay kit (Promega). The relative luciferase activity, expressed as a ratio of reporter activity (firefly luciferase) to that of control plasmid (Renilla luciferase), was obtained in triplicates for each sample using the Glomax® 20/20 Luminometer (Promega). The results shown are from a representative experiment performed at least three times.
EMSA
30 base primers containing the wild-type and mutants ARE sequences for NQO1 and MTOR as well as their reverse-complement sequences were generated at IDT (Integrated DNA Technologies, San Jose, CA) (see sequence in Table 1). Primers (sense and antisense) were annealed by heating at 95 °C for 10 min, then decreasing temperature by 5 °C each for 2 min until reaching 4 °C. Double-strand probes were then labeled with the radioactive isotope [γ-32P]ATP at 30 °C for 30 min followed by 10 min of incubation at 65 °C. Radiolabeled probes were incubated at room temperature for 30 min with nuclear extracts from A549 cells, which were transfected with siNrf2 or scrambled siRNAs. The incubation was performed in buffer containing 20 mm HEPES-KOH, pH 7.9, 60 mm KCL, 1 mm MgCL2, 1 mm EDTA, 1 μg of poly(dI-dC) dithiothreitol, 10% glycerol, 0.2 mm ZnSO4, and 10,000 cpm [γ-32P]ATP-labeled probe. Protein-DNA complexes were resolved through a 4% polyacrylamide gel. The gel was then dried and subjected to autoradiography with an intensifying screen at −80 °C.
DNA Pulldown Assay
Biotinylated primers containing the wild-type and mutants ARE sequences for NQO1 and MTOR as well as their reverse-complement sequence were used in pulldown assays (sequences in Table 1). The annealing reaction of the primers was performed as described for the EMSA experiment. For DNA-protein binding reactions, 200 μg of A549 nuclear protein extraction was incubated overnight at 4 °C on a shaker with 10 μg of biotinylated probes in 1 ml of binding buffer (20 mm Tris, pH 8.0, 10% glycerol, 6.25 mm MgCl2, 5 mm dithiothreitol, 0.1 mm EDTA, 0.01% Nonidet P-40, and 200 mm NaCl). After 1 h of incubation with 50 μl of the Dynabeads® MyOne™ Streptavidin C1 magnetic beads (ThermoFisher Scientific, Waltham, MA), immobilized templates were washed 3 times with 0.5 ml of binding buffer, dried, and resuspended on SDS/loading dye. The samples were then boiled, and bound proteins were resolved on a 10% SDS-PAGE, transferred onto nitrocellulose membrane, and immunoblotted with anti-Nrf2 antibody (Abcam, Cambridge, MA).
ChIP
Cells were grown until 80% confluence in 15-cm plates and transfected with 15 μg of FLAG-Nrf2 (or pCDNA) vector in the case of Nrf2 overexpression and with 200 nm of siNrf2 (or scrambled siRNA) for Nrf2 down-regulation. 24 h after transfection, medium was discarded, and cells were cross-linked in 1% formaldehyde for 10 min at room temperature. The reaction was ended by adding glycine at a final concentration of 125 mm for 5 min. Cells were collected with 5 ml of PBS and centrifuged for 20 min at 5000 rpm, and pellets were resuspended in 1 ml of lysis buffer (0.5% Nonidet P-40, 0.5% Triton X-100, 0.5% deoxycholate, 0.1% SDS, 50 mm Tris, pH 8, 50 mm NaCl, and 5 mm EDTA. Protease inhibitors, PMSF, and NaF were added directly before lysis. To obtain DNA fragments having sizes from 200 to 1000 bp, lysates were subjected to 15 rounds of sonication. Each round consisted of 10 seconds sonication at 23% amplitude, followed by 1 minute rest. Lysates were centrifuged for 30 min at 14,000 rpm, and the supernatants were transferred to a new Eppendorf tube and then quantified. One percent of the lysate was used to verify the amount of DNA for each immunoprecipitation. For each reaction, 400 μg of chromatin and 20 μl of ChIP-Grade Protein G Magnetic Beads (New England BioLabs, catalog #9006S) was used for immunoprecipitation with antibodies against Nrf2 (H300: rabbit Nrf2 antibody, Santa Cruz Biotechnology, Dallas, TX), H3-K27me3 (New England BioLabs; catalog #9733, lot #8), H3-K4-me3 (New England BioLabs, catalog #9751P, lot 9), and p65 (New England BioLabs; catalog #8242P). Normal rabbit IgG antibody (New England BioLabs; catalog #2729S, lot #7) was used as a negative control. Samples were immunoprecipitated overnight at 4 °C, and the beads were washed 5 times for 5 min with 1 ml of ice-cold immunoprecipitation buffer. After the final wash, immunoprecipitation buffer was removed, and 100 μl 10% (w/v) Chelex slurry was added directly to the washed beads as described in Nelson et al. (53). Sampled were vortexed to mix the slurry and boiled for 10 min, then centrifuged for 2 min at room temperature, and the supernatant containing the DNA was transferred to new Eppendorf tubes. Samples were treated with proteinase K for 1 h at 55 °C, then for 5 min of incubation at 100 °C to neutralize the enzyme. 2 μl of each sample was used to amplify the ARE promoter regions of MTOR and NQO1 using primers described in Table 1. We used the “Fold Enrichment Method,” which calculates signal over background to normalize ChIP-quantitative PCR data. With this method, ChIP signals are divided by the IgG signals (considered as background) representing the ChIP signal as the -fold increase in signal relative to the background signal.
Statistical Analysis
Where indicated, experiments were performed at least three times, and data are expressed as the means ± S.D. Controls and experiments were compared using the two-tailed unpaired t test. Statistical significance was deemed as: p < 0.05; p < 0.01; p, < 0.001.
Author Contributions
G. Bendavit performed mRNA and protein expression for Figs. 1 and 2 as well as the luciferase assay experiments. T. A. performed Western blots and quantitative PCR for Figs. 5 and 6 and repeated all the ChIP experiments. K. H. performed the EMSA assay and helped G. Bendavit to perform pulldown assays. S. S. performed the initial ChIP experiments. G. Batist coordinated the study. G. Batist and A. T. wrote the paper.
Acknowledgment
We appreciate the support of Dr. Witcher's laboratory at the Lady Davis Institute for technical advice regarding EMSA and pulldown assays.
This work was supported by Canadian Institutes for Health Research (CIHR) Grant MOP-126073. The authors declare that they have no conflicts of interest with the contents of this article.
- ARE
- anti-oxidant response element
- TSS
- transcription starting site.
References
- 1. Taguchi K., Motohashi H., and Yamamoto M. (2011) Molecular mechanisms of the Keap1-Nrf2 pathway in stress response and cancer evolution. Genes Cells 16, 123–140 [DOI] [PubMed] [Google Scholar]
- 2. Cho H. Y., and Kleeberger S. R. (2010) Nrf2 protects against airway disorders. Toxicol. Appl. Pharmacol. 244, 43–56 [DOI] [PubMed] [Google Scholar]
- 3. Maher J., and Yamamoto M. (2010) The rise of antioxidant signaling–the evolution and hormetic actions of Nrf2. Toxicol. Appl. Pharmacol. 244, 4–15 [DOI] [PubMed] [Google Scholar]
- 4. Kang M. I., Kobayashi A., Wakabayashi N., Kim S. G., and Yamamoto M. (2004) Scaffolding of Keap1 to the actin cytoskeleton controls the function of Nrf2 as key regulator of cytoprotective phase 2 genes. Proc. Natl. Acad. Sci. U.S.A. 101, 2046–2051 [DOI] [PMC free article] [PubMed] [Google Scholar]
- 5. Ha K. N., Chen Y., Cai J., and Sternberg P. Jr. (2006) Increased glutathione synthesis through an ARE-Nrf2-dependent pathway by zinc in the RPE: implication for protection against oxidative stress. Invest. Ophthalmol. Vis. Sci. 47, 2709–2715 [DOI] [PubMed] [Google Scholar]
- 6. Shen G., and Kong A. N. (2009) Nrf2 plays an important role in coordinated regulation of Phase II drug metabolism enzymes and Phase III drug transporters. Biopharm. Drug Dispos. 30, 345–355 [DOI] [PMC free article] [PubMed] [Google Scholar]
- 7. Tong K. I., Padmanabhan B., Kobayashi A., Shang C., Hirotsu Y., Yokoyama S., and Yamamoto M. (2007) Different electrostatic potentials define ETGE and DLG motifs as hinge and latch in oxidative stress response. Mol. Cell Biol. 27, 7511–7521 [DOI] [PMC free article] [PubMed] [Google Scholar]
- 8. Rushmore T. H., and Pickett C. B. (1990) Transcriptional regulation of the rat glutathione S-transferase Ya subunit gene. Characterization of a xenobiotic-responsive element controlling inducible expression by phenolic antioxidants. J. Biol. Chem. 265, 14648–14653 [PubMed] [Google Scholar]
- 9. Chorley B. N., Campbell M. R., Wang X., Karaca M., Sambandan D., Bangura F., Xue P., Pi J., Kleeberger S. R., and Bell D. A. (2012) Identification of novel NRF2-regulated genes by ChIP-Seq: influence on retinoid X receptor α. Nucleic Acids Res. 40, 7416–7429 [DOI] [PMC free article] [PubMed] [Google Scholar]
- 10. Malhotra D., Portales-Casamar E., Singh A., Srivastava S., Arenillas D., Happel C., Shyr C., Wakabayashi N., Kensler T. W., Wasserman W. W., and Biswal S. (2010) Global mapping of binding sites for Nrf2 identifies novel targets in cell survival response through ChIP-Seq profiling and network analysis. Nucleic Acids Res. 38, 5718–5734 [DOI] [PMC free article] [PubMed] [Google Scholar]
- 11. Hennessy B. T., Smith D. L., Ram P. T., Lu Y., and Mills G. B. (2005) Exploiting the PI3K/AKT pathway for cancer drug discovery. Nat. Rev. Drug Discov. 4, 988–1004 [DOI] [PubMed] [Google Scholar]
- 12. Hay N., and Sonenberg N. (2004) Upstream and downstream of mTOR. Genes Dev. 18, 1926–1945 [DOI] [PubMed] [Google Scholar]
- 13. Ma X. M., and Blenis J. (2009) Molecular mechanisms of mTOR-mediated translational control. Nat. Rev. Mol. Cell Biol. 10, 307–318 [DOI] [PubMed] [Google Scholar]
- 14. Sarbassov D. D., Ali S. M., and Sabatini D. M. (2005) Growing roles for the mTOR pathway. Curr. Opin. Cell Biol. 17, 596–603 [DOI] [PubMed] [Google Scholar]
- 15. Watanabe R., Wei L., and Huang J. (2011) mTOR signaling, function, novel inhibitors, and therapeutic targets. J. Nucl. Med. 52, 497–500 [DOI] [PubMed] [Google Scholar]
- 16. Sancak Y., Peterson T. R., Shaul Y. D., Lindquist R. A., Thoreen C. C., Bar-Peled L., and Sabatini D. M. (2008) The Rag GTPases bind raptor and mediate amino acid signaling to mTORC1. Science 320, 1496–1501 [DOI] [PMC free article] [PubMed] [Google Scholar]
- 17. Zaytseva Y. Y., Valentino J. D., Gulhati P., and Evers B. M. (2012) mTOR inhibitors in cancer therapy. Cancer Lett. 319, 1–7 [DOI] [PubMed] [Google Scholar]
- 18. Chan J., and Kulke M. (2014) Targeting the mTOR signaling pathway in neuroendocrine tumors. Curr. Treat. Options Oncol. 15, 365–379 [DOI] [PMC free article] [PubMed] [Google Scholar]
- 19. Vicier C., Dieci M. V., Arnedos M., Delaloge S., Viens P., and Andre F. (2014) Clinical development of mTOR inhibitors in breast cancer. Breast Cancer Res. 16, 203. [DOI] [PMC free article] [PubMed] [Google Scholar]
- 20. Yamadori T., Ishii Y., Homma S., Morishima Y., Kurishima K., Itoh K., Yamamoto M., Minami Y., Noguchi M., and Hizawa N. (2012) Molecular mechanisms for the regulation of Nrf2-mediated cell proliferation in non-small-cell lung cancers. Oncogene 31, 4768–4777 [DOI] [PubMed] [Google Scholar]
- 21. Chuang J. I., Huang J. Y., Tsai S. J., Sun H. S., Yang S. H., Chuang P. C., Huang B. M., and Ching C. H. (2015) FGF9-induced changes in cellular redox status and HO-1 upregulation are FGFR-dependent and proceed through both ERK and AKT to induce CREB and Nrf2 activation. Free Radic. Biol. Med. 89, 274–286 [DOI] [PubMed] [Google Scholar]
- 22. Harada S., Nakagawa T., Yokoe S., Edogawa S., Takeuchi T., Inoue T., Higuchi K., and Asahi M. (2015) Autophagy Deficiency Diminishes Indomethacin-Induced Intestinal Epithelial Cell Damage through the Activation of ERK/Nrf2/HO-1 Pathway. J. Pharmacol. Exp. Ther. 355, 353–361 [DOI] [PubMed] [Google Scholar]
- 23. Verma A. K., Yadav A., Dewangan J., Singh S. V., Mishra M., Singh P. K., and Rath S. K. (2015) Isoniazid prevents Nrf2 translocation by inhibiting ERK1 phosphorylation and induces oxidative stress and apoptosis. Redox. Biol. 6, 80–92 [DOI] [PMC free article] [PubMed] [Google Scholar]
- 24. Shibata T., Saito S., Kokubu A., Suzuki T., Yamamoto M., and Hirohashi S. (2010) Global downstream pathway analysis reveals a dependence of oncogenic NF-E2-related factor 2 mutation on the mTOR growth signaling pathway. Cancer Res. 70, 9095–9105 [DOI] [PubMed] [Google Scholar]
- 25. Shin J. M., Kim M. Y., Sohn K. C., Jung S. Y., Lee H. E., Lim J. W., Kim S., Lee Y. H., Im M., Seo Y. J., Kim C. D., Lee J. H., Lee Y., and Yoon T. J. (2014) Nrf2 negatively regulates melanogenesis by modulating PI3K/Akt signaling. PLoS ONE 9, e96035. [DOI] [PMC free article] [PubMed] [Google Scholar]
- 26. Sasaki H., Shitara M., Yokota K., Hikosaka Y., Moriyama S., Yano M., and Fujii Y. (2012) RagD gene expression and NRF2 mutations in lung squamous cell carcinomas. Oncol. Lett. 4, 1167–1170 [DOI] [PMC free article] [PubMed] [Google Scholar]
- 27. Lee D. F., Kuo H. P., Liu M., Chou C. K., Xia W., Du Y., Shen J., Chen C. T., Huo L., Hsu M. C., Li C. W., Ding Q., Liao T. L., Lai C. C., Lin A. C., Chang Y. H., Tsai S. F., Li L. Y., and Hung M. C. (2009) KEAP1 E3 ligase-mediated downregulation of NF-κB signaling by targeting IKKβ. Mol. Cell 36, 131–140 [DOI] [PMC free article] [PubMed] [Google Scholar]
- 28. Rushworth S. A., Zaitseva L., Murray M. Y., Shah N. M., Bowles K. M., and MacEwan D. J. (2012) The high Nrf2 expression in human acute myeloid leukemia is driven by NF-κB and underlies its chemo-resistance. Blood 120, 5188–5198 [DOI] [PubMed] [Google Scholar]
- 29. George L. E., Lokhandwala M. F., and Asghar M. (2012) Novel role of NF-κB-p65 in antioxidant homeostasis in human kidney-2 cells. Am. J. Physiol. Renal Physiol. 302, F1440–F1446 [DOI] [PMC free article] [PubMed] [Google Scholar]
- 30. Pan H., Wang H., Wang X., Zhu L., and Mao L. (2012) The absence of Nrf2 enhances NF-κB-dependent inflammation following scratch injury in mouse primary cultured astrocytes. Mediators Inflamm. 2012, 217580. [DOI] [PMC free article] [PubMed] [Google Scholar]
- 31. Li W., Khor T. O., Xu C., Shen G., Jeong W. S., Yu S., and Kong A. N. (2008) Activation of Nrf2-antioxidant signaling attenuates NFκB-inflammatory response and elicits apoptosis. Biochem. Pharmacol. 76, 1485–1489 [DOI] [PMC free article] [PubMed] [Google Scholar]
- 32. Jin W., Zhu L., Guan Q., Chen G., Wang Q. F., Yin H. X., Hang C. H., Shi J. X., and Wang H. D. (2008) Influence of Nrf2 genotype on pulmonary NF-κB activity and inflammatory response after traumatic brain injury. Ann. Clin. Lab. Sci. 38, 221–227 [PubMed] [Google Scholar]
- 33. Yu M., Li H., Liu Q., Liu F., Tang L., Li C., Yuan Y., Zhan Y., Xu W., Li W., Chen H., Ge C., Wang J., and Yang X. (2011) Nuclear factor p65 interacts with Keap1 to repress the Nrf2-ARE pathway. Cell. Signal. 23, 883–892 [DOI] [PubMed] [Google Scholar]
- 34. Liu G. H., Qu J., and Shen X. (2008) NF-κB/p65 antagonizes Nrf2-ARE pathway by depriving CBP from Nrf2 and facilitating recruitment of HDAC3 to MafK. Biochim. Biophys. Acta. 1783, 713–727 [DOI] [PubMed] [Google Scholar]
- 35. Santos-Rosa H., Schneider R., Bannister A. J., Sherriff J., Bernstein B. E., Emre N. C., Schreiber S. L., Mellor J., and Kouzarides T. (2002) Active genes are tri-methylated at K4 of histone H3. Nature 419, 407–411 [DOI] [PubMed] [Google Scholar]
- 36. Schneider R., Bannister A. J., Myers F. A., Thorne A. W., Crane-Robinson C., and Kouzarides T. (2004) Histone H3 lysine 4 methylation patterns in higher eukaryotic genes. Nat. Cell Biol. 6, 73–77 [DOI] [PubMed] [Google Scholar]
- 37. Schübeler D., MacAlpine D. M., Scalzo D., Wirbelauer C., Kooperberg C., van Leeuwen F., Gottschling D. E., O'Neill L. P., Turner B. M., Delrow J., Bell S. P., and Groudine M. (2004) The histone modification pattern of active genes revealed through genome-wide chromatin analysis of a higher eukaryote. Genes Dev. 18, 1263–1271 [DOI] [PMC free article] [PubMed] [Google Scholar]
- 38. Pokholok D. K., Harbison C. T., Levine S., Cole M., Hannett N. M., Lee T. I., Bell G. W., Walker K., Rolfe P. A., Herbolsheimer E., Zeitlinger J., Lewitter F., Gifford D. K., and Young R. A. (2005) Genome-wide map of nucleosome acetylation and methylation in yeast. Cell 122, 517–527 [DOI] [PubMed] [Google Scholar]
- 39. Yoo K. H., and Hennighausen L. (2012) EZH2 methyltransferase and H3K27 methylation in breast cancer. Int. J. Biol. Sci. 8, 59–65 [DOI] [PMC free article] [PubMed] [Google Scholar]
- 40. Schwartz Y. B., and Pirrotta V. (2007) Polycomb silencing mechanisms and the management of genomic programmes. Nat. Rev. Genet. 8, 9–22 [DOI] [PubMed] [Google Scholar]
- 41. Le Page C., Koumakpayi I. H., Lessard L., Saad F., and Mes-Masson A. M. (2005) Independent role of phosphoinositol-3-kinase (PI3K) and casein kinase II (CK-2) in EGFR and Her-2-mediated constitutive NF-κB activation in prostate cancer cells. Prostate 65, 306–315 [DOI] [PubMed] [Google Scholar]
- 42. Dan H. C., Cooper M. J., Cogswell P. C., Duncan J. A., Ting J. P., and Baldwin A. S. (2008) Akt-dependent regulation of NF-{κ}B is controlled by mTOR and Raptor in association with IKK. Genes Dev. 22, 1490–1500 [DOI] [PMC free article] [PubMed] [Google Scholar]
- 43. Madrid L. V., Wang C. Y., Guttridge D. C., Schottelius A. J., Baldwin A. S. Jr, and Mayo M. W. (2000) Akt suppresses apoptosis by stimulating the transactivation potential of the RelA/p65 subunit of NF-κB. Mol. Cell Biol. 20, 1626–1638 [DOI] [PMC free article] [PubMed] [Google Scholar]
- 44. Jin R., Song Z., Yu S., Piazza A., Nanda A., Penninger J. M., Granger D. N., and Li G. (2011) Phosphatidylinositol-3-kinase gamma plays a central role in blood-brain barrier dysfunction in acute experimental stroke. Stroke 42, 2033–2044 [DOI] [PMC free article] [PubMed] [Google Scholar]
- 45. Kloo B., Nagel D., Pfeifer M., Grau M., Düwel M., Vincendeau M., Dörken B., Lenz P., Lenz G., and Krappmann D. (2011) Critical role of PI3K signaling for NF-κB-dependent survival in a subset of activated B-cell-like diffuse large B-cell lymphoma cells. Proc. Natl. Acad. Sci. U.S.A. 108, 272–277 [DOI] [PMC free article] [PubMed] [Google Scholar]
- 46. Rao C. Y., Fu L. Y., Hu C. L., Chen D. X., Gan T., Wang Y. C., and Zhao X. Y. (2015) H2S mitigates severe acute pancreatitis through the PI3K/AKT-NF-κB pathway in vivo. World J. Gastroenterol. 21, 4555–4563 [DOI] [PMC free article] [PubMed] [Google Scholar]
- 47. Herndon T. M., Pirone D. M., Tsokos G. C., and Chen C. S. (2005) T cell-to-T cell clustering enhances NF-κB activity by a PI3K signal mediated by Cbl-b and Rho. Biochem. Biophys. Res. Commun. 332, 1133–1139 [DOI] [PubMed] [Google Scholar]
- 48. Cescon D. W., She D., Sakashita S., Zhu C. Q., Pintilie M., Shepherd F. A., and Tsao M. S. (2015) NRF2 pathway activation and adjuvant chemotherapy benefit in lung squamous cell carcinoma. Clin. Cancer Res. 21, 2499–2505 [DOI] [PubMed] [Google Scholar]
- 49. Loignon M., Miao W., Hu L., Bier A., Bismar T. A., Scrivens P. J., Mann K., Basik M., Bouchard A., Fiset P. O., Batist Z., and Batist G. (2009) Cul3 overexpression depletes Nrf2 in breast cancer and is associated with sensitivity to carcinogens, to oxidative stress, and to chemotherapy. Mol. Cancer Ther. 8, 2432–2440 [DOI] [PubMed] [Google Scholar]
- 50. Guichard S. M., Curwen J., Bihani T., D'Cruz C. M., Yates J. W., Grondine M., Howard Z., Davies B. R., Bigley G., Klinowska T., Pike K. G., Pass M., Chresta C. M., Polanska U. M., McEwen R., Delpuech O., Green S., and Cosulich S. C. (2015) AZD2014, an inhibitor of mTORC1 and mTORC2, is highly effective in ER+ breast cancer when administered using intermittent or continuous schedules. Mol. Cancer Ther. 14, 2508–2518 [DOI] [PubMed] [Google Scholar]
- 51. Johnston S. R. (2015) Enhancing endocrine therapy for hormone receptor-positive advanced breast cancer: cotargeting signaling pathways. J. Natl. Cancer Inst. 107, djv212. [DOI] [PubMed] [Google Scholar]
- 52. Xie T., Belinsky M., Xu Y., and Jaiswal A. K. (1995) ARE- and TRE-mediated regulation of gene expression: response to xenobiotics and antioxidants. J. Biol. Chem. 270, 6894–6900 [DOI] [PubMed] [Google Scholar]
- 53. Nelson J. D., Denisenko O., and Bomsztyk K. (2006) Protocol for the fast ChIP method. Nat. Protoc. 1, 179–185 [DOI] [PubMed] [Google Scholar]