

Abstract
Background
Despite its importance, total body water (TBW) is usually estimated rather than measured due to the complexity of isotope dilution methods. The aim of this study was to demonstrate the applicability in haemodialysis (HD) patients of a recently developed on-line breath test, previously validated in healthy subjects, that uses the gold standard deuterium dilution method to measure TBW. In particular we wished to show that a pre-dialysis estimation was as good as a post dialysis equilibrated measurement in order to avoid patients needing to remain behind after dialysis treatment.
Methods
The dispersal kinetics of breath HDO, measured using a flowing-afterglow mass spectrometer (FA-MS) following ingestion of D2O immediately post-dialysis, were determined in 12 haemodialysis patients and used to calculate the absolute TBWPostHD after full equilibration. TBWPreHD was then determined from breath samples taken immediately prior to the next dialysis. This measurement was adjusted for the inter-dialytic weight change and urine output (TBWPreHD-adjusted) and compared to the TBWPostHD. The accuracy and precision of FA-MS was also assessed using known concentrations deuterium enriched water samples.
Results
Mean TBWPostHD was 50.0 ± 9.3 L and TBWPreHD-adjusted 50.7 ± 9.0 L. They were highly correlated (R= 0.99, p<0.001) with a CV of 2.6%. The mean difference was +0.74 L (SEM 0.35, 95%CI -0.03 to 1.51 L, P= 0.059), compatible with a daily insensible loss of 0.37 L. Accuracy and precision of FA-MS were comparable to the previous validation work.
Conclusions
This non-invasive adaptation of the D isotope dilution method for determining TBW can be applied to haemodialysis patients who show deuterium equilibration kinetics identical to normal subjects; a pre-dialysis estimation may be used to determine TBW so avoiding the necessity to remain behind after dialysis making this suitable for application in the clinical setting.
Introduction
Absolute measurement of total body water (TBW) is of value in tracking longitudinal body composition, fluid status and individualized dialysis dose in haemodialysis patients. Isotopic dilution studies are the gold standards of TBW measurement. However, due to the complexity of these techniques, specifically the laboratory quantification of isotope in clinical samples, they are largely used for research only [1, 2]. The ideal TBW assessment method is that of a bedside, portable isotopic deuterium dilution method that allows reproducible TBW measurement in a clinical setting. To meet this challenge we have developed a technique of TBW measurement using a Flowing Afterglow Mass Spectrometer (FA-MS) that can measure the D content of breath water vapour giving an immediate result from a sample obtained non-invasively. It is based on the principle of the Deuterium dilution technique, which involves administering a dose of isotope to a subject, allowing the isotope to equilibrate within the dilution volume (in this case TBW) before the dilution volume is determined. The equilibration time for D dilution has been quoted to be between 4 to 6 hours in previous studies [3], although we have demonstrated equilibration with breath in normal subjects is within 2 hours [4]. This is another major limiting factor when applying such conventional isotope dilution technique within a clinical setting, as most patients prefer not to extend their time on the dialysis unit.
The main purpose of this study was to establish the agreement between TBW measured post dialysis following the ingestion of D and observation of its full equilibration with body water over ∼ 2 hours with the TBW measured pre-dialysis at the subsequent dialysis session. If the agreement were sufficiently good, we can then rely on the pre-dialysis TBW measurement alone, negating the need for prolonged breath sampling to achieve equilibration after administrating the D2O. In addition we wished to see if this approach to measuring TBW was acceptable to patients, to determine the subsequent clearance of D from the body and to re-validate the accuracy and precision of FA-MS in the measurement of known concentration of D enriched water samples.
Subjects and Methods
Subjects
12 haemodialysis patients undergoing thrice weekly haemodialysis were selected for their variability in body composition. The average vintage of dialysis was 3.6 years (range from 0.6 to 16 years). Their demographics are summarized in Table 1.
Table 1.
| Patient | Gender | Age | Weight (kg) | BMI (kg/m2) | HD yrs | DEqm (hrs) | UO (ml) | Δ W (kg) | TBW PostHD | TBW PreHD | TBW PreHD-adjusted | Aetiology of renal failure |
|---|---|---|---|---|---|---|---|---|---|---|---|---|
| 1 | M | 53 | 120.0 | 42 | 1.8 | 1.5 | 600 | 2.1 | 61.07 | 62.47 | 59.77 | Diabetic nephropathy |
| 2 | M | 46 | 99.9 | 28 | 1.5 | 1.5 | 0 | 1.3 | 58.98 | 60.81 | 59.51 | Congenital single kidney & right RCC |
| 3 | F | 57 | 133.6 | 46 | 3.5 | Incomplete | 0 | 2.2 | - | - | - | Diabetic nephropathy |
| 4 | M | 76 | 114.2 | 39 | 2.1 | 1.4 | 1350 | 2.7 | 63.47 | 69.08 | 65.03 | Left RCC & ATN |
| 5 | M | 42 | 74.95 | 23 | 17.0 | 1.5 | 0 | 2.55 | 39.97 | 45.09 | 42.54 | Proliferative GN & failed transplant |
| 6 | M | 57 | 114.7 | 38 | 4.0 | 1.5 | 0 | 1.6 | 55.35 | 58.29 | 56.69 | Diabetic nephropathy |
| 7 | F | 58 | 84.6 | 30 | 6.0 | 1.0 | 0 | 2.3 | 44.94 | 49.29 | 46.99 | Diabetic glomerulosclerosis |
| 8 | M | 60 | 82.6 | 24 | 1.9 | 1.88 | 2600 | 1.8 | 49.06 | 53.07 | 48.67 | IgA nephropathy |
| 9 | M | 22 | 64.1 | 23 | 1.4 | 1.5 | 400 | 1.85 | 37.11 | 40.74 | 38.49 | Uncertain aetiology |
| 10 | M | 61 | 76.5 | 25 | 4.2 | 1.8 | 200 | 0.4 | 46.44 | 47.48 | 46.88 | Renovascular disease |
| 11 | F | 49 | 76.5 | 25 | 4.5 | 1.7 | 600 | 2.3 | 39.00 | 41.75 | 38.85 | Recurrent pyelonephritis |
| 12 | M | 50 | 94.3 | 28 | 0.9 | 1.68 | 600 | 1.75 | 54.25 | 56.69 | 54.34 | Adult polycystic kidney disease |
| Mean (SD) | 52.6 (13) | 94.8 (21.6) |
31 (8) |
4.07 (4.36) | 1.54 (0.23) | 529 (77) | 1.90 (0.62) | 49.97 (9.26) | 53.16 (9.13) | 50.71 (8.96) |
Principle of Flowing Afterglow Mass Spectrometer
The Flowing Afterglow Mass Spectrometer is a prototype built by Trans Spectra Ltd., U.K. that underwent safety inspection by the hospital bioengineering department prior to its clinical use. The principle of FA-MS has been described previously [4, 5]. Briefly, a swarm of H3O+ precursor ions is created in inert gas (helium or argon) by a weak microwave discharge. These precursor ions react with water (H216O), deuterated water (HD16O) and the isotopomers (H217O and H218O) that occur naturally in the water vapour present in a breath exhalation (Figure 1). A small fraction of a single breath exhalation is sampled via a calibrated capillary and introduced into the carrier/gas ion swarm. The hydrated ions H3O+.(H2O)3 with a mass-to-charge ratio (m/z) of 73, their isotopic variant ions H8DO4+ and H917OO3+ (m/z of 74) and H918OO3+ (m/z of 75) are thus formed. By adopting the known fractional abundance of 18O in water vapour and accounting for the contribution of the isotopic ions H917OO3+ to the ion signal at m/z of 74, a measurement of the 74/75 ion signal ratio under equilibrium conditions provides the fractional measurement of deuterium abundance in the water vapour sample.
Figure 1.

The subject exhales gently into a disposable tube; breath is sampled from a calibrated capillary into the flow tube where it mixes with protonated water (H3O+) created by a microwave discharge. Whilst flowing down the tube, driven by a constant stream of the inert gas (e.g. Helium), breath water vapour forms clusters with the H3O+, and those with a m/z ratio of 74 will contain Deuterium. A relative increase in these water clusters when compared to m/z 75 detected by the mass spectrometer enables calculation of deuterium enrichment.
Previous studies have shown that FA-MS can be used to measure deuterium in breath water vapour to a precision and accuracy of ∼1% [6]. The method has also been validated in normal subjects, compared with anthropometrics, and used successfully to track their body composition over 12 months [7, 8]. The technique has also been applied to the measurement of TBW and water transport across the peritoneum in peritoneal dialysis patients; in these studies the FA-MS method was able to accurately measure the addition of 2l dialysate to the TBW [9].
Study Design
The protocol (see outline Fig.2) was approved by the local ethics committee and all patients gave their informed consent. Baseline breath samples were obtained on day 1 of the study prior to the ingestion of D2O. Following the ingestion of a dose of D2O (0.3g/kg of body weight; typically 25 ml), detailed dispersal kinetics and dialytic clearances of D2O were determined in all 12 patients. The exhaled breath was directly sampled and analyzed at 5 minute intervals until equilibration was achieved. It should be noted that the D2O quickly becomes HDO in excess water (H2O) via the process of rapid D/H exchange. The dose of D2O was chosen to give a predicted five-fold rise in the breath HDO level [9] for which FA-MS provides accurate measurements. Breath sampling was continued until equilibrium (a steady HDO value in breath) was reached. Baseline TBW post dialysis (TBWPostHD) of the patient was calculated from the increase in breath HDO between equilibration and baseline (pre-ingestion) in relation to the volume of D2O ingested (Equation 1). Finally, the TBW values were reduced by 4% to account for the H-D exchange that occurs between the HDO with the carboxyl and amino groups in body proteins [2].
Figure 2.

Flow diagram of the experimental protocol
Equation 1: Calculation of TBW
V D2O = volume of D2O ingested
Δ (D/H) = the change in breath deuterium content= Average equilibrated D/H of patient minus average baseline D/H
From the day of ingestion of D2O to the pre-dialysis study day, dilution of HDO within the body spaces will occur as the subject ingests fluid (measured by inter-dialytic weight changes). In addition, deuterium losses would also have occurred from sweating, respiration (insensible loss), faecal (not measured) and urinary loss (measured as total urine output over 44 hours). On subsequent pre-dialysis day, breath samples were collected from the patients to calculate pre-haemodialysis TBW (TBWPreHD). This second sampling procedure is shorter, taking only 10 to 15 minutes before dialysis. Therefore, the post-haemodialysis TBW (TBWPostHD) is almost equivalent to TBW pre-dialysis (TBWPreHD) minus the total urine output (UO) and inter-dialytic weight changes (ΔW) plus insensible loss (IL) (Equation 2). When the pre-dialysis TBW was adjusted for inter-dialytic weight changes and urine output, we termed this TBWPre HD_adjusted. By taking into account total urine output (UO) and inter-dialytic weight changes (ΔW), we expected that the TBWPostHD would be highly correlated with TBWPreHD_adjusted.
Equation 2
ΔW = inter-dialytic weight changes
UO = total urine output in 44 hours
IL = insensible loss
To establish the rate of disappearance of D2O from the breath of dialysis patients, further breath samples were taken on subsequent dialysis days before and after dialysis. This enables us to calculate the rate of disappearance of breath and thus body water HDO due to further dilution, insensible and urinary loss as well as due to dialysis treatment. The overall timing of breath samplings and TBW determination are summarised by the flow diagram in Figure 2.
Measurement of deuterium enriched water samples to establish accuracy and reproducibility of FA-MS
Deuterium enriched samples of various concentrations (156, 354, 356, 456, 552, 556, 656 and 750 ppm) were prepared using gravimetric method by mixing 99.8% D2O with local tap water (Cambridge Isotope Laboratories, U.S.). 10 ml of samples were placed in glass bottles sealed with aluminium caps fitted with rubber septa. The samples were heated to 38 °C in a water bath and the headspace vapour was sampled in triplicate (mean calculated to give each value) via a heated capillary using a 23G needle (Figure 1). 2 or 3 measurements of each of the deuterium enriched water samples 156 to 750 ppm were performed over 9 separate sessions to establish accuracy of the FA-MS instrument, see Fig 3. Reproducibility between sessions was then calculated by taking 18 measurements of the 556 and 656 ppm samples (9 measurements each), chosen as these represent the range of concentrations of HDO achieved at equilibration level following ingestion of D2O.
Figure 3.
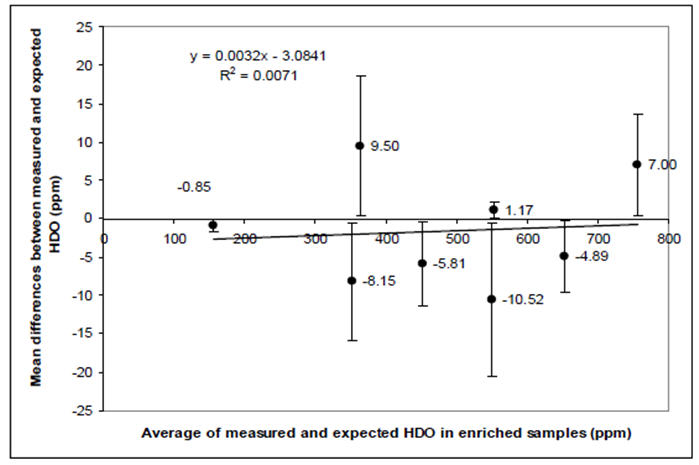
Bland and Alman plot of observed versus expected measurements of D abundance in the vapour phase above known dilutions of HDO in tap water. Each point represents the mean (±95% CI) difference at 8 different dilutions each measured at 9 independent experimental sessions. The average difference across the range of dilutions was −0.25 ppm; the outer limits for all the 95%CI are ±20 ppm, 3% of a typical measurement.
Data acquisition and Statistics
The D/H ratio was obtained using the FA-MS data acquisition programme (SCILIB library, version 4.96, 2005, Patrik Spanel, Trans Spectra Ltd., http://www.transspectra.com). Data normality was confirmed (Kolmogorov-Smirnov test). Data were presented as mean ± standard deviation (SD). Correlation between TBWPostHD and TBWPreHD-adjusted was assessed using the Pearson’s correlation coefficient. Coefficient of variance (CV) was used to assess variability. Paired t-tests were used to compare means. A Bland and Altman plot was applied to assess the agreement between TBWPostHD and TBWPreHD-adjusted. The accuracy of FA-MS was established by comparing the measured D/H measurements to the expected D/H values of the D enriched samples. The relationship of the measured to the expected value was investigated using Pearson’s correlation. The Paired Student t-test was also used to determine the differences between the expected to measured values.
The agreement of the values was assessed using a Bland and Altman plot. The reproducibility of measurements was established by 9 repeated analyses of the 556 and 656 ppm samples according to the coefficients of variation of these measurements. Statistical analyses were performed using the SPSS 14.0 statistical package (SPSS Inc., U.S.).
Results
12 patients completed the study. The data for one patient (patient 3) were excluded from analysis due to the failure to achieve full equilibration, since the study had to be terminated early. Two patients were unable to complete final part of the protocol (D disappearance) due to hospital admissions unrelated to the study. The average inter-dialytic weight gain of the cohort was 1.9 ± 0.6kg. None of the patients had recent intra-dialytic hypotension or clinical symptoms to suggest fluid overload. The demographics of the patients are shown in Table 1.
The accuracy in measurement of deuterium in the vapour phase by the FA-MS is shown in Figure 3. The Pearson’s correlation between expected and measured D/H was 0.99 (p < 0.001). The mean D/H values of 556 ppm and 656 ppm standards were measured to be (528 ± 12.8) ppm and (632.6 ± 16.7) ppm and the coefficients of variation were 2.4% and 2.6% respectively.
The ease of breath sample acquisition was closely monitored throughout the study. No difficulty in breath sampling was reported by the patients. The distribution kinetics of the D2O following ingestion of D after dialysis was established to determine the TBWPostHD at the end of equilibration. The HDO equilibration (Deqm) times for the 12 patients are given in Table 1. The average Deqm time was 1.54 ± 0.23 hours. Three distinct phases of breath deuterium content, similar to non-dialysis subjects [4], are shown in Figure 4a. The clearance of HDO is illustrated in Figure 4b.
Figure 4. Deuterium Kinetics.
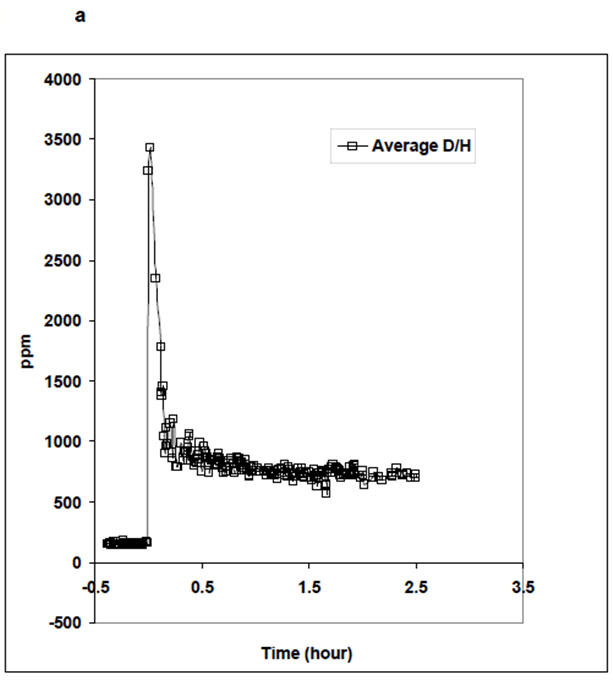

(a) Average equilibration curve of breath D following oral ingestion; the initial large peak is due to D still present in the mouth. Subsequently there is gastrointestinal absorption and then equilibration by 2 hours.
(b) Over the next few days there is exponential clearance of D from the breath, (mean values, those marked PRE are pre-dialysis) predominantly during dialysis treatments (shown as vertical arrows) such that it is cleared by 10 days.
The individual TBW values measured by FA-MS after dialysis (TBWPostHD), pre-dialysis (TBWPreHD) and following adjustment for interdialytic changes TBWPreHD-adjusted are summarized in Table 1. TBWPostHD was strongly correlated with TBWPreHD-adjusted (R= 0.99, P < 0.001), with a C.V. of 2.6%. The mean difference between TBWPostHD (50.0 ± 9.3 L) and TBWPreHD-adjusted (50.7 ± 9.0 L) was 0.74 L (SEM 0.35, CI -0.03 to 1.51, P= 0.059). This was compatible with a daily insensible loss of 0.37 L. The Bland and Altman plot demonstrates this agreement with no significant bias between post-dialysis and adjusted pre-dialysis TBW (Figure 5).
Figure 5.

Bland and Altman plot comparing the measurement of TBW following post-dialysis equilibration and immediately prior to the next dialysis session, having adjusted for weight changes and urine output. The small systematic difference can be explained by insensible losses; there is no bias across the wide range of TBW volumes studied.
Discussion
This paper described a Deuterium-dilution technique that can be integrated into the current dialysis schedule, allowing determination of post-dialysis TBW by measurement breath samples 10 to 15 minutes before a dialysis session. The FA-MS measurements using prepared deuterium enriched water samples indicated an accuracy of ∼2% and has high reproducibility in the measurement of HDO in water vapour, reinforcing our earlier validation work [6].
Breath sampling is a simple and effortless technique preferred by many patients to blood sampling. Compared to conventional deuterium measurement methods using blood samples, FA-MS has a number of advantages. Firstly, it involved non-invasive breath sampling. Secondly, no adjustment of the difference between plasma water and plasma volume is necessary since the dilution space of HDO in breath is 100% water vapour. In the conventional D dilution technique involving blood or plasma samples further adjustment of dilution space to plasma water volume is required as an average plasma sample contained only 93% water [10]. Furthermore, FA-MS not only enables on-line assessment of TBW, as with bioelectrical impedance, but it is the currently only near-subject isotopic dilution technique which can measure the absolute TBW rather than relying on regression equations.
This study has established the absorption, equilibration and clearance kinetics of HDO in the water vapour contained in breath of dialysis patients. The distribution kinetics of HDO in breath following an ingestion of D after dialysis is similar in HD patients to that in healthy subjects [4]. The HDO equilibration time was well within 2 hours for all the patients. Although other workers have postulated that the rate of D equilibration may be dependent on body composition, gastrointestinal absorption and cardiac output of the subjects [11, 12], no obvious related differences have been observed in the HDO kinetic profiles of our patients. One factor that requires consideration when using the deuterium dilution technique is the reduction by 4% in the derived TBW to adjust for the non-aqueous hydrogen exchange between the HDO and the carboxyl and amino groups in body proteins [2]. The exact value for this correction factor is unclear but is generally thought to be between 2 to 6% as extrapolated from animal studies [13, 14]. In this study, the small difference in absolute post- and pre-dialysis TBW over 44 hours, which can be accounted for by insensible loss, suggests that this fraction of non-aqueous exchange does not continue to increase after equilibration (i.e. 2 hours) and the subsequent prolonged inter-dialytic period.
Assuming that inter-dialytic fluid losses are accurately measured, we postulated that the TBW measured post dialysis will be highly correlated to the TBW measured at the subsequent pre-dialysis day. We found that the TBW measured after equilibration of HDO in breath is indeed highly correlated to TBW that measured pre-dialysis. The correlation is enhanced when the pre-dialysis TBW is adjusted to urine output/44 hours and inter-dialytic weight gain. This is vital as the breath sampling regime before dialysis means that it is not necessary for patients to stay behind after dialysis in order to complete the equilibration phase. Additionally, the small difference in the TBW between dialyses can be explained by insensible loss, confirming the ability of FA-MS in tracking fluid status changes between dialysis.
Whilst the number of overall patients, and specifically female subjects, in this study are small, we have demonstrated that the dispersal kinetics and clearance of deuterium are highly reproducible in haemodialysis patients. Additionally, the kinetic profiles are not different between female and male subjects. The main confounder of this approach is the accuracy of inter-dialytic fluid losses measurements. Accepting that patients do not always remember to collect their urine and the presence of systemic error in weighing of patients (same scale was used with similar clothing in this study), this sampling regime is still highly reproducible and accurate. A proof of principle study is now required to determine the clinical value of absolute TBW determination in conjunction with bioelectrical impedance analyser to improve clinical management.
Acknowledgements
This study was supported by a Project Grant from Kidney Research UK with additional funding from the North Staffordshire Medical Institute. The manufacture of the FA-MS prototype was funded by the Wellcome Trust.
References
- 1.Schoeller DA, van Santen E, Peterson DW, et al. Total body water measurement in humans with 18O and 2H labeled water. Am J Clin Nutr. 1980;33:2686–93. doi: 10.1093/ajcn/33.12.2686. [DOI] [PubMed] [Google Scholar]
- 2.Arkouche W, Fouque D, Pachiaudi C, et al. Total body water and body composition in chronic peritoneal dialysis patients. J Am Soc Nephrol. 1997;8:1906–14. doi: 10.1681/ASN.V8121906. [DOI] [PubMed] [Google Scholar]
- 3.Schoeller D. Hydrometry: Body Composition Measurement Methods. In: Heymsfield SB, Lohman TG, Wang ZM, Going SB, editors. Human Body Composition. 2nd ed. Human Kinetics; 2005. pp. 35–50. [Google Scholar]
- 4.Davies S, Spanel P, Smith D. Rapid measurement of deuterium content of breath following oral ingestion to determine body water. Physiol Meas. 2001;22:651–9. doi: 10.1088/0967-3334/22/4/301. [DOI] [PubMed] [Google Scholar]
- 5.Smith D, Spanel P. On-line determination of the deuterium abundance in breath water vapour by flowing afterglow mass spectrometry with applications to measurements of total body water. Rapid Commun Mass Spectrom. 2001;15:25–32. doi: 10.1002/1097-0231(20010115)15:1<25::AID-RCM187>3.0.CO;2-2. [DOI] [PubMed] [Google Scholar]
- 6.Spanel P, Smith D. Accuracy and precision of flowing afterglow mass spectrometry for the determination of the deuterium abundance in the headspace of aqueous liquids and exhaled breath water. Rapid Commun Mass Spectrom. 2001;15:867–72. doi: 10.1002/rcm.310. [DOI] [PubMed] [Google Scholar]
- 7.Smith D, Engel B, Diskin AM, Spanel P, Davies SJ. Comparative measurements of total body water in healthy volunteers by online breath deuterium measurement and other near-subject methods. Am J Clin Nutr. 2002;76:1295–301. doi: 10.1093/ajcn/76.6.1295. [DOI] [PMC free article] [PubMed] [Google Scholar]
- 8.Engel B, Spanel P, Smith D, Diskin A, Davies SJ. Longitudinal measurements of total body water and body composition in healthy volunteers by online breath deuterium measurement and other near-subject methods. International Journal of Body Composition Research. 2004;2:99–106. [PMC free article] [PubMed] [Google Scholar]
- 9.Asghar RB, Diskin AM, Spanel P, Smith D, Davies SJ. Measuring transport of water across the peritoneal membrane. Kidney Int. 2003;64:1911–5. doi: 10.1046/j.1523-1755.2003.00253.x. [DOI] [PMC free article] [PubMed] [Google Scholar]
- 10.Kloppenburg WD, Stegeman CA, de Jong PE, Huisman RM. Anthropometry-based equations overestimate the urea distribution volume in hemodialysis patients. Kidney Int. 2001;59:1165–74. doi: 10.1046/j.1523-1755.2001.0590031165.x. [DOI] [PubMed] [Google Scholar]
- 11.Goran MI, Poehlman ET, Nair KS, Danforth E. Effect of gender, body composition, and equilibration time on the 2H-to-18O dilution space ratio. Am J Physiol. 1992;263:E1119–24. doi: 10.1152/ajpendo.2006.263.6.E1119. [DOI] [PubMed] [Google Scholar]
- 12.Wong WW, Cochran WJ, Klish WJ, et al. In vivo isotope-fractionation factors and the measurement of deuterium- and oxygen-18-dilution spaces from plasma, urine, saliva, respiratory water vapor, and carbon dioxide. Am J Clin Nutr. 1988;47:1–6. doi: 10.1093/ajcn/47.1.1. [DOI] [PubMed] [Google Scholar]
- 13.Culebras JM, Fitzpatrick GF, Brennan MF, Boyden CM, Moore FD. Total body water and the exchangeable hydrogen. II. A review of comparative data from animals based on isotope dilution and desiccation, with a report of new data from the rat. Am J Physiol. 1977;232:R60–5. doi: 10.1152/ajpregu.1977.232.1.R60. [DOI] [PubMed] [Google Scholar]
- 14.Culebras JM, Moore FD. Total body water and the exchangeable hydrogen. I. Theoretical calculation of nonaqueous exchangeable hydrogen in man. Am J Physiol. 1977;232:R54–9. doi: 10.1152/ajpregu.1977.232.1.R54. [DOI] [PubMed] [Google Scholar]