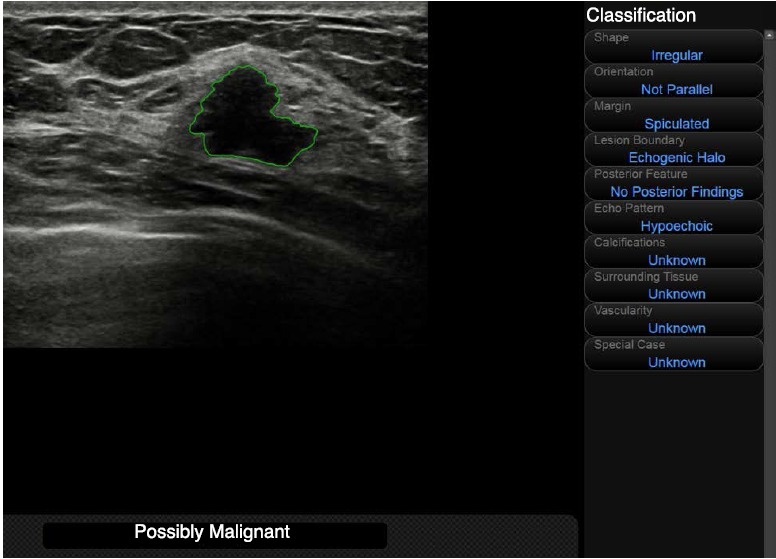
Fig. 1. Representative image showing the setting of the region-of-interest (ROI) for S-Detect analysis.

After the ROI was drawn along the border of the mass, ultrasonographic features were analyzed automatically by the S-Detect program and a final assessment was produced.
