Abstract
The aim of this study was to explore the clinical value of dual-energy spectral CT imaging in the differential diagnosis between bladder cancer and benign prostate hyperplasia (BPH).
We retrospectively analyzed images of 118 patients who received pelvic dual-energy spectral CT imaging. These patients were later confirmed to have bladder cancer in 61 patients and BPH in 57 patients. CT values of the 2 lesion types from 40 to 140 keV were measured from the monochromatic spectral CT image to generate spectral HU curves. The slope of the spectral curve and the lesion effective atomic number were calculated. The measured parameters were analyzed with independent-sample Mann-Whitney U test.
There was a statistically significant difference in CT value between the 2 groups from 40 to 90 keV, with the biggest difference at 40 keV (median and interquartile range: 83.3 HU and 22.9 HU vs 60.6 HU and 16.7 HU, Z = 5.932, P < 0.001). The slope of the spectral HU curve for bladder cancer was markedly higher than that of BPH (median and interquartile range: 0.48 and 0.23 vs 0.26 and 0.22, Z = 5.162, P < 0.001); the difference in effective atomic number (median and interquartile range: 7.99 and 0.21 vs 7.80 and 0.20, Z = 5.233, P < 0.001) was also statistically significant.
Dual-energy spectral CT imaging provides high sensitivity and specificity for differentiating bladder cancer from benign prostate hyperplasia.
Keywords: Benign prostate hyperplasia, bladder cancer, CT
1. Introduction
Bladder cancer is the most frequently seen urinary tract tumor. A total of 56,390 estimated new cases of bladder cancer were expected among men in the United States in 2014, of which 11,170 died of bladder cancer.[1] And in China, the estimated incidence and mortality rate were 62.1 and 18.4 per thousands in 2015.[2] Bladder cancer is seen in any part of bladder, partially in the posterior wall, and mostly in men of 50 to 70 years of age. However, in this age group, the most susceptible benign disease is benign prostate hyperplasia (BPH).[3] Severe BPH, which is defined as having lesion volume 3 times larger than that of normal BPH, with intravesical protrusion can induce bladder outlet obstruction and thus demonstrate the symptoms similar to bladder cancer.[4] And BPH was an important factor in the pathogenesis of bladder cancer. They often exist at the same time.[5]
Currently, there are many clinical diagnostic tools for bladder cancer. Cystoscopy enables direct observation of foci and has high accuracy, but it is an invasive technique and has many contraindications, thus observing cancer infiltration degree and metastasis is impossible.[6] Color Doppler ultrasonography is convenient, noninvasive, low-cost, and free of contraindications, but the ultrasonic reliability of bladder cancer greatly depends on the resolution of ultrasonic instrument and the manipulations, and limited by the subjectivity and expertise of the examiner.[7] In accordance with the 1997 TNM system of the International Union against Cancer, Stage T4a of bladder cancer invades prostate.[8] MRI has high sensitivity for bladder cancer and shows the relationship between prostate and posterior wall of bladder, but it is only indicated if CT is contraindicated. And it has high costs, takes a long time for examination, and demonstrates low patient compliance; meanwhile, MRI is contraindicated in some patients with metal implants and not sensitive to calcification foci.[9] Traditional polychromatic CT enables the clear observation of the site, range and infiltration degree of bladder cancer and also can distinctly show adjacent organ invasion and lymph node metastasis sign. However, BPH can cause protrusion of nodular, mass-like tissue extending upward to about the base of bladder.[10,11] So in the cases of severe BPH, CT is sometime incapable of distinguishing bladder cancer from severe BPH with bladder bottom upward displacement caused by compression and even intravesical protrusion because of the similar CT number on traditional polychromatic CT and the axial plane imaging used routinely in body CT.[12]
Recently, a novel dual-energy spectral CT scan mode was introduced, which uses 2 x-ray spectrums produced simultaneously by the rapid switching of high- and low-tube voltages within a rotation, to generate a set of virtual monochromatic images with energies ranging from 40 to 140 keV.[13] This spectral CT imaging method is different from that of the dual source, dual-energy imaging method where final images are the linear (usually) combination of the 2 reconstructed images from 80 and 140 kVp.[14] In the spectral CT imaging, the projections obtained from the 80 and 140 kVp tube voltages are analyzed to generate 2 material decomposition image sets, and 101 virtual monochromatic images are then generated from the 2 material decomposition images. For the dual-energy spectral CT imaging mode, the images corresponding to the 80kVp data set are not reconstructed separately and only the original images corresponding to 140kVp exist for quality insurance. The application of dual-energy spectral CT imaging in different organs has been studied,[15–22] but the imaging comparison of bladder cancer and BPH has not been reported. This study aimed to explore the application value of this dual-energy spectral CT imaging mode in the differential diagnosis between bladder cancer and BPH.
2. Materials and methods
2.1. General data
This retrospective study was approved by the Ethics Committee in our hospital. During July 2011 and February 2013, 236 male patients received pelvic dual-energy spectral CT imaging in our hospital because of frequent micturition, urgent micturition, odynuria, dysuria, or painless hematuria. Among the 236 patients, 118 had surgical or pathological confirmation and were included in this study. From the 118 patients included in the study, 61 patients with a mean age of 71 ± 11 (29–90) years had bladder cancer (45 cases on posterior wall, 3 cases on anterior wall, and 13 cases on lateral wall), and 57 patients with a mean age of 73 ± 8 (58–90) years had BPH (37 cases with severe intravesical protrusion).
2.2. Instruments and methods
All spectral CT scans were performed on a Discovery CT750HD (GE Healthcare, Waukesha, WI). Patients were asked to drink 500 to 1000 mL of water 2 h before scanning so that their bladders were well-filled. Pelvic dual-energy spectral CT imaging was performed in a dorsal position and using the following scan parameters: rapid switching of 140 and 80 kVp tube voltage in 0.5 ms, tube current, 360 mAs; slice thickness, 5 mm; slice interval, 5 mm; and helical pitch, 1.375. 101 sets of virtual monochromatic images with photon energy levels from 40 to 140 keV were reconstructed at 5 mm image slice thickness. Image set corresponding to the 140 kVp tube voltage was also generated from the dual-energy spectral CT imaging and used as a reference standard for the conventional CT scan.
2.3. Image analysis and measurement
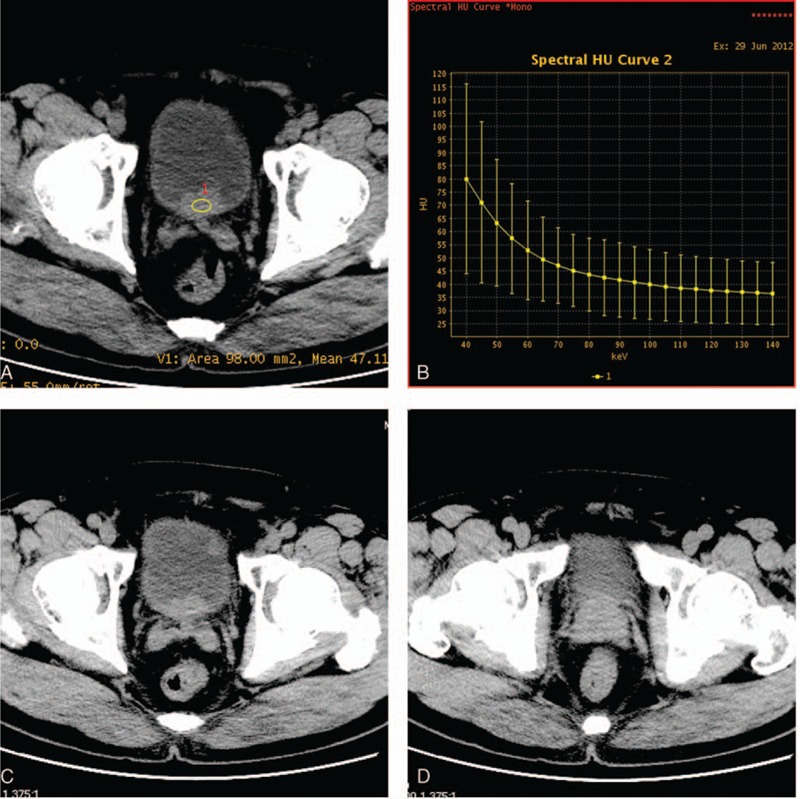
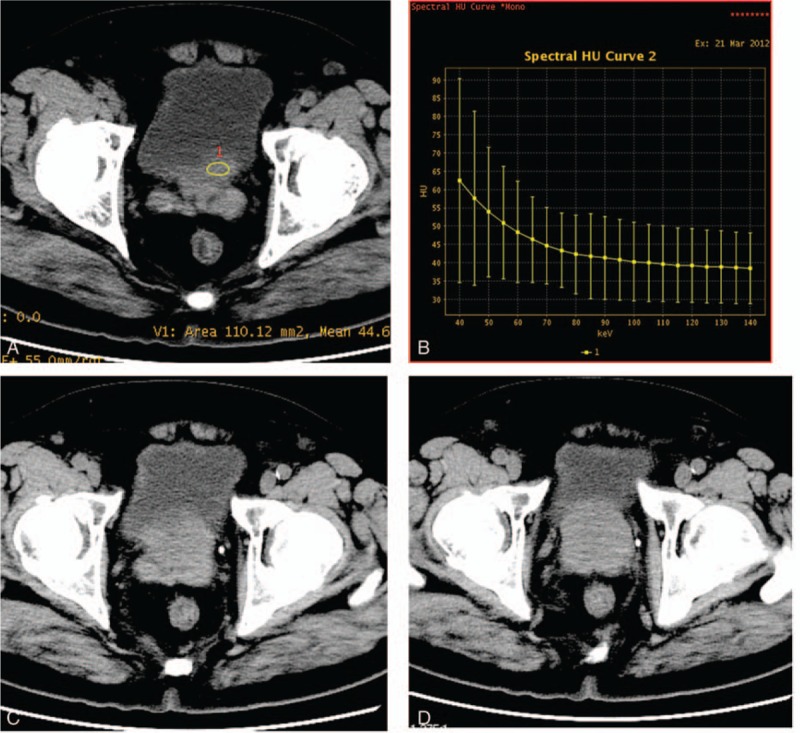
All images were transferred to an Advanced Workstation 4.5 (AW4.5) and evaluated by a senior abdominal radiologist (with 10 years of experience) using a gemstone spectral imaging (GSI) viewer software. The regions of interest (ROIs) were selected at the lesions of the bladder cancer (Fig. 1A and B) and BPH (Fig. 2A and B) on the 70 keV image first to measure their CT values. The ROI measurements were then propagated automatically by GSI Viewer to all energy levels to generate spectral HU curves for the lesions (CT number as a function of photon energy from 40 to 140 keV). The slope (k) of the spectral HU curve was calculated with the following formula: k = y/x, where y is the difference between mean CT value at 40 and 140 keV, and x is the energy level difference (x = 100 in our study). The effective atomic numbers (Eff-Z numbers) were also calculated for the lesions by scanner software based on the HU spectral curve (CT number change as function of photon energy) and the value with the highest frequency on the effective atomic number plot was selected to represent the Eff-Z number of lesions. The CT number measurement was repeated on the 140 kVp polychromatic images obtained from the same dual-energy spectral CT imaging.
Figure 1.

Monochromatic 70 keV axial image of a 72-year-old patient with bladder cancer on the posterior wall (A) and the next neighbouring layers (C, D). It did not distinguish between the bladder cancer and prostate. Curve on the right (B) shows the CT number as function of photon energy for the bladder cancer.
Figure 2.

Monochromatic 70 keV axial image of a 83-year-old patient with benign prostate hyperplasia (A) and the next neighbouring layers (C, D). Curve on the right (B) shows the CT number as function of photon energy.
2.4. Statistical analysis
Quantitative measurements for bladder cancer and BPH were analyzed using SPSS 19.0 statistical software package with P < 0.05 indicating statistical significance (SPSS Inc, Chicago, IL). The CT value differences at energy levels from 40 to 140keV (at 10 keV interval) and the polychromatic 140kVp level, and slope k and Eff-Z number were compared between the bladder cancer group and BPH group using independent sample Mann-Whitney U test. Monochromatic images for achieving the highest differences in CT number, slope k, and Eff-Z number between the bladder cancer and BPH were analyzed by receiver-operating characteristic (ROC) curves. The diagnostic capability was determined by calculating the area under the curve (AUC). Youden Index (Youden index = sensitivity + specificity − 1) was calculated, and the best sensitivity and specificity were achieved by using the optimal diagnostic threshold.
3. Results
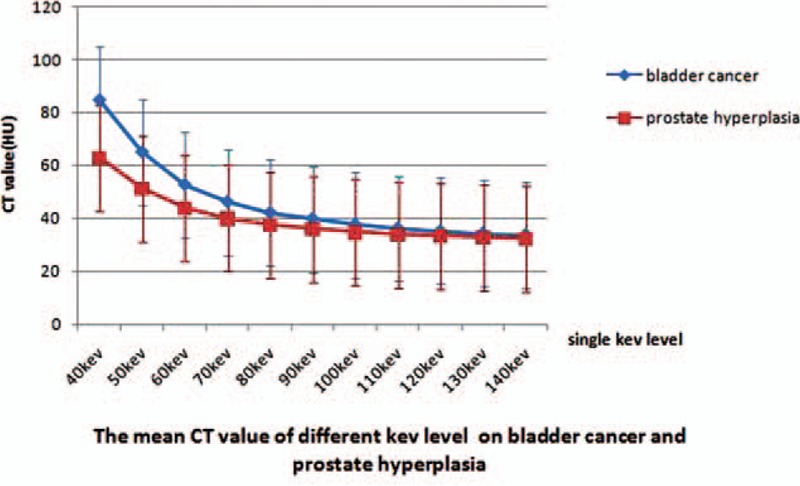
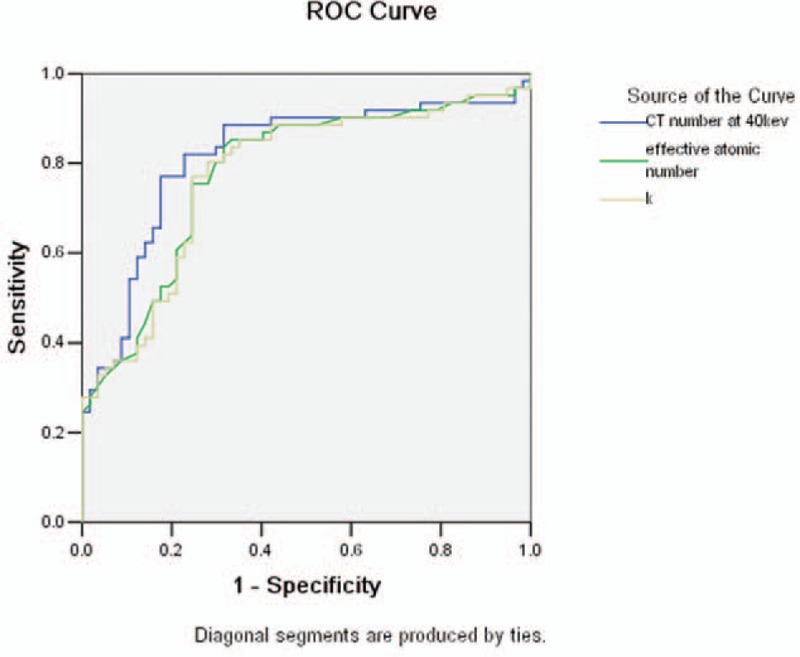
The comparison of CT value between bladder cancer and BPH at different energy levels is shown in Table 1. There was a statistically significant difference in CT value between bladder cancer group and BPH group at energy levels from 40 to 90 keV, with the biggest difference at 40 keV (median and interquartile range: 83.3 HU and 22.9 HU vs 60.6 HU and 16.7 HU, Z = 5.932, P < 0.001). Smaller differences in CT value were found at higher energy levels. There was no statistically significant difference in CT value at the energy levels from 100 to 140 keV, as well as the polychromatic 140 kVp energy level. The slope of the spectral HU curve for bladder cancer was significantly higher than that of BPH (k) (median and interquartile range: 0.48 and 0.23 vs 0.26 and 0.22, Z = 5.162, P < 0.001, Fig. 3). There was also statistically significant difference in Eff-Z number (median and interquartile range: 7.99 and 0.21 vs 7.80 and 0.20, Z = 5.233, P < 0.001) and the peak value of the Eff-Z number (8.02 and 0.28 vs 7.84 and 0.22, Z = 4.559, P < 0.001) between the 2 groups. ROC curves of using the CT value at 40 keV, Eff-Z number, and slope of spectral HU curve (k) for differentiating bladder cancer from BPH are shown in Figure 4, and their ROC results are showed in Table 2.
Table 1.
The mean CT number measurement (HU) of bladder cancer and BPH as function of photon energy from 40 to 140 keV as well as on polychromatic 140 kVp images (median, interquartile range).

Figure 3.

Direct comparison of the mean CT number as function of photon energy for bladder cancer (n = 61) and benign prostate hyperplasia (BPH) (n = 57). The slope of the curve for bladder cancer was significantly greater than that of BPH.
Figure 4.

Receiver-operating characteristics (ROC) curves with CT number at 40 keV, Eff-Z number, and slope of spectral HU curve (k) for the diagnosis of bladder cancer: the AUC were 0.817, 0.779, 0.776, respectively.
Table 2.
ROC results with CT number at 40 keV, effective atomic number, and slope of spectral HU curve (k) for the differential diagnosis between bladder cancer and benign prostate hyperplasia.

4. Discussion
Bladder cancer and BPH are the 2 common lesion types of the urinary system in men of 50 to 70 years of age. The main imaging manifestation of bladder cancer is intravesically protruding irregular neoplasm. BPH is characterized by enlarged prostate with protrusion toward posterior wall of bladder neck, and its imaging manifestation is the same as bladder cancer. It is very important in the selection of clinical therapy and the prognosis evaluation to identify whether bladder wall lesion is bladder cancer, especially posterior wall bladder cancer, or BPH with intravesical protrusion.
However, in the conventional CT imaging, a single CT value measurement is obtained for any object point, and this single CT value reflects the compound effect of averaging attenuation of polychromatic x-ray spectrum. Both bladder cancer and BPH have densities of soft tissue, and this average effect greatly reduces the CT number difference between bladder cancer and BPH. Thus, conventional CT imaging is often unable to separate bladder cancer from BPH. In our study, CT values measured on the 140kVp images showed no statistical difference between bladder cancer and BPH, indicating very low probability to separate the 2 lesion types using CT value measurement alone with the conventional 140kVp imaging technique.
On the contrary, dual-energy spectral CT imaging is a brand-new imaging technique. Previous study[23] has shown that the signal-to-noise ratio (SNR) and contrast-to-noise ratio (CNR) of tissues and organs in monochromatic images are both greater than those in polychromatic images, and the monochromatic image quality is also better. Compared with polychromatic CT, dual-energy spectral CT imaging with multiple parameters provides more analysis tools and quantitative indicators. A substance consisting of different chemical molecules has different x-ray absorption characteristics at different photon energies, and CT attenuation curve of a substance (i.e., spectral HU curve) can be obtained referring to the principle that x-ray beam attenuates when passing through a substance. Different mean CT values of lesions and human body tissues at different monochromatic keV levels and the difference of spectral HU curve are used to distinguish substances of different densities in human body.[24–26]
Bladder cancer cells are often arranged abnormally, manifested by cell nucleus anaplasia, whereas BPH is mainly characterized by an increased density of smooth muscle cells. The different characteristics between bladder cancer and BPH were clearly reflected by the higher atomic number and more rapid changes of CT value as a function of photon energy (greater slope value of the spectral HU curve) for the bladder cancer in our study. Our study indicated that the slope of the spectral HU curve for bladder cancer was significantly higher than that for BPH; bladder cancer GSI curve was routing more sharply than BPH GSI curve. Suggesting the attenuation of bladder cancer was higher than BPH. There was also statistically significant difference in Eff-Z number between bladder cancer and BPH. The CT value measurement at 40 keV revealed the biggest difference between bladder cancer and BPH because the lower-energy photons accentuates the attenuation difference of different materials.[27] Using CT value threshold value of 73.4 HU at 40 keV, we obtained sensitivity and specificity of 77.0% and 82.5%, respectively (with AUC of 0.817) for differentiating bladder cancer from BPH.
Our study did have several limitations. First, we did not research the difference between different stages of bladder cancer with BPH. Second, only one slope (k) value for the spectral HU curve was calculated in our study. In reality, the slope of the curve changes with photon energy, owing to the nonlinear nature of the attenuation. The single slope value covering the whole energy range used in this study can only reflect the average attenuation effect. However, whether or not the use of multiple slopes can improve the accuracy needs further study. Finally, not all the bladder cancers in our study were on posterior wall, and we did not analyze the difference between them in iodine contrast imaging. We will collect more bladder cancer on posterior wall and explore the potential of iodine contrast application in our future study to make the result better.
In conclusion, spectral CT enables multiparameter imaging of the urinary tract; CT value measurement on the monochromatic images at 40 keV provides high sensitivity and specificity for differentiating posterior wall bladder cancer from BPH with intravesical protrusion.
Acknowledgments
The authors acknowledge Jingying Li, Yun Shen, Huayang Liu, and Huizhi Cao (CT Imaging Research Center, GE Healthcare China) for the linguistic editing and explaning the principle of Dual-energy Spectral CT Imaging.
Footnotes
Abbreviations: AUC = area under the curve, BPH = benign prostate hyperplasia, CT = computed tomography, Eff-Z number = effective atomic number, GSI = gemstone spectral imaging, MRI = magnetic resonance imaging, ROC = receiver-operating characteristic, ROI = region of interest.
Author contributions: AC and AL designed the research; AC, JL, and YL performed the research; AC and ST analyzed the data; AC, AL, and HW wrote the article; AC made the figures; all authors have read and approved the final version to be published.
The authors declare no competing financial interests.
References
- [1].Siegel R, Ma J, Zou Z, et al. Cancer statistics, 2014. Cancer J Clin 2014;64:9–29. [DOI] [PubMed] [Google Scholar]
- [2].Chen W, Zheng R, Baade PD, et al. Cancer statistics in China, 2015. Cancer J Clin 2016;66:115–32. [DOI] [PubMed] [Google Scholar]
- [3].Bushman W. Etiology, epidemiology, and natural history of benign prostatic hyperplasia. Urol Clin North Am 2009;36:403–15. [DOI] [PubMed] [Google Scholar]
- [4].Gosling JA, Kung LS, Dixon JS, et al. Correlation between the structure and function of the rabbit urinary bladder following partial outlet obstruction. J Urol 2000;163:1349–56. [PubMed] [Google Scholar]
- [5].Li S, Zeng XT, Ruan XL, et al. Simultaneous transurethral resection of bladder cancer and prostate may reduce recurrence rates: A systematic review and meta-analysis. Experiment Ther Med 2012;4:685–92. [DOI] [PMC free article] [PubMed] [Google Scholar]
- [6].Gualdi GF, Casciani E, Rojas M, et al. Virtual cystoscopy of bladder neoplasms. Preliminary experience. Radiol Med 1999;97:506–9. [PubMed] [Google Scholar]
- [7].McKibben MJ, Woods ME. Preoperative imaging for staging bladder cancer. Curr Urol Rep 2015;16:22. [DOI] [PubMed] [Google Scholar]
- [8].Sobin LH, Wittekind CH. International Union Against Cancer (UICC):TNM classification of malignant tumors. 1997;New York, NY:Wiley-Liss, 170-173. [Google Scholar]
- [9].Roupret M. Tumours of the bladder: what does the urologist expect from imaging? Diagn Interv Imaging 2012;93:291–6. [DOI] [PubMed] [Google Scholar]
- [10].Shinagare AB, Sadow CA, Sahni VA, et al. Urinary bladder: normal appearance and mimics of malignancy at CT urography. Cancer Imag 2011;11:100–8. [DOI] [PMC free article] [PubMed] [Google Scholar]
- [11].Raman SP, Fishman EK. Bladder malignancies on CT: the underrated role of CT in diagnosis. AJR Am J Roentgenol 2014;203:347–54. [DOI] [PubMed] [Google Scholar]
- [12].MacVicar AD. Bladder cancer staging. BJU Int 2000;86(Suppl 1):111–22. [DOI] [PubMed] [Google Scholar]
- [13].Marin D, Boll DT, Mileto A, et al. State of the art: dual-energy CT of the abdomen. Radiology 2014;271:327–42. [DOI] [PubMed] [Google Scholar]
- [14].Yu L, Christner JA, Leng S, et al. Virtual monochromatic imaging in dual-source dual-energy CT: radiation dose and image quality. Med Phys 2011;38:6371–9. [DOI] [PMC free article] [PubMed] [Google Scholar]
- [15].Shuman WP, Green DE, Busey JM, et al. Dual-energy liver CT: effect of monochromatic imaging on lesion detection, conspicuity, and contrast-to-noise ratio of hypervascular lesions on late arterial phase. AJR Am J Roentgenol 2014;203:601–6. [DOI] [PubMed] [Google Scholar]
- [16].Yamada Y, Jinzaki M, Tanami Y, et al. Virtual monochromatic spectral imaging for the evaluation of hypovascular hepatic metastases: the optimal monochromatic level with fast kilovoltage switching dual-energy computed tomography. Invest Radiol 2012;47:292–8. [DOI] [PubMed] [Google Scholar]
- [17].Li M, Zheng X, Li J, et al. Dual-energy computed tomography imaging of thyroid nodule specimens: comparison with pathologic findings. Invest Radiol 2012;47:58–64. [DOI] [PubMed] [Google Scholar]
- [18].Lin XZ, Miao F, Li JY, et al. High-definition CT Gemstone spectral imaging of the brain: initial results of selecting optimal monochromatic image for beam-hardening artifacts and image noise reduction. J Comput Assis Tomogr 2011;35:294–7. [DOI] [PubMed] [Google Scholar]
- [19].Lin XZ, Wu ZY, Tao R, et al. Dual energy spectral CT imaging of insulinoma-Value in preoperative diagnosis compared with conventional multi-detector CT. Eur J Radiol 2012;81:2487–94. [DOI] [PubMed] [Google Scholar]
- [20].Lv P, Lin XZ, Li J, et al. Differentiation of small hepatic hemangioma from small hepatocellular carcinoma: recently introduced spectral CT method. Radiology 2011;259:720–9. [DOI] [PubMed] [Google Scholar]
- [21].Wu HW, Cheng JJ, Li JY, et al. Pulmonary embolism detection and characterization through quantitative iodine-based material decomposition images with spectral computed tomography imaging. Invest Radiol 2012;47:85–91. [DOI] [PubMed] [Google Scholar]
- [22].Silva AC, Morse BG, Hara AK, et al. Dual-energy (spectral) CT: applications in abdominal imaging. Radiographics 2011;31:1031–46. discussion 1047-1050. [DOI] [PubMed] [Google Scholar]
- [23].Cui Y, Gao SY, Wang ZL, et al. Which should be the routine cross-sectional reconstruction mode in spectral CT imaging: monochromatic or polychromatic? Br J Radiol 2012;85:e887–90. [DOI] [PMC free article] [PubMed] [Google Scholar]
- [24].Kang MJ, Park CM, Lee CH, et al. Dual-energy CT: clinical applications in various pulmonary diseases. Radiographics 2010;30:685–98. [DOI] [PubMed] [Google Scholar]
- [25].Karcaaltincaba M, Aktas A. Dual-energy CT revisited with multidetector CT: review of principles and clinical applications. Diagn Interv Radiol 2011;17:181–94. [DOI] [PubMed] [Google Scholar]
- [26].Remy-Jardin M, Faivre JB, Pontana F, et al. Thoracic applications of dual energy. Radiol Clin North Am 2010;48:193–205. [DOI] [PubMed] [Google Scholar]
- [27].Rutt BK, Cunningham IA, Fenster A. Selective iodine imaging using lanthanum K fluorescence. Med Phys 1983;10:801–8. [DOI] [PubMed] [Google Scholar]


