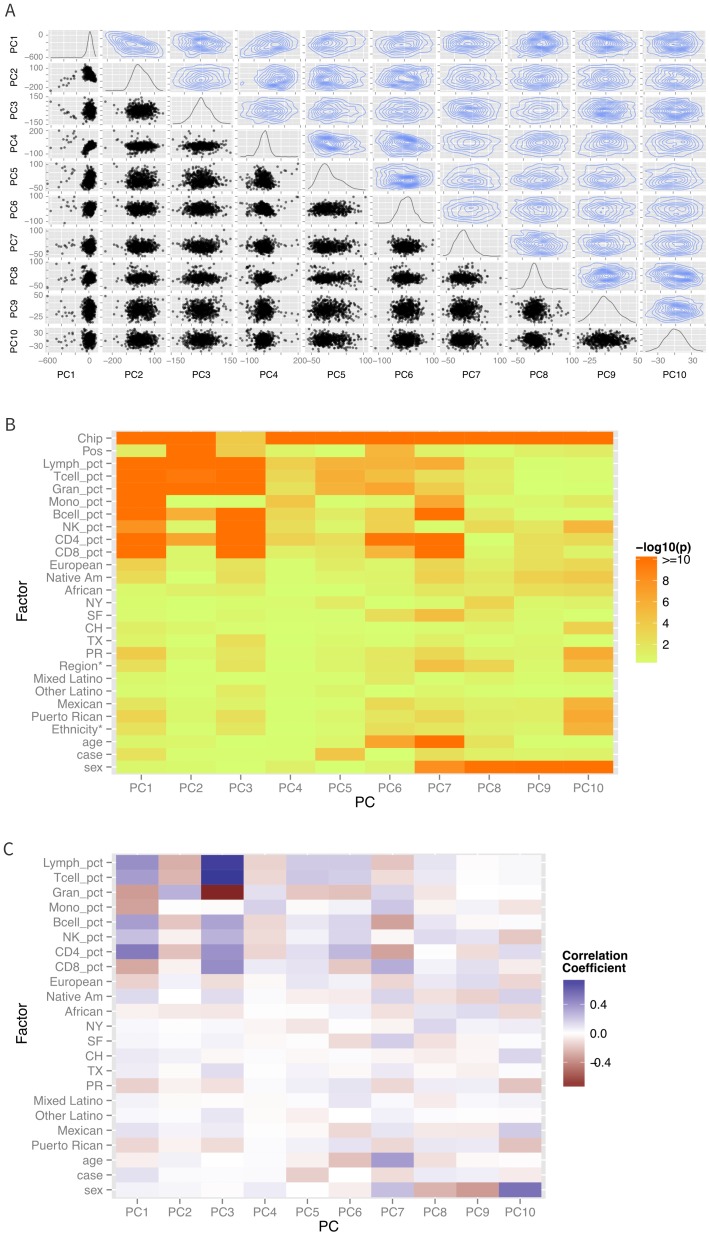
Figure 2. Patterns of global methylation.
(A) Distribution of the first 10 principal coordinates of the methylation data. Plots in the diagonal show the univariate distribution; those in the lower left triangle show bivariate relationship between each pair of PCs, while those in the upper right show the bivariate density. (B) Bivariate or ANOVA associations between principal coordinates and technical factors (chip, position), cell counts, genetic ancestry (European, Native American, African), recruitment site (New York, NY, San Francisco, CA, Chicago, IL, Houston, TX, and Puerto Rico), demographic factors (ethnicity, age, sex), and case status. (C) Correlation coefficients between the various factors and principal coordinates.

