

Abstract
A proteomic approach was used to analyze protein changes during nitrogen mobilization (N mobilization) from leaves to filling seeds in pea (Pisum sativum). First, proteome reference maps were established for mature leaves and stems. They displayed around 190 Coomassie Blue-stained spots with pIs from 4 to 7. A total of 130 spots were identified by mass spectrometry as corresponding to 80 different proteins implicated in a variety of cellular functions. Although the leaf proteome map contained more abundant spots, corresponding to proteins involved in energy/carbon metabolism, than the stem map, their comparison revealed a highly similar protein profile. Second, the leaf proteome map was used to analyze quantitative variations in leaf proteins during N mobilization. Forty percent of the spots showed significant changes in their relative abundance in the total protein extract. The results confirmed the importance of Rubisco as a source of mobilizable nitrogen, and suggested that in pea leaves the rate of degradation of Rubisco may vary throughout N mobilization. Correlated with the loss of Rubisco was an increase in relative abundance of chloroplastic protease regulatory subunits. Concomitantly, the relative abundance of some proteins related to the photosynthetic apparatus (Rubisco activase, Rubisco-binding proteins) and of several chaperones increased. A role for these proteins in the maintenance of a Rubisco activation state and in the PSII repair during the intense proteolytic activity within the chloroplasts was proposed. Finally, two 14-3-3-like proteins, with a potential regulatory role, displayed differential expression patterns during the massive remobilization of nitrogen.
During seed filling, the accumulation of proteins in the seeds relies on the nitrogen supply from the mother plant. In legumes, this nitrogen can come from two sources: (1) exogenous nitrogen assimilated from the soil nitrogen and/or fixed by the symbiotic fixation of atmospheric nitrogen, and (2) nitrogen mobilized from vegetative parts. De novo-fixed nitrogen generally cannot alone sustain the high-nitrogen demand of developing seeds (Sinclair and de Wit, 1976; Salon et al., 2001). Endogenous nitrogen accumulated during the vegetative period contributes from 20% to 70% of the final nitrogen seed yield (Pate, 1985; Jensen, 1987). In seeds, nitrogen mainly originates from leaves and stems that mobilize more than 65% of their nitrogen content (Peoples and Dalling, 1988). Rubisco, which represents about 50% of the total protein content in leaves, is thought to be a major source of nitrogen for mobilization (Peoples and Dalling, 1988; Matile, 1992). In monocarpic species, such as pea, nitrogen mobilization (N mobilization) for seed filling is closely linked to the senescence of vegetative parts. Senescence is associated with a decrease in protein and chlorophyll content, followed by leaf yellowing. It is the ultimate leaf developmental phase during which the coordinate degradation of cell constituents allows their reallocation to the plant sinks (Feller and Fisher, 1994; Masclaux et al., 2000) and eventually leads to leaf death. Nitrogen metabolism and mobilization have been extensively studied during senescence (for reviews, see Peoples and Dalling, 1988; Feller and Fisher, 1994; Noodèn et al., 1997; Hörtensteiner and Feller, 2002), and expression of selected genes has been documented (for reviews, see Smart, 1994; Buchanan-Wollaston, 1997; Buchanan-Wollaston and Ainsworth, 1997; Bhalerao et al., 2003; Buchanan-Wollaston et al., 2003; Yoshida, 2003). However, although there are extensive physiological and biochemical data on leaf senescence, few of the molecular events that are involved with the process have been elucidated, in particular during early senescence.
Proteomics is the most promising technique to identify the proteins that are induced, repressed, or post-transcriptionally modified during a developmental process as complex as senescence. Two-dimensional protein electrophoresis (2-DE) permits the resolution of hundreds of proteins simultaneously. Combined with image analysis and mass spectrometry (MS), it provides quantitative information about changes in protein levels and allows rapid and reliable protein identification. Nowadays, proteomics is widely used in plant studies for understanding physiological and biological mechanisms as diverse as water stress (Riccardi et al., 1998; Salekdeh et al., 2002), seed germination (Gallardo et al., 2001), seed development (Gallardo et al., 2003), senescence (Wilson et al., 2002), effect of dark or wounding (Komatsu et al., 1999; Shen et al., 2003), and role of key signaling molecules (Rakwal and Komatsu, 2000). Several proteome databases have been developed in Medicago truncatula (Mathesius et al., 2001; Watson et al., 2003), in rice (Koller et al., 2002; Shen et al., 2002), and in maize (Porubleva et al., 2001), and proteomes of subcellular compartments have been investigated (Kruft et al., 2001, Millar et al., 2001; Bardel et al., 2002). For example, in pea (Pisum sativum), the proteome of thylakoids (Peltier et al., 2000, 2002), mitochondria (Bardel et al., 2002), and the peribacteroid space and membrane from symbiosomes (Saalbach et al., 2002) were analyzed.
In the present study, a proteomic approach was used to study the mobilization of proteins from the leaves to the filling seeds in pea, an agriculturally important grain legume crop. Proteome maps of mature leaves and stems (pI 4–7), representing the identity of 130 proteins, were established. The leaf proteome was then analyzed at different stages during seed filling to identify mobilization-related changes in leaf proteins. This proteomic study of leaf N mobilization during early senescence in pea constitutes an original contribution to the understanding of this physiological process.
RESULTS
Characterization of the Mobilization Process in Pea Leaves during Seed Filling
The phases of seed development were divided into three distinct phases according to dry matter accumulation and water content (Fig. 1; Ney et al., 1993). The embryogenesis phase, during which frequent cell divisions occur, was characterized by a low accumulation of dry matter and a high water content (>85%). The seed-filling phase, characterized by the accumulation of dry matter in the seeds, began around 10 d after pollination (DAP) and ended around 24 DAP. During this period, the seed water content varied from 80% to 55%, and the seed dry weight increased from 0.03 to 0.22g. The desiccation phase, characterized by a loss of water and the arrest of dry matter accumulation, started at 24 DAP concomitantly with leaf yellowing. The seed water content dropped to 15%.
Figure 1.

N mobilization in vegetative nodes during pea seed development. Nitrogen content (%) in vegetative nodes 7 and 8 (nodes below the first flowering node) is represented on the left axis, dry weight (g) and water content (×100%) in the whole seeds are represented on the right axis. For the vegetative tissues, DAP corresponded to the DAP on the second flowering node. The seed-filling phase started at about 10 DAP and ended at about 24 DAP. Leaf yellowing started at 24 DAP. A, Phases of seed development. B, Stages associated with leaf senescence/break down of the vegetative nodes.
Concomitantly to seed nitrogen accumulation, the nitrogen content of leaves and stems of the seventh and eighth vegetative nodes decreased from 2.5% at 10 DAP to 1.6% at 19 DAP (Fig. 1). Three different stages were defined according to nitrogen content of leaves and stems: leaf maturity, early senescence associated with N mobilization, and late senescence associated with the leaf breakdown. Proteolytic activity was determined in leaf tissue at three different time points corresponding to before N mobilization (6 DAP), early N mobilization (10 DAP), and late N mobilization (18 DAP). Protease activity increased at the beginning of N mobilization, between 6 (A450 0.691 ± 0.019) and 10 DAP (A450 0.754 ± 0.020), and decreased afterward at 18 DAP (A450 0.694 ± 0.025). The 2-DE gels for which a constant fresh weight was loaded showed that most of the abundant protein spots displayed a decreasing level in leaves during this period (Fig. 2). These results confirmed the massive N mobilization from vegetative tissues that happened at the beginning of the seed filling in order to sustain their high-nitrogen demand.
Figure 2.

Two-dimensional protein patterns of leaves obtained from a constant fresh-tissue load. An equal volume of 80 μL corresponding to 240 mg of fresh weight of leaves harvested at 4, 12, and 24 DAP of the second flowering node was loaded on linear 24-cm IPG strips (pH 4–7). Gels were Coomassie Blue stained. The figure shows representative experiments carried out at three times. A, Enlarged image of massive degradation of rbcL between 4 and 24 DAP. B, Enlarged image represents some less abundant protein spots (labeled by arrows) with constant levels between 4 and 24 DAP.
Proteome Maps of Mature Pea Leaves and Stems
An average of 375 spots was detected on Coomassie Blue-stained 2-DE gels (pH 4–7). Reference maps were established from pea leaves and stems. They integrated the most reproducible 191 spots (Fig. 3), ranging in size from 15 to 90 kD and pI 4 to 7. One hundred eighty-four spots were submitted to MS analyses. The matrix-assisted laser-desorption ionization time of flight (MALDI-TOF) analyses of 129 spots provided peptide mass fingerprint data that allowed the identification of 80 of them and the liquid chromatography-tandem mass spectrometry (LC-MS/MS) analysis of 66 spots allowed the identification of 61 of them. Four spots (4, 60, 73, and 96) were analyzed both by MALDI-TOF and LC-MS/MS, and their identification was validated. Six spots (5, 20, 40, 51, 63, and 81), excised at similar Mr, and pI in leaf and stem 2-DE gels, were analyzed by MS. They were all identified as the same protein. The 130 spots characterized by different Mr and/or pI were identified as 80 different proteins. The different spots identified as the same protein could correspond either to post-translational modifications of the same protein or to different isoforms.
Figure 3.

Two-dimensional reference maps obtained from mature pea leaves (A) and stems (B) at 4 DAP of the second flowering node. Two-dimensional gels were performed from 200 μg of proteins using 24-cm IPG strips (linear pH 4–7) and Coomassie Blue stained. Two examples of protein profile similarities are shown in enlarged images in (C), (a), and (b) from both leaf and stem proteome maps. The figure shows representative experiments carried out five times. The labeled proteins are listed in Table I.
We classified the identified proteins according to their function in the categories described by Bevan et al. (1998; Table I; Fig. 4). For the sake of clarity, the energy category, which included the majority of spots, has been divided into four subcategories: the pentose phosphate pathway, the glycolysis pathway/glyoxylate cycle/gluconeogenesis, electron transport, and photosynthesis. Identified spots in leaves represented 91% of the volume of all detected spots and 86% in stems (Fig. 5). Most of the identified proteins (75% in leaves and 62% in stems) were involved in energy metabolism. The most abundant proteins were included in this category. For example, spots identified as Rubisco large subunits (rbcL) represented, at 4 DAP, 30% to 36% of the total normalized volume of detected spots. In leaves and stems, these polypeptides formed an abundant train of spots at the basic edge of the gel, between pH 6 and 7, at approximately 50 kD (Fig. 3). Ten other spots were identified as rbcL. These spots displayed various molecular masses (from 15–82 kD) and pIs (from 4.3–7). Smaller polypeptides identified as rbcL might correspond to degradation products. The spot at 82 kD was less abundant: contamination with Rubisco holoenzyme might explain this identification since Rubisco is the most abundant protein in the profile. Two Rubisco small subunits of approximately 13 kD were identified. Other abundant spots were identified as Rubisco activase (five spots, 4.7% of total spot volume in leaves), PSII oxygen-evolving subunits 1 (four spots) and 2 (four spots; 11.6%), and as proteins involved in ATP metabolism (5.2% of total spot volume in leaves, three spots from mitochondria, five spots from chloroplasts, one spot from vacuoles, and one from an undetermined location). Proteins involved in carbon fixation, such as transketolase (two and three spots in leaves and stems, respectively), phosphoribulokinase, aldolase (eight spots in leaves corresponding to different isoforms or post-translational modifications), triosephosphate isomerase, glyceraldehyde-3-phosphate dehydrogenase, and phosphoglycerate kinase, contributed to 9.5% of the total volume of detected spots in leaves.
Table I.
Proteins identified in pea leaf and stem tissues by MALDI-TOF and LC-MS/MS and their relative abundance variations between stages
| Spot Name | Expe. pl/Mr | Theo. Pl/Mr | No. Match Pep. | % Seq. Cov. | Similar Protein | Organism Gi Accession No. | Vol. Leaf Stem | SNK Test | Spot Volume Variations 4-12-19 DAP |
|---|---|---|---|---|---|---|---|---|---|
| Energy/Pentose Phosphate | |||||||||
| 77 (L) | 6.5/25 | 6.6/53 | 6 | 13 | Ribulose-bisphosphate carboxylase large chain precursor | Pisum sativum | 17.7 | ||
| 132009 | 6.7 | ||||||||
| 82 (L) | 5.1/23 | 6.6/53 | 6 | 11 | Ribulose-bisphosphate carboxylase large chain precursor | Pisum sativum | 1.1 | B B A |  |
| 132009 | - | ||||||||
| 83 (L) | 5.4/23 | 6.6/53 | 7 | 15 | Ribulose-bisphosphate carboxylase large chain precursor | Pisum sativum | 32.1 | A A A |  |
| 132009 | 10.9 | ||||||||
| 84 (L) | 5.5/20 | 5.6/28 | 5 | 18 | Ribulose-1,5-bisphosphate carboxylase / oxygenase | Vittaria appalachiana | 3.3 | ||
| 1881646 | 1.9 | ||||||||
| 87 (L) | 5.2/19 | 5.6/28 | 5 | 18 | Ribulose-1,5-bisphosphate carboxylase / oxygenase | Vittaria appalachiana | 1.3 | B B A |  |
| 1881646 | 1.2 | ||||||||
| 93 (S) | 5.1/15 | 6.5/53 | 9 | 18 | Ribulose-bisphosphate carboxylase large chain | Pisum sativum | 11.8 | ||
| 132009 | 1.9 | ||||||||
| 98 (L) | 5.1/22 | 6.6/53 | 5 | 9 | Ribulose bisphosphate carboxylase large chain precursor | Pisum sativum | 3.8 | B A A |  |
| 132009 | 1.0 | ||||||||
| 110 (S) | 6.2/82 | 6.5/53 | 15 | 27 | Ribulose-1,5-bisphosphate carboxylase large subunit | Pisum sativum | 0.3 | ||
| 132009 | 0.3 | ||||||||
| 111 (L) | 6.8/53 | 6.5/53 | 18 | 30 | Ribulose-bisphosphate carboxylase large chain precursor | Pisum sativum | 384.1 | B B A |  |
| 132009 | 184.4 | ||||||||
| (L) | 6.8/53 | 6.6/53 | 8 | 15 | Ribulose bisphosphate carboxylase large chain precursor | Pisum sativum | |||
| 132009 | |||||||||
| 112 (S) | 6.0/66 | 6.5/53 | 18 | 30 | Ribulose-bisphosphate carboxylase large chain | Pisum sativum | 0.3 | ||
| 132009 | 0.9 | ||||||||
| 122 (L) | 4.3/52 | 6.2/52 | 8 | 18 | Rubisco Large Subunit | Perovskia abrotanoides | 1.8 | B A B |  |
| 671595 | 2.8 | ||||||||
| 200 (L) | 6.2/13 | 7.9/16 | 5 | 47 | Rubisco Small Subunit | Pisum sativum | 22.1 | B A C |  |
| 12019640 | - | ||||||||
| 202 (L) | 6.7/13 | 7.9/16 | 5 | 43 | Rubisco Small Subunit | Pisum sativum | 51.7 | B A B |  |
| 12019640 | - | ||||||||
| 44 (L) | 5.1/41 | 5.0/26 | 7 | 34 | Ribulose bisphosphate carboxylase activase | Nicotiana tabacum | 6.7 | A A A |  |
| 100380 | 1.1 | ||||||||
| 46 (L) | 5.4/41 | 5.0/26 | 7 | 34 | Ribulose bisphosphate carboxylase activase | Nicotiana tabacum | 43.3 | B B A |  |
| 100380 | 22.4 | ||||||||
| (S) | 5.4/41 | 8.2/48 | 8 | 32 | Ribulose bisphosphate carboxylase activase | Malus x domestica | |||
| 541930 | |||||||||
| 69 (S) | 5.7/29 | 5.5/48 | 4 | 13 | Rubisco activase | Zantedeschia aethiopica | 1.2 | ||
| 13430332 | 0.5 | ||||||||
| 106 (L) | 5.3/42 | 5.0/26 | 7 | 34 | Ribulose-bisphosphate carboxylase activase | Nicotiana tabacum | 6.5 | ||
| 100380 | 4.1 | ||||||||
| 150 (L) | 5.5/41 | 5.5/48 | 37 | Rubisco 1,5 bisphosphate activase | Gossypium hirsutum | 2.3 | C B A |  |
|
| 12620881 | 2.0 | ||||||||
| 3 (S) | 6.1/81 | 5.7/67 | 5 | 9 | Transketolase | Polygonum tinctorium | 2.6 | ||
| 14787119 | 1.4 | ||||||||
| 4 (S) | 6.2/81 | 6.1/81 | 19 | 30 | Transketolase-like protein | Arabidopsis thaliana | 3.6 | ||
| 11257215 | 3.8 | ||||||||
| (S) | 6.2/81 | 5.7/67 | 6 | 9 | Transketolase | Polygonum tinctorium | |||
| 14787119 | |||||||||
| 5 (L) | 6.0/81 | 6.2/80 | 4 | 7 | Transketolase precursor | Spinacia oleracea | 2.0 | ||
| 7433621 | 0.9 | ||||||||
| (S) | 6.0/81 | 6.2/80 | 5 | 8 | Transketolase precursor chloroplast | Spinacia oleracea | |||
| 7433621 | |||||||||
| 88 (L) | 5.8/17 | 6.2/80 | 2 | 4 | Transketolase precursor chloroplast | Spinacia olera | 14.4 | AB A B |  |
| 7433621 | 5.0 | ||||||||
| 47 (L) | 5.5/41 | 5.4/39 | 8 | 26 | Phosphoribulokinase | Pisum sativum | 12.7 | ||
| 7434255 | 7.1 | ||||||||
| Energy/Glycolysis/Glyoxylate Cycle/Gluconeogensis | |||||||||
| 54 (S) | 6.2/39 | 5.5/38 | 8 | 26 | Aldolase | Pisum sativum | 3.0 | A A A |  |
| 169039 | 4.8 | ||||||||
| 56 (L) | 5.8/38 | 5.5/38 | 18 | 56 | Fructose-bisphosphate aldolase 2, chloroplast | Pisum sativum | 9.7 | A A A |  |
| 461501 | 2.6 | ||||||||
| 57 (L) | 6.1/38 | 5.5/38 | 18 | 56 | Fructose-bisphosphate aldolase 2, chloroplast | Pisum sativum | 41.4 | B A B |  |
| 461501 | 28.1 | ||||||||
| 58 (L) | 6.0/38 | 5.5/38 | 7 | 27 | Aldolase | Pisum sativum | 5.6 | A B C |  |
| 169039 | 1.7 | ||||||||
| 117 (L) | 6.5/40 | 6.4/38 | 9 | 40 | Fructose-bisphosphate aldolase cytoplasmic isoenzyme 1 | Pisum sativum | 0.9 | A A B |  |
| 1168408 | 0.9 | ||||||||
| 139 (L) | 6.6/39 | 5.5/38 | 3 | 9 | Fructose bisphosphate aldolase 2, chloroplast | Pisum sativum | 2.2 | A B B |  |
| 461501 | 1.2 | ||||||||
| 148 (L) | 5.6/39 | 5.5/38 | 6 | 20 | Fructose-bisphosphate aldolase 2, chloroplast | Pisum sativum | 1.2 | B A A |  |
| 461501 | - | ||||||||
| 176 (L) | 4.9/28 | 5.5/38 | 5 | 20 | Fructose-bisphosphate aldolase 2, chloroplast | Pisum sativum | 3.4 | B B A |  |
| 461501 | - | ||||||||
| 71 (S) | 5.5/27 | 5.5/27 | 8 | 21 | Triosephosphate isomerase cytosolic | Coptis japonica | 3.3 | ||
| 136057 | 1.5 | ||||||||
| 74 (S) | 5.2/26 | 7.7/33 | 3 | 14 | Triosephosphate isomerase chloroplast precursor | Arabidopsis thaliana | 5.0 | B A A |  |
| 13431953 | 1.9 | ||||||||
| 41 (L) | 6.6/44 | 7.6/48 | 11 | 25 | Glyceraldehyde-3-phosphate dehydrogenase (NADP+) phosphorylating B precursor | Pisum sativum | 4.6 | ||
| 120663 | 1.9 | ||||||||
| 116 (L) | 6.5/39 | 8.8/43 | 2 | 6 | Glyceraldehyde 3-phosphatedehydrogenase A, chloroplast precursor | Pisum sativum | 1.4 | A A A |  |
| 120658 | 1.7 | ||||||||
| 138 (L) | 6.6/39 | 6.2/33 | 4 | 12 | Glyceraldehyde 3-phosphate dehydrogenase cytosolic | Hordeum vulgare | 1.3 | B A B |  |
| 120668 | 2.7 | ||||||||
| 32 (S) | 5.5/51 | 5.1/48 | 10 | 24 | Enolase | Lupinus luteus | 1.6 | B A A |  |
| 6996529 | 4.6 | ||||||||
| 28 (S) | 5.7/53 | 5.7/53 | 4 | 9 | UDP-glucose 6-dehydrogenase | Glycine max | 1.9 | ||
| 6136119 | 0.8 | ||||||||
| 105 (S) | 5.3/51 | 5.9/52 | 11 | 23 | UDP-glucose pyrophosphorylase | Astragalus Membranaceus | 2.0 | ||
| 9280626 | 1.5 | ||||||||
| 55 (S) | 5.1/39 | 5.3/55 | 3 | 13 | Putative fructokinase | Arabidopsis thaliana | 7.6 | B A A |  |
| 4589962 | 15.4 | ||||||||
| 43 (L) | 5.5/42 | 7.7/50 | 8 | 19 | Phosphoglycerate kinase chloroplast precursor | Solanum tuberosum | 2.9 | ||
| 7434544 | 2.7 | ||||||||
| 10 (S) | 5.8/64 | 5.4/61 | 12 | 19 | Phosphoglyceromutase | Mesembryanthemum crystallinum | 0.6 | ||
| 602426 | 1.4 | ||||||||
| 11 (S) | 5.9/64 | 5.4/61 | 14 | 21 | Phosphoglyceromutase | Mesembryanthemum crystallinum | 0.4 | ||
| 602426 | 0.3 | ||||||||
| 115 (L) | 6.4/40 | 6.4/36 | 4 | 11 | Malate dehydrogenase cytoplasmic | Medicago sativa | 1.7 | B A B |  |
| 11133373 | 0.8 | ||||||||
| Energy/Electron Transport | |||||||||
| 19 (S) | 6.4/55 | 5.8/55 | 20 | 41 | ATP synthase alpha chain, chloroplastic | Pisum sativum | 3.6 | ||
| 67826 | 2.8 | ||||||||
| 20 (L) | 6.1/54 | 5.8/55 | 18 | 36 | H+ transporting two-sector ATPase alpha chain, chloroplastic | Pisum sativum | 10.6 | ||
| 67826 | 5.6 | ||||||||
| (S) | 6.1/54 | 5.8/55 | 18 | 35 | H+ transporting two-sector ATPase, alpha chain, chloroplastic | Pisum sativum | |||
| 67826 | |||||||||
| 30 (L) | 5.1/52 | 5.1/53 | 12 | 32 | H+ transporting ATP synthase beta chain, chloroplastic | Pisum sativum | 14.9 | A A A |  |
| 81961 | 3.9 | ||||||||
| 31 (L) | 5.2/51 | 5.1/53 | 17 | 51 | H+ transporting ATP synthase beta chain, chloroplastic | Pisum sativum | 24.8 | ||
| 81961 | 7.7 | ||||||||
| 67 (L) | 4.5/29 | 5.2/51 | 8 | 27 | ATPase beta chain, plastidial | Triglochin maritimum | 1.5 | ||
| 6467935 | - | ||||||||
| 21 (S) | 4.8/54 | 5.0/54 | 14 | 34 | H+ transporting ATP synthase 54K chain, alpha chain homology | Arabidopsis thaliana | 1.2 | ||
| 7436120 | 1.8 | ||||||||
| 17 (S) | 6.7/56 | 6.0/55 | 20 | 41 | H+ transporting ATP synthase, alpha chain mitochondrion | Pisum sativum | 2.7 | B A B |  |
| 541972 | 2.1 | ||||||||
| 36 (S) | 5.4/49 | 6.0/59 | 11 | 21 | ATP synthase beta subunit, mitochondrial precursor | Zea mays | 0.8 | B AB A |  |
| 22172 | 0.8 | ||||||||
| 22 (L) | 5.2/54 | 6.6/60 | 10 | 23 | Probable H+ transporting ATP synthase beta chain mitochondrial | Pisum sativum | 4.8 | B C A |  |
| 7436097 | 6.1 | ||||||||
| 102 (S) | 5.4/70 | 5.3/69 | 14 | 25 | H+ ATP synthase catalytic subunit vacuolar A | Citrus unshiu | 0.3 | B B A |  |
| 12585490 | 1.5 | ||||||||
| Energy/Photosynthesis | |||||||||
| 89 (L) | 5.8/17 | 9.7/15 | 3 | 23 | Photosystem I reaction center subunit IV B precursor | Nicotinia sylvestris | 21.5 | A A A |  |
| 2499967 | 8.3 | ||||||||
| 64 (S) | 5.3/31 | 6.3/35 | 9 | 34 | Oxygen-evolving enhancer 1 protein chloroplast 33 kDa subunit | Pisum sativum | 6.9 | ||
| 81934 | 1.9 | ||||||||
| 177 (L) | 4.8/31 | 6.3/35 | 4 | 16 | Oxygen-evolving enhancer protein 1 chloroplast precursor | Pisum sativum | 4.8 | A AB B |  |
| 131384 | - | ||||||||
| 62 (L) | 5.0/31 | 6.3/35 | 10 | 44 | Photosystem II oxygen-evolving complex protein 1 precursor | Pisum sativum | 9.6 | B A A |  |
| 81934 | 1.2 | ||||||||
| 63 (L) | 5.1/31 | 6.3/35 | 12 | 47 | Photosystem II oxygen-evolving complex protein 1 precursor | Pisum sativum | 54.3 | B A A |  |
| 81934 | 23.4 | ||||||||
| (S) | 5.1/31 | 6.2/35 | 13 | 56 | Photosystem II oxygen-evolving complex protein 1 precursor | Pisum sativum | |||
| 81934 | |||||||||
| 80 (L) | 5.3/23 | 8.3/28 | 7 | 33 | Photosystem II oxygen-evolving complex protein 2 precursor | Pisum sativum | 6.1 | A A A |  |
| 280396 | - | ||||||||
| 81 (L) | 5.8/23 | 8.3/28 | 13 | 55 | Photosystem II oxygen-evolving complex protein 2 precursor | Pisum sativum | 36.4 | ||
| 280396 | 23.9 | ||||||||
| (S) | 5.8/23 | 8.3/28 | 6 | 38 | Photosystem II oxygen-evolving complex protein 2 precursor | Pisum sativum | |||
| 280396 | |||||||||
| 85 (L) | 5.8/23 | 8.3/28 | 7 | 33 | Oxygen-evolving enhancer protein 2 chloroplast precursor | Pisum sativum | 4.6 | ||
| 131390 | 1.8 | ||||||||
| 183 (L) | 5.1/24 | 8.3/28 | 5 | 25 | Oxygen-evolving enhancer protein 2, chloroplast precursor | Pisum sativum | 2.8 | A B B |  |
| 131390 | - | ||||||||
| 99 (L) | 5.6/26 | 6.6/35 | 10 | 28 | Ferredoxin nadp+ reductase chain A | Pisum sativum | 0.6 | ||
| 4930123 | 0.2 | ||||||||
| 76 (L) | 6.2/25 | 8.8/30 | 7 | 31 | Probable chlorophyll a/b binding protein type III precursor | Pisum sativum | 4.4 | A A A |  |
| 7443229 | 2.3 | ||||||||
| 73 (S) | 5.0/26 | 5.5/29 | 3 | 11 | Chlorophyll a/b binding protein (chloroplast precursor) | Pisum sativum | 6.8 | ||
| 115788 | 11.0 | ||||||||
| (S) | 5.0/26 | 5.2/29 | 4 | 8 | Chlorophyll a/b binding protein 8 chloroplast precursor (LHCII type I CAB-8) | Pisum sativum | |||
| 115814 | |||||||||
| Nitrogen Metabolism | |||||||||
| 14 (S) | 6.0/59 | 6.0/58 | 5 | 6 | Putative dihydropyrimidinase | Oryza sativa | 3.8 | ||
| 13872973 | 6.6 | ||||||||
| 16 (S) | 5.4/56 | 5.5/55 | 9 | 27 | Putative aminoaldehyde dehydrogenase | Pisum sativum | 0.4 | ||
| 15131692 | 0.5 | ||||||||
| 33 (S) | 6.2/51 | 6.3/56 | 9 | 18 | Putative glutamate decarboxylase | Arabidopsis thaliana | 0.6 | ||
| 26451300 | 4.6 | ||||||||
| 34 (S) | 5.6/50 | 5.2/37 | 2 | 14 | cDNA similar to arginosuccinate synthase-like protein | Glycine max | 0.8 | ||
| 10236563 | 0.1 | ||||||||
| 37 (S) | 5.7/47 | 6.6/39 | 5 | 15 | Methionine adenosyltransferase | Pisum sativum | 0.4 | ||
| 7434001 | 2.4 | ||||||||
| 42 (S) | 6.2/43 | 5.5/43 | 4 | 15 | Methionine adenosyltransferase | Arabidopsis thaliana | 1.1 | ||
| 166872 | 0.5 | ||||||||
| 45 (S) | 5.2/41 | 5.3/41 | 12 | 26 | Glutamine synthetase | Pisum sativum | 17.0 | ||
| 829285 | 4.7 | ||||||||
| 48 (L) | 6.2/40 | 6.1/39 | 10 | 33 | Glutamate ammonia ligase alpha cytosolic | Pisum sativum | 7.1 | A A A |  |
| 121333 | 6.6 | ||||||||
| 51 (L) | 5.5/39 | 5.4/39 | 9 | 42 | Glutamate ammonia ligase beta cytosolic | Pisum sativum | 4.4 | ||
| 68588 | 4.7 | ||||||||
| (S) | 5.5/39 | 5.4/39 | 11 | 43 | Glutamate ammonia ligase beta cytosolic | Pisum sativum | |||
| 68588 | |||||||||
| 90 (L) | 5.7/16 | 8.5/26 | 3 | 15 | Nucleoside-diphosphate kinase II precursor | Pisum sativum | 23.0 | A AB B |  |
| 1346673 | 3.6 | ||||||||
| 94 (S) | 6.8/120 | 7.2/115 | 6 | 6 | Glycine dehydrogenase (decarboxylating) component P precursor | Pisum sativum | 0.5 | B B A |  |
| 282926 | 0.4 | ||||||||
| 95 (S) | 6.6/90 | 6.1/85 | 2 | 3 | Putative methionine synthase | Arabidopsis thaliana | 0.6 | ||
| 14532772 | 0.7 | ||||||||
| 96 (S) | 6.5/89 | 5.9/85 | 9 | 11 | 5 methyl tetrahydropteroyltriglutamate homocysteine S-methyltransferase | Mesembryanthemum crystallinum | 0.3 | ||
| 7433427 | 2.1 | ||||||||
| (S) | 6.5/89 | 6.1/85 | 3 | 6 | Putative methionine synthase | Arabidopsis thaliana | |||
| 14532772 | |||||||||
| Protein Destination and Storage | |||||||||
| 218 (L) | 4.6/74 | 5.2/75 | 12 | 20 | Heat shock protein HSP70 | Pisum sativum | 1.4 | B B A | 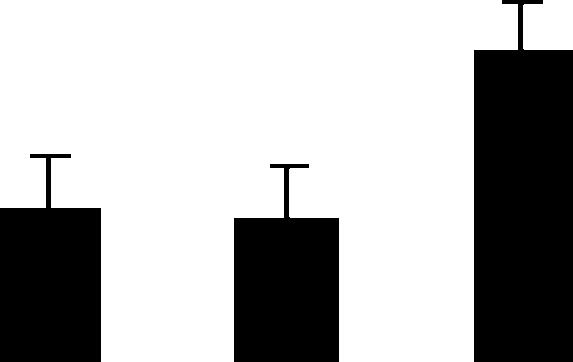 |
| 445605 | 0.6 | ||||||||
| 219 (L) | 4.6/74 | 5.2/75 | 6 | 11 | Heat shock protein HSP70 | Pisum sativum | 2.8 | B B A |  |
| 445605 | 1.4 | ||||||||
| 6 (L) | 4.6/73 | 5.2/75 | 20 | 30 | Stromal 70 kDa heat shock-related protein, chloroplast precursor | Pisum sativum | 5.3 | ||
| 399942 | 4.4 | ||||||||
| 7 (S) | 5.0/73 | 5.1/74 | 12 | 20 | Dnak-type molecular chaperone blp5 precursor | Nicotiana tabacum | 2.5 | ||
| 100340 | 6.7 | ||||||||
| 126 (L) | 5.3/69 | 5.8/72 | 11 | 18 | Dnak-type molecular chaperone PHSP1 precursor, mitochondrial | Pisum sativum | 0.3 | B AB A |  |
| 7441844 | 0.7 | ||||||||
| 127 (L) | 5.3/69 | 5.8/72 | 5 | 8 | Dnak-type molecular chaperone PHSP1 precursor, mitochondrial | Pisum sativum | 0.6 | B A A |  |
| 7441844 | 0.8 | ||||||||
| 15 (S) | 4.7/58 | 5.1/62 | 24 | 54 | Chaperonin 60 alpha chain precursor | Pisum sativum | 3.4 | ||
| 7443854 | 4.7 | ||||||||
| 12 (S) | 5.5/60 | 6.3/61 | 9 | 19 | Chaperonin cpn60-2 mitonchondrial precursor (HSP60-2) | Cucurbita maxima | 0.7 | ||
| 461736 | 1.5 | ||||||||
| 119 (L) | 4.6/58 | 5.2/62 | 14 | 29 | Rubisco binding-protein beta subunit, chloroplast precursor | Pisum sativum | 1.3 | B B A |  |
| 1710807 | 1.5 | ||||||||
| 13 (S) | 5.4/60 | 5.8/63 | 10 | 22 | Rubisco subunit binding protein beta subunit chloroplast precursor (60 kDa chaperonin beta subunit) | Pisum sativum | 2.5 | AB B A |  |
| 2506277 | 2.8 | ||||||||
| 132 (L) | 5.3/60 | 5.9/63 | 5 | 10 | Rubisco binding-protein beta subunit, chloroplast precursor | Pisum sativum | 1.0 | B B A |  |
| 2506277 | 1.0 | ||||||||
| 97 (S) | 5.0/87 | 5.0/80 | 9 | 13 | Heat shock protein 90 | Arabidopsis thaliana | 0.2 | ||
| 15241102 | 0.2 | ||||||||
| 18 (S) | 6.3/56 | 6.6/59 | 10 | 15 | Mitochondrial processing peptidase beta subunit | Cucumis melo | 0.3 | ||
| 12802327 | 1.8 | ||||||||
| 9 (S) | 5.0/67 | 6.0/74 | 8 | 16 | Putative ftsH chloroplast protease | Arabidopsis thaliana | 0.3 | ||
| 3201633 | 0.4 | ||||||||
| 66 (L) | 4.4/30 | 6.1/51 | 2 | 6 | Cysteine proteinase | Pisum sativum | 2.8 | ||
| 100069 | 0.3 | ||||||||
| 35 (S) | 5.7/50 | 5.7/53 | 3 | 8 | Adenosylhomocysteinase | Medicago sativa | 1.2 | ||
| 1710838 | 0.4 | ||||||||
| 128 (L) | 5.6/100 | 6.6/103 | 7 | 8 | ATP-dependent clp binding subunit clpA homolog, chloroplast | Pisum sativum | 0.7 | B B A | 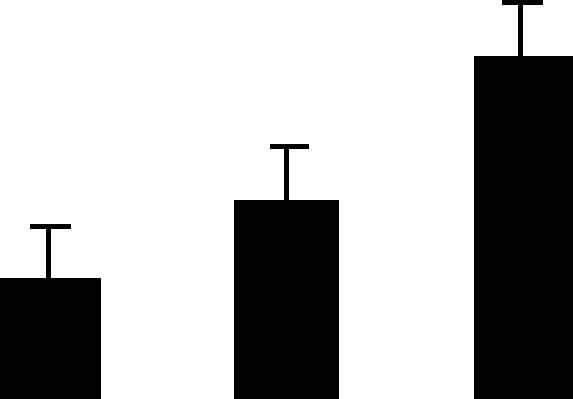 |
| 461753 | 1.1 | ||||||||
| 129 (L) | 5.5/100 | 6.3/103 | 9 | 12 | Endopeptidase Clp ATP-binding chain C, chloroplast | Arabidopsis thaliana | 0.7 | B AB A |  |
| 25289891 | 0.6 | ||||||||
| 164 (L) | 4.4/40 | 5.3/50 | 4 | 11 | Hypothetical protein similar to peptidyl-prolyl cis-trans isomerase, chloroplast precursor | Pisum sativum | 1.1 | B B A | 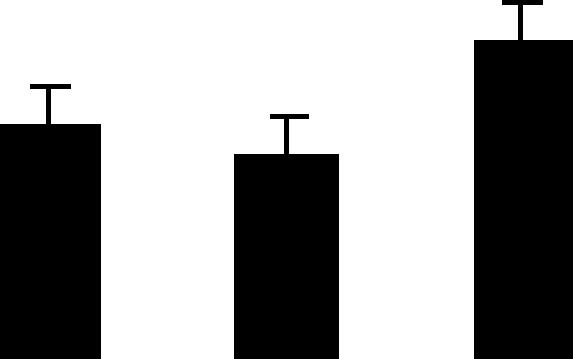 |
| 7488812 | - | ||||||||
| 165 (L) | 4.4/40 | 5.6/50 | 6 | 18 | Hypothetical protein similar to peptidyl-prolyl cis-trans isomerase, chloroplast precursor | Pisum sativum | 0.2 | C B A |  |
| 7488812 | - | ||||||||
| 103 (S) | 5.4/71 | 5.6/76 | 11 | 18 | Cell division protein ftsH homolog chloroplast precursor | Medicago sativa | 0.3 | B B A |  |
| 17865463 | 0.2 | ||||||||
| Plant Defence | |||||||||
| 72 (S) | 4.5/27 | 4.5/31 | 2 | 7 | Chitinase | Trifolium repens | 2.1 | B A A | 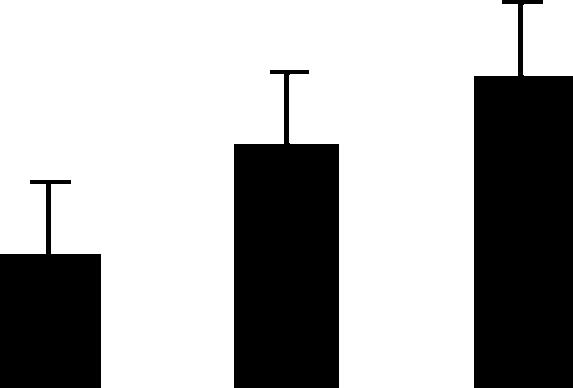 |
| 13560118 | 1.5 | ||||||||
| 70 (S) | 5.8/27 | 5.5/27 | 9 | 44 | L-ascorbate peroxidase cytosolic | Pisum sativum | 3.8 | ||
| 1351963 | 6.5 | ||||||||
| 75 (L) | 5.0/25 | 5.5/27 | 6 | 38 | L-ascorbate peroxidase cytosolic | Pisum sativum | 2.7 | ||
| 1420981 | - | ||||||||
| 79 (L) | 4.7/24 | 5.5/27 | 6 | 38 | L-ascorbate peroxidase cytosolic | Pisum sativum | 8.1 | ||
| 1420981 | 3.2 | ||||||||
| 91 (S) | 4.7/16 | 4.9/17 | 5 | 46 | Pathogenesis related protein 10 | Pisum sativum | 15.4 | B A B |  |
| 7442191 | 21.5 | ||||||||
| 92 (S) | 5.0/15 | 5.1/17 | 10 | 70 | ABA responsive protein ABR-17 | Pisum sativum | 8.3 | C A B |  |
| 1703042 | 12.0 | ||||||||
| 108 (S) | 5.4/16 | 5.9/21 | 2 | 18 | CuZn superoxide dismutase II precursor chloroplast | Pisum sativum | 11.0 | A A A | 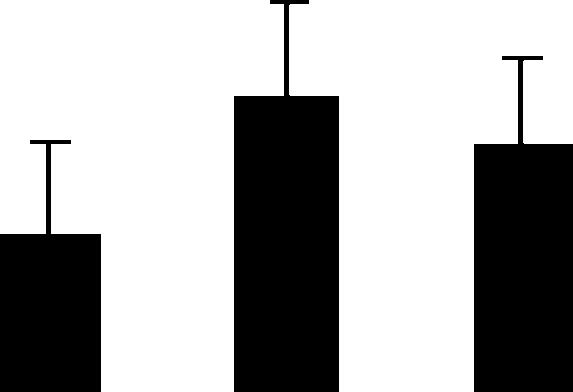 |
| 20900 | 1.3 | ||||||||
| Secondary Metabolism | |||||||||
| 38 (S) | 5.8/45 | 6.7/18 | 5 | 10 | 1-deoxy-D-xylulose-5-phosphate reductoisomerase | Forsythia x intermedia | 1.5 | ||
| 21435734 | 0.8 | ||||||||
| 60 (S) | 6.3/36 | 6.4/34 | 5 | 14 | Isoflavone reductase-like NAD(P)H dependent oxidoreductase | Medicago sativa | 2.3 | ||
| 6525021 | 18.7 | ||||||||
| (S) | 6.3/36 | 6.5/34 | 6 | 11 | Isoflavone reductase-like NAD(P)H-dependent oxidoreductase | Medicago sativa | |||
| 6525021 | |||||||||
| 68 (S) | 5.6/29 | 5.5/28 | 6 | 32 | Caffeoyl-CoA O-methyltransferase | Medicago sativa | 0.3 | ||
| 7448241 | 1.2 | ||||||||
| 78 (L) | 6.3/25 | 6.0/22 | 2 | 11 | 1.4-benzoquinone reductase-like | Arabidopsis thaliana | 3.4 | A A A | 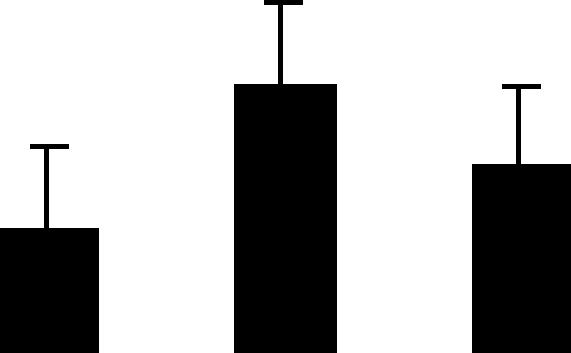 |
| 8885593 | 4.9 | ||||||||
| 191 (L) | 5.5/24 | 7/25 | 4 | 22 | Chalcone-flavonone isomerase | Pisum sativum | 1.7 | C B A |  |
| 729104 | 0.5 | ||||||||
| 220 (L) | 5.5/36 | 5.4/35 | 16 | 65 | 2′-hydroxyiso flavone reductase | Pisum sativum | 0.9 | ||
| 1708427 | 1.7 | ||||||||
| Protein Synthesis | |||||||||
| 40 (L) | 5.7/44 | 6.6/53 | 13 | 33 | Translation elongation factor EF-Tu chloroplast precursor | Pisum sativum | 3.8 | A B B | 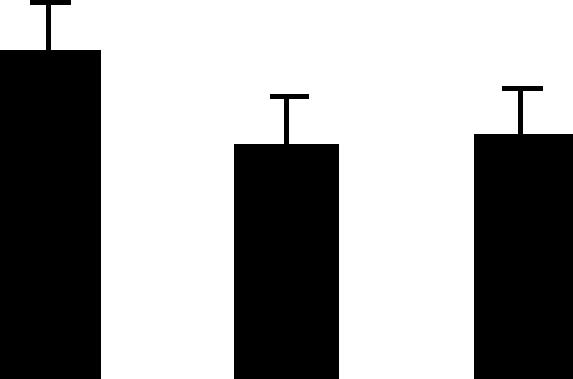 |
| 6015084 | 4.4 | ||||||||
| (S) | 5.7/44 | 6.6/53 | 10 | 27 | Translation elongation factor EF-Tu chloroplast precursor | Pisum sativum | |||
| 6015084 | |||||||||
| Transcription | |||||||||
| 169 (L) | 4.4/30 | 4.8/32 | 5 | 21 | RNA-binding protein | Pisum sativum | 2.7 | A B B |  |
| 7446357 | 0.3 | ||||||||
| 171 (L) | 4.4/30 | 4.7/32 | 2 | 5 | RNA-binding protein | Mesembryanthenum crystallium | 1.3 | B A B | 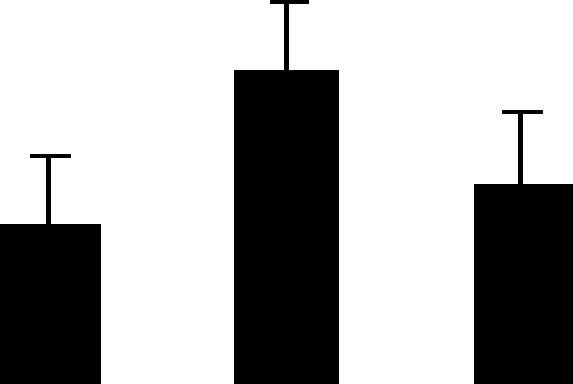 |
| 1076251 | 0.2 | ||||||||
| Growth and Division | |||||||||
| 39 (S) | 5.1/44 | 5.4/42 | 13 | 43 | Actin | Malva pusilla | 1.3 | B B A |  |
| 11276970 | 4.1 | ||||||||
| 154 (L) | 5.3/43 | 5.5/22 | 3 | 16 | Actin | Glycine max | 1.5 | B AB A |  |
| 1498342 | 3.4 | ||||||||
| 50 (L) | 4.1/39 | 4.6/38 | 10 | 24 | Plastoglobule associated protein PG1 precursor | Pisum sativum | 5.3 | ||
| 4105180 | 0.9 | ||||||||
| Miscellaneous | |||||||||
| 1 (S) | 4.5/102 | 4.9/55 | 4 | 9 | Hypothetical protein | Cicer arietinum | 0.1 | B BA |  |
| 8894548 | 0.3 | ||||||||
| 2 (S) | 4.5/98 | 4.9/55 | 5 | 13 | Hypothetical protein | Cicer arietinum | 0.1 | B A A |  |
| 8894548 | 0.3 | ||||||||
| 61 (L) | 4.5/32 | 4.7/29 | 3 | 12 | 14-3-3 like protein | Vigna angularis | 3.2 | ||
| 13928452 | 1.1 | ||||||||
| 65 (S) | 4.5/31 | 4.7/29 | 11 | 44 | 14-3-3 like protein | Pisum sativum | 2.2 | B AB A |  |
| 4775555 | 0.6 | ||||||||
| 168 (L) | 4.4/33 | 4.7/29 | 3 | 13 | 14-3-3 like protein | Pisum sativum | 2.7 | A B B |  |
| 4775555 | - | ||||||||
| (L) | 5.0/31 | 3 | 11 | Expressed protein | Arabidospis thaliana | ||||
| 18394414 | |||||||||
| 174 (L) | 4.8/24 | 4.7/32 | 3 | 11 | Anther-specific protein | Pisum sativum | 1.6 | A A B |  |
| 20159765 | 1.7 | ||||||||
| 178 (L) | 5.0/24 | 4.7/32 | 5 | 15 | Anther-specific protein | Pisum sativum | 2.9 | A B B |  |
| 20159765 | 2.7 | ||||||||
| 185 (L) | 5.4/28 | 9.1/32 | 3 | 12 | Putative 3-beta hydroxysteroid dehydrogenase/ isomerase protein | Oryza sativa | 0.5 | B B A |  |
| 14719331 | 0.2 | ||||||||
| 192 (L) | 5.5/23 | 5.3/21 | 4 | 23 | Lactoylglutathione lyase | Cicer arietinum | 2.4 | B A A |  |
| 3334245 | 0.8 | ||||||||
| 205 (L) | 5.2/14 | 5.2/19 | 4 | 24 | Thioredoxine | Pisum sativum | 2.4 | A B A |  |
| 1388088 | - | ||||||||
| 217 (L) | 5.1/32 | 5.0/23 | 4 | 15 | Plasma intrinsic polypeptide | Cicer arietinum | 0.9 | C B A |  |
| 6469121 | 2.7 | ||||||||
The data were classified according to protein function described by Bevan et al. (1998) and included an assigned spot number (Fig. 3) with tissue in which proteins were identified: L, leaf or S, stem. Experimental and theoretical pIs and Mr, the number of MALDI-TOF and LC-MS/MS matched peptides, and the percentage of sequence coverage of the protein by the matched peptides were also indicated. The assigned protein of the best matched was given with the organism in which it has been identified and its GenBank accession number. The normalized volume of each identified spot at 4 DAP was indicated for both tissues, if spot was present in the tissue. Significant ANOVA was followed by an SNK test (P < 0.05) carried out on the leaf-normalized spot volumes. Different letters mean that protein relative abundance was significantly different between stages, and they could be arranged in descending order. Same letters indicate that relative abundances were different between stages but they could not be arranged with the SNK test. Histograms in the last column represented leaf spot volumes at 4, 12, and 19 DAP. Data were presented as means of normalized spot volumes ± sd. For spots identified two times, all the information concerning the identification was noticed under the same number spot. No. Match. Pep., number of matched peptides; % Seq. Cov., percentage of sequence coverage.
Figure 4.

Assignment of the identified proteins to functional categories by using the classification described by Bevan et al. (1998). A total of 130 spots representing 80 different proteins were classified. The same spot identified by both MS methods (MALDI-TOF and LC-MS/MS) in both leaf and stem extracts was counted once.
Figure 5.

Relative abundance of the different classes of identified proteins determined according to Bevan et al. (1998), in leaves (A) and stems (B). Abundance of protein categories was expressed as the percentage of the total volume of all detected spots in 2-DE gels.
Less abundant proteins were involved in nitrogen and amino acid metabolism (4.8% of total spot volume in leaves, Glu ammonia ligase, Glu decarboxylase, Met synthase, Met adenosyl transferase, amino aldehyde dehydrogenase, arginosuccinate synthase), in protein folding, processing, or stability (2.4% of total spot volume in leaves, various molecular chaperones, heat shock proteins [HSP], and proteases), in plant defense (4.1% of total spot volume in leaves, ascorbate peroxidase, l-ascorbate peroxidase, and CuZn superoxide dismutase [SOD], and pathogenesis-related [PR] proteins), in secondary metabolism (1.5% of total spot volume in leaves, 2′-hydroxyisoflavone reductase, 1,4-benzoquinone reductase, isoflavone reductase, and caffeoyl-CoA methyltransferase), and the miscellaneous protein category that included various proteins, such as 14-3-3-like proteins and anther-specific proteins (2.1% of total spot volume in leaves).
The maps of leaf and stem proteins were highly similar, although the same spots detected in both tissues often differed in staining intensity (Fig. 3) and in relative abundance (Table I). Most of the spots detected and identified in leaves were also present in stem tissues and vice versa, except for 14 leaf protein spots (67, 75, 80, 82, 148, 164, 165, 168, 176, 177, 183, 200, 202, and 205) that were absent or not well resolved on stem 2-DE gels. The stem protein profile was of better quality due to a lower abundance of Rubisco that permitted better resolution, as noted by Watson et al. (2003), and allowed the identification of spots not well resolved on leaf 2-DE gels. The most marked difference between these maps was the presence of many abundant spots in the leaf protein profile. At 4 DAP, the total volume of proteins involved in energy metabolism was higher in leaves than in stems (Fig. 5). In particular, the relative abundance of the oxygen-evolving proteins was significantly higher in leaves. Proteins involved in secondary metabolism were more abundant in stems (3.9%) than in leaves (0.8%). We have chosen to use leaf tissue to analyze the events associated with the mobilization of protein-bound nitrogen because more than 65% of the nitrogen leaf content is mobilized during monocarpic senescence (Peoples and Dalling, 1988).
Quantitative Proteomic Analysis of Leaves during N Mobilization
Mobilization-related changes occurring in leaves during seed filling were analyzed through the changes in relative protein abundance at three different stages: before N mobilization and seed filling (4 DAP), during early seed filling and N mobilization (12 DAP), and a later stage of seed filling and N mobilization (19 DAP; Fig. 1) On a constant fresh-weight basis, the protein concentrations of the samples decreased (e.g. 8.5 μg proteins μL−1 at 4 DAP and 2.4 μg μL−1 at 19 DAP), and the majority of protein spots (72%) showed a decreasing volume (Fig. 2). Therefore, to obtain comparable gels for quantitative analyses, we have chosen an approach based on a constant protein load per gel (200 μg/gel). The variations of spot volume indicated variations in their relative abundance in relation to a constant amount of protein. However, the quantity of protein per spot could be deduced by multiplying the volume of each spot by the protein concentration of the extracts, as measured according to Bradford (1976), using a reagent compatible with the reducing and denaturing agents of the protein extracts. Whereas on a constant fresh-weight basis the majority of protein spots showed a decreasing volume (Fig. 2), on a constant protein basis, the relative abundance of protein spots decreased, increased, or showed transitory variations from 4 to 19 DAP (Table II). Of the 191 spots quantified in the 2-DE gels, 80 spots showed significant variations in their relative abundance (41%), of which 74 were identified in the reference maps (Fig. 3). Our study did not reveal any new protein spot appearing during the process of mobilization. All the variations are presented in Table I, and Figure 6 shows some examples of variations in protein profiles.
Table II.
Types of variation in the relative abundance of the 74 identified spots significantly variable (ANOVA alpha = 0.05) between 4 and 19 DAP
| Type of Variation | No. of Spots |
|---|---|
| Decrease after 4 DAP | 40, 139, 168, 169, 178, 183 |
| Decrease after 12 DAP | 88, 90, 117, 174 |
| Progressive decrease from 4 to 19 DAP | 58, 177 |
| Increase after 4 DAP | 2, 30, 32, 44, 55, 62, 63, 72, 74, 80, 82, 98, 127, 148, 192 |
| Increase after 12 DAP | 1, 39, 46, 87, 94, 102, 103, 111, 119, 128, 132, 164, 176, 185, 218, 219 |
| Progressive increase from 4 to 19 DAP | 36, 54, 56, 65, 108, 126, 129, 150, 154, 165, 191, 217 |
| Transient decrease at 12 DAP | 13, 22, 116, 205 |
| Transient increase at 12 DAP | 17, 48, 57, 76, 78, 83, 89, 91, 92, 115, 122, 138, 171, 200, 202 |
Figure 6.

Characterization of leaf proteins whose relative abundance varies significantly between 4 and 19 DAP. A, Coomassie Blue 2-DE gel of total proteins (pI 4–7) from leaves at 4 DAP. B, C, and D are enlarged. B, Spots 174 and 178 (anther-specific proteins) whose relative abundance decreased after 12 and 4 DAP, respectively. C, Spots 76 (chlorophyll a/b-binding protein type III precursor) and 78 (1,4-benzoquinone reductase-like), whose relative abundance transiently increased at 12 DAP. D, Increased relative abundance of spots 150 (Rubisco activase) and 154 (actin) from 4 to 19 DAP.
RbcL is considered as the major source of mobilizable nitrogen in leaves. In the total protein extracts analyzed in this study, the rbcL spot 111 quantity, calculated as the relative abundance multiplied by the protein concentration in the extracts, decreased by 50% between 4 and 12 DAP, and by 60% between 4 and 19 DAP. Additionally, the proteomic analysis revealed that its relative abundance remained constant between 4 and 12 DAP, and increased between 12 and 19 DAP (Table I). Together, these data suggest that, even if rbcL is the major source of mobilizable nitrogen in leaves due to its very high abundance, its relative rate of degradation is comparable to the mean rate of protein degradation in leaves between 4 and 12 DAP and is slower between 12 and 19 DAP. Following the massive reduction of rbcL, the relative abundance of low molecular mass rbcL peptides, which might correspond to degradation products, increased. This is the case for spots 82 (23 kD) and 98 (22 kD), whose relative abundance increased after 4 DAP, and for spot 87 (19 kD), whose relative abundance increased after 12 DAP. The analysis of the results of MS revealed that the matched peptides that allowed the identification of the products of the degradation of rbcL were located between Leu-22 and Arg-213 (Table III). These data suggested that the degradation products of Rubisco were derived from the N-terminal portion of the protein, except for spot 93. In this spot, two hypothetical, distinct rbcL degradation products, an N-terminal and a C-terminal product, were identified. This could be due to a limit in the resolution of two overlapping peptides in the 2-DE gels, these two peptides corresponding to two products of degradation with similar pI and Mr. Additionally, the relative abundance of Rubisco activase (spots 44 and 150) increased after 4 DAP, and the maximum relative abundance of Rubisco-binding proteins (spots 13, 119, 132) was reached by 19 DAP. Another abundant source of mobilizable nitrogen is the protein of the photosystem complex. The relative abundance of spots corresponding to the PSII oxygen-evolving enhancer subunits 1 and 2 (spots 177 and 183) decreased from 4 DAP, whereas two other spots corresponding to subunit 1 (spots 62 and 63) increased (Table I). These results indicate that spots 177 and 183 were degraded more rapidly than the other proteins and spots 62 and 63 less rapidly.
Table III.
Degradation products of rbcL
| Spot Number (Exp. PI/Mr) | Start and End of the Peptide | Peptides | Portion of the Rubisco LS Sequence |
|---|---|---|---|
| 77 (6,5/25) | 22–32 | LTYYTPDYQTK | N-terminal |
| 33–41 | DTDILAAFR | ||
| 132–139 | ALRLEDLR | ||
| 135–146 | LEDLRIPYAYVK | ||
| 140–146 | IPYAYVK | ||
| 147–159 | TFQGPPHGIQVER | ||
| 82 (5,1/23) | 22–32 | LTYYTPDYQTK | N-terminal |
| 33–41 | DTDILAAFR | ||
| 140–146 | IPYAYVK | ||
| 132–139 | ALRLEDLR | ||
| 135–146 | LEDLRIPYAYVK | ||
| 147–159 | TFQGPPHGIQVER | ||
| 83 (5,4/23) | 22–32 | LTYYTPDYQTK | N-terminal |
| 33–41 | LTYYTPDYQTK | ||
| 132–139 | ALRLEDLR | ||
| 135–146 | LEDLRIPYAYVK | ||
| 140–146 | IPYAYVK | ||
| 147–159 | TFQGPPHGIQVER | ||
| 147–161 | TFQGPPHGIQVERDK | ||
| 84 (5,5/20) | 33–41 | DTDILAAFR | N-terminal |
| 140–146 | IPPAYSK | ||
| 147–159 | TFQGPPHGIQVER | ||
| 188–194 | AVYECLR | ||
| 202–213 | DDEKLNSQPFMR | ||
| 87 (5,2/19) | 33–41 | DTDILAAFR | N-terminal |
| 140–146 | IPPAYSK | ||
| 147–159 | TFQGPPHGIQVER | ||
| 188–194 | AVYECLR | ||
| 202–213 | DDEKLNSQPFMR | ||
| 93 (5,1/15) | 22–32 | LTYYTPDYQTK | N-terminal and C-terminal |
| 33–41 | DTDILAAFR | ||
| 147–159 | TFQGPPHGIQVER | ||
| 335–350 | LEGEREITLGFVDLLR | ||
| 340–355 | EITLGFVDLLRDDYIK | ||
| 340–350 | EITLGFVDLLR | ||
| 422–431 | VALEACVQAR | ||
| 451–463 | WSPELAAACEVWK | ||
| 464–475 | EIKFEFPAMDTL | ||
| 98 (5,1/21) | 22–32 | LTYYTPNYETK | N-terminal |
| 33–41 | DTDILAAFR | ||
| 147–159 | TFQGPPHGIQVER | ||
| 165–177 | YGRPLFGCTIKPK | ||
| 188–194 | AVYECLR |
Mapping of matched peptides onto the rbcL was shown. Numbers of spots were given with their experimental pI and Mr in the first column. Start and end of peptides of the rbcL (Gi accession no. 132009; pI, 6.6; Mr, 53 kD; 475 residues) with their sequence that allowed protein identification were noted in the second and third columns. The last column noted to which extremity of the full rbcL sequence products of degradation corresponded.
Other, less abundant proteins showed interesting patterns of expression during N mobilization. The relative abundance of chloroplast translation elongation factor (EF-Tu; spot 40) decreased from 4 DAP. Conversely, the relative abundance of spots 103, 128, and 129, corresponding to chloroplast proteases (FtsH protease, ClpC endopeptidase) increased from 4 DAP. The quantity of these spots remained almost constant on a fresh-weight basis. The relative abundance of spots corresponding to peptidyl-prolyl cis-trans isomerase, and to molecular chaperones (HSP70, DNA K) also increased. In the group of proteins involved in plant defense, the relative abundance of SOD (spots 108), PR proteins (spots 91 and 92), and chitinase (spot 72) increased. Two spots corresponding to 14-3-3-like proteins showed contrasted patterns of variation: The relative abundance of spot 65 increased while that of spot 168 decreased. Concerning enzymes involved in glycolysis and the glyoxylic cycle, two post-translational modifications of aldolase showed a differential variation (spot 58 decreased, spot 54 increased), whereas spots 32, 55, 74, and 192, corresponding to enolase, fructokinase, triosephosphate isomerase, and lactoyl-glutathione lyase all showed increased relative abundance after 4 DAP.
The variations in the relative abundance of proteins were confirmed in an independent experiment, for spots corresponding to rbcL, Rubisco activase, Clp proteases, and Rubisco-binding proteins (data not shown).
DISCUSSION
Leaf and Stem Proteome Maps
Building reference proteome maps for the organs or plant tissues of interest is a prerequisite for analyzing protein expression during various physiological processes or the effect of environmental factors or mutations on the proteome of these organs or tissues. We built proteome maps of leaves and stems in pea. Surprisingly for a species for which a limited number of sequences are available in databases, a high percentage (62%) of protein spots was successfully identified by MALDI-TOF spectrometry. When the identification was ambiguous, the identity of the protein was confirmed by LC-MS/MS (92% of success). This high percentage of identification is largely due to the fact that the most abundant proteins of the proteome maps corresponded to well-known and highly conserved enzymes of energy metabolism. Similarly, many major proteins identified in pine needles (Costa et al., 1999) and maize leaves (Porubleva et al., 2001) were involved in carbon metabolism and photosynthesis.
Interestingly, the proteome maps merged the spots obtained in subcellular proteome analysis of pea thylakoids and mitochondria (Peltier et al., 2000; Bardel et al., 2002). Indeed, the experimental characteristics and identity of some proteins revealed by these subcellular analyses were similar to those identified in this study. For example, protein spot 129 (Mr, 54.3; pI, 6.6) of pea thylakoids and spot 111 (Mr, 53; pI, 6.8) of the present study were both identified as rbcL. Similarly, spot 120 (Mr, 37.5; pI, 6.2) of pea thylakoids and spot 54 (Mr, 38; pI, 6.3) of this study were assigned to aldolase. Slight differences in Mr and pI between the experiments could be attributed to a different experimental prediction of the values. The comparison of the proteome maps obtained for leaf and stem showed that they were very similar, except for relative spot abundance (Fig. 3). Similarly, the comparison of HPLC profiles and sequences of spots with homologous locations in 2-DE gels of maritime pine needle and xylem showed that they have the same identity (Costa et al., 1999). Together, these data suggest that spots characterized by similar Mr and pI for the same organ in different experiments, or for two aerial vegetative organs like leaf and stem, are likely to correspond to the same protein and emphasize the reliability of these maps.
In order to analyze the consequences of N mobilization in leaves of pea during seed filling, we used a composite reference map obtained by pooling the MS leaf and stem data (Table I).
N Mobilization in Leaves of the Vegetative Nodes in Relation to Seed Filling
The literature reports diverse methods to monitor N mobilization or senescence, such as the determination of nitrogen or chlorophyll content expressed per surface area or per fresh weight. Also, a wide range of conditions was used to induce senescence-like changes, such as light limitation, drought stress, nitrogen deficiency, pathogen infection, or plant aging when considering different nodes on the same plant. In this study, we focused on monocarpic leaf senescence associated with nitrogen mobilization. The leaves were harvested on the seventh and eighth vegetative nodes (i.e. nodes immediately below the first flowering node) from the day of pollination of the second flowering node. N mobilization was followed through leaf nitrogen content that reflects soluble protein concentration (Fig. 1). The decline of soluble proteins is indicative of the onset of massive N mobilization and also of the onset of senescence (Crafts-Brandner et al., 1998). In our experimental conditions, soluble protein concentration decreased in the seventh and eighth vegetative nodes from 10 to 19 DAP. During this period, nitrogen content dropped from 2.5% to 1.6%. This lower level could correspond to a plateau phase before further dismantling of the leaf cell structures. In contrast, protease activity in leaves of the seventh and eighth vegetative nodes increased at 10 DAP, which may contribute to the massive N mobilization from leaves to sustain the high demand of nitrogen in developing seeds. This period of N mobilization corresponded to the period of seed filling, determined by seed water content measurement (Ney et al., 1993). The period of seed filling for the second flowering node extended from 10 to 24 DAP.
The objective of this study was to identify proteins degraded, induced, or modified during N mobilization. About 40% of the spots at pIs from 4 to 7 showed abundance variations when a constant amount of protein was loaded on gels. This is the general approach used in quantitative proteomics applied to different developmental stages. No new spot appeared during the process. Even products of degradation of Rubisco were detected before massive N mobilization: Proteolysis occurred constitutively, but the rate of proteolysis changed during the different stages analyzed. These results were in agreement with Wilson et al. (2002), who found 40% of proteins to be changed in abundance by senescence but the absence of new spots appearing.
Mobilization-Related Changes in Proteins Controlling the Leaf Photosynthetic Potential
The decline in soluble proteins is closely associated with the decline in abundance of several stromal enzymes, most notably rbcL and PSII (Matile, 1992; Crafts-Brandner et al., 1996). In our study, we found that even though the quantity of rbcL decreased, its relative abundance increased at 19 DAP, suggesting a lower rate of degradation than other proteins at this stage. Among proteins derived from PSII, some spots showed decreased, and others increased, relative abundance. In white clover, the abundance of rbcL and thylakoid PSII showed a transitory increase in early-senescent and a substantial decrease in late-senescent leaves (Wilson et al., 2002). However, since the two systems are very different, it is difficult to determine, for example, whether our 19-DAP stage corresponds to early- or late-senescent leaves studied by Wilson et al. (2002). However, in view of the decline in chlorophyll content, late-senescent leaves in Wilson et al. are most probably yellowing: Thus, our 19-DAP stage probably corresponds to a stage before the one they noted as late senescence. Interestingly, the relative abundance of three spots of Rubisco activase (spots 44, 46, and 150; Table I) increased during N mobilization. Rubisco activase is an important regulator of photosynthesis that maintains Rubisco catalytically active by removing sugar phosphates that impede carbamylation at the active site, located in the large subunit (Portis, 1992). Together with this increase in relative abundance of Rubisco activase, we found increased levels of α- and β-subunits of Rubisco-binding proteins, known as chloroplast molecular chaperones, assumed to ensure the correct assembly of Rubisco. These results suggest that different mechanisms may act simultaneously after massive degradation of Rubisco to maintain activity of residual Rubisco during N mobilization: Rubisco activase to promote its activation (He et al., 1997) and Rubisco-binding proteins to prevent its denaturation/degradation.
Proteins Related to Proteolysis and Maintenance of Photosynthesis/Cell Viability during N Mobilization
The results showed a decreased relative abundance of EF-Tu (spot 40; Table I) from 4 DAP and the increased relative abundance of several proteases (spots 128, 129, and 103; Table I). Concomitantly, protease activity increased at the beginning of N mobilization. These data reflect the decline in protein synthesis and the increase in protein degradation in the chloroplast during senescence (Smart, 1994). The degradation of proteins is probably the most significant break-down process that takes place during senescence, and the subsequent mobilization of amino acids is of crucial importance to supply the developing organs elsewhere in the plant. The complete hydrolysis of proteins to free amino acids depends on the action of endo- and exopeptidases (Brouquisse et al., 2001). In this respect, the increased expression of several protease genes was reported during senescence (Buchanan-Wollaston et al., 2003). The protein spots 128 and 129 identified in the present study corresponded to subunits of the ATP-dependent Clp protease. This enzyme is located in the chloroplast stroma and contains at least two different subunits: a catalytic subunit ClpP of 21 kD and an ATPase regulatory subunit ClpC of 92 kD (analogous to ClpA in Escherichia coli; Adam and Clarke, 2002). The ClpP subunit has been shown to play a role in the degradation of the cytochrome b6-f complex in the green alga Chlamydomonas reinhardtii (Majeran et al., 2000). Nakashima et al. (1997) showed that erd1, a nuclear gene encoding a protein similar to the regulatory ClpC subunit, was up-regulated during water stress and senescence in Arabidopsis. Conversely, Crafts-Brandner et al. (1996) suggested a constitutive expression of Clp subunits in senescent Phaseolus vulgaris leaves, even though an increase in abundance of mRNA ClpC was observed during nitrogen starvation. However, the exact role of this enzyme during senescence is still unknown. Our results, showing increased relative abundance of two ClpC regulatory subunits concomitantly with the decrease in nitrogen content in leaves (Fig. 1), suggest a possible role of ClpC subunits in N mobilization from leaves during seed filling. This may not be in contradiction with Crafts-Brandner et al. (1996), since, in monocarpic species, the period of seed filling can mimic nitrogen starvation.
The protein spot 103 (Table I) was identified as a chloroplastic membrane-bound ATP-dependent Zn2+-activated protease (FtsH). Originally identified in E. coli, FtsH homologs have been found throughout nature and are implicated in the degradation of proteins in bacteria, mitochondria, and chloroplasts (Langer, 2000). Recently, Silva et al. (2003) proposed a direct role for these proteins in the early stages of repair of PSII in the cyanobacterium Synechocystis sp. PCC 6803 during light stress. This protease is involved in the removal of the damaged D1 subunit of PSII and in the maintenance of its activity. Here, we provide evidence that the relative abundance of a chloroplastic FtsH protein increased in pea leaves during N mobilization. Two possible roles could be proposed for this protein: (1) It could be involved in the degradation of PSII; our results showed a decrease in relative abundance of photosynthesis-related proteins in leaves (Fig. 2). (2) It could also play a role in the maintenance of photosynthesis/cell viability during the intense proteolytic activity within the chloroplasts.
Several mitochondria or chloroplast molecular chaperones showed increased relative abundance. In particular, two of them (Table I, spots 218 and 219) corresponded to the major HSP70 of the pea chloroplast stroma (Marshall and Keegstra, 1992), which could play a role in protein translocation at the chloroplast envelope, as reviewed by Gray and Row (1995). The expression of genes encoding chloroplast-targeted HSP70s has been shown to increase during light stress in the green alga C. reinhardtii, and a role for these proteins in the molecular protection of the PSII reaction centers and in the process of PSII repair was proposed (Schroda et al., 1999). The increase in relative abundance of these two HSP70 proteins during N mobilization suggests that they could play a role in the protection and repair of PSII throughout this process. Other chaperones revealed by this approach may be required for the maintenance of metabolic activities within the cell, such as mitochondrial DNA K (Table I, spots 126 and 127) that showed a sequential increase in relative abundance during N mobilization from 4 to 19 DAP and may help the mitochondria to remain active later in senescence (Feller and Fisher, 1994).
Several PR Proteins Increased in Relative Abundance
A PR protein 10 (spot 91) and an abscisic acid-responsive protein closely related to intracellular PR proteins 17 (spot 92) showed a transitory increase in relative abundance at 12 DAP. The role of PR proteins during senescence is still uncertain. They could play a role in the defense of senescing tissues against pathogens, reflecting the vulnerability of the tissues at this stage (Buchanan-Wollaston, 1997), or they could play a more active role: PR-10 potentially has ribonuclease-like activity (Bantignies et al., 2000), and PR-17 potentially has protease activity (Christensen et al., 2002). Additionally, a PR chitinase (spot 72) showed an increase in relative abundance from 4 to 12 DAP. Similarly, the expression of genes encoding proteins normally associated with the pathogen response was found to increase during senescence in Brassica napus (Hanfrey et al., 1996; Quirino et al., 1999) and during drought stress in grain legume crops such as lupins (Lupinus albus; Pinheiro et al., 2001). However, the role of these proteins during senescence-like changes has not yet been elucidated.
Regulatory Molecules
14-3-3 proteins, existing in several isoforms and presenting post-translational modifications, play significant roles in various plant regulatory and metabolic processes. The interaction of 14-3-3-like proteins with a number of metabolic enzymes suggests their involvement in coordination of primary carbon and nitrogen metabolism (Comparot et al., 2003). In addition, several 14-3-3s have been identified within chloroplasts with possible roles in targeting and insertion of thylakoid proteins (Fulgosi et al., 2002). In our study, concomitant with the decreased accumulation of the 14-3-3 spot 168, from 4 to 12 DAP, the relative abundance of spot 65 increased. This could correspond to a differential accumulation of a post-translational modification of the protein, because identified proteins have the same accession number, leading to a specific role whose elucidation could be of particular interest for the understanding of the regulatory network controlling early senescence.
CONCLUSION
Because of the positive relationship between the rate of nitrogen accumulation in the seeds and the level of nitrogen availability (Lhuillier-Soundele et al., 1999), the characterization of the N-mobilization process in leaves may be of crucial importance for future improvement of seed nitrogen content in leguminous crops. Our data allowed us to identify some proteins potentially involved in N mobilization. During N mobilization, 40% of protein spots with pIs 4 to 7 showed changes in relative abundance, and many proteins showing an increase in relative abundance were involved in protein folding, protein degradation, and defense mechanisms. The analysis of the protein spots showing changes in relative abundance during N mobilization indicates, first, that even if rbcL is the major source of mobilizable nitrogen in leaves, its rate of degradation is similar to the other proteins. Second, accumulation of Rubisco activase and of several chaperone proteins (chloroplastic HSP70), suggests a role for these proteins in the maintenance of carbon assimilation and cell viability, respectively. Third, the increase of relative abundance of regulatory subunits of the chloroplastic protease Clp and the increase of protease activity at the beginning of N mobilization suggest a key role in the hydrolysis of the major sources of mobilizable nitrogen. These proteins represent candidates for understanding the regulatory networks controlling early senescence. Finally, this work confirms that proteomics is a powerful approach to investigate protein expression patterns in plants during such complex processes and is complementary to the transcriptomic approach. Some proteins showing increased relative abundance in our study corresponded to genes for which induced mRNA levels were reported during senescence: malate-dehydrogenase, Fru 1,6-bisphosphate aldolase, GAPDH, chitinase, and Clp proteases (for reviews, see Buchanan-Wollaston, 1997; Buchanan-Wollaston et al., 2003). However, while showing apparent differential maintenance of some proteins over others during N mobilization in leaves, this study did not give any indications about protein turnover. Variations in the relative abundance of protein spots could result either from a variation in the proteolytic activity or from a variation in the rate of synthesis of these proteins. In order to better understand the biological processes occurring during N mobilization from leaves, estimates of protein turnover using [35S]Met- or [35S]Cys-labeled proteins are required.
MATERIALS AND METHODS
Plant Material
Plants from pea (Pisum sativum cv Caméor), a short and broad-leafed genotype, were grown in a sterile mix (1:1, v/v) of atapulgite and expanse clay, in a growth chamber under controlled conditions (22°C/16°C, 16-h photoperiod, 550 μm m−2 s−1). Five days a week, plants were watered with a nutritive solution at 4.5 meq (corresponded to 4.5 mm of elementary electric charge) of  and with deionized water the other days. The flowers of the three first flowering nodes were tagged on the day of pollination in order to harvest the seeds, leaf, and stem sections at different stages of seed development. The seed water content, seed fresh weight, and seed dry weight were determined at different stages during seed development. The leaves and stems from the seventh and eighth vegetative nodes (below the first flowering branch) were harvested at 4, 8, 12, 15, 19, and 24 DAP of the second flowering nodes. The harvesting was done during the night period, under a green safelight. For the determination of nitrogen content, the seventh and eighth vegetative nodes of two plants per stage were harvested, dried at 80°C for 48 h, and nitrogen content was determined by the Kjeldahl method. For protein extraction, the seventh and eighth vegetative nodes of eight plants per stage were harvested, pooled to buffer the environmental effect within the growth chamber, and immediately frozen in liquid nitrogen and stored at −80°C. Leaves and stems of the eight combined plants were ground separately using mortar and pestle in liquid nitrogen. The powder was stored at −80°C until protein extraction. In a second, distinct experiment, a set of six plants, grown in the same conditions as the first ones, was collected at 6, 10, and 18 DAP. Leaves of the seventh and eighth vegetative nodes were pooled, ground, and proteins were extracted as the first set.
Protease Activity Measurement
Protease activity was measured with the QuantiCleave Protease Assay kit (Pierce Biotechnology, Rockford, IL) at 6, 10, and 18 DAP. Proteins were extracted in water from ground tissues stored at −80°C. Five replicates by stages were made.
Protein Extraction and Solubilization
Total proteins were extracted from 1 g of powder in 1 mL of lysis buffer containing 26 mm Tris-HCl, 2 m thiourea, 0.3% (v/v) Triton X-100 (Sigma-Aldrich, St. Quentin Fallavier, France), 20 mm Trizma base (Fluka, St. Quentin Fallavier, France), 7.5 m urea, 63 mm CHAPS, Pharmalyte, pH 3 to 10 (Amersham Biosciences, Saclay, France), 1% (v/v), and the protease inhibitor cocktail complete mini, 14% (v/v; Roche Diagnostics, Mannheim, Germany). After shaking 30 min at 4°C, 7 mm of DTT (Amersham Biosciences) were added and the protein extracts were stirred 20 min at 4°C and centrifuged (20,000g for 20 min at 4°C). The supernatant was submitted to a second centrifugation for 10 min. The final supernatant corresponding to the total protein extract was precipitated in 1 volume of acetone containing 20% TCA (v/v; Sigma-Aldrich), 9 mm DTT at −20°C overnight, then centrifuged (20,000g for 20 min at 4°C). The pellet was resuspended in 2 volumes of acetone containing 9 mm DTT at −20°C for 1 h, then centrifuged as above. After drying, the pellet was resuspended in 200 μL of lysis buffer. Samples were stored at −20°C before electrophoresis. Protein concentrations in the protein extracts were measured according to Bradford (1976) by using a reagent (Bio-Rad Protein Assay; Bio-Rad, Marnes-la-Coquette, France) compatible with the reducing and denaturing agents used to prepare the protein extracts.
Two-Dimensional Electrophoresis
Proteins from the different extracts were first separated according to charge in the electrofocusing IPGphor system (Amersham Biosciences), at 20°C, using 24-cm gel strips forming an immobilized linear pH gradient from 4 to 7 (Amersham Biosciences). Each strip was rehydrated for 7 h in the presence of 460 μL of rehydration buffer (7 m urea, 2 m thiourea, 65 mm CHAPS, 20 mm DTT, Pharmalyte, pH 3 to 10, 0.5% [v/v], Triton X-100, 2% [v/v]) containing the protein extract. Isoelectric focusing ran for 7 h at 50 V, 1 h at 350 V, 3 h at 3,500 V, and then until 60 kV·h at 8,000 V. After electrofocusing, the strips were either stored at −80°C or immediately equilibrated and separated according to their molecular weight in the Isodalt System (Amersham Biosciences), as described by Gallardo et al. (2002).
For protein identification by MS, a first series of gels was prepared using 100 μL of protein extracts corresponding to about 800 μg of proteins from leaves and stems at 4 DAP. A second series of three 2-DE gels was performed with a constant leaf fresh weight (240 mg) at 4, 12, 15, 19, and 24 DAP. For quantitative analyses, a third and fourth series of gels was prepared from 200 μg of leaf proteins determined according to Bradford (1976). In the third series, five 2-DE gels, made from two distinct extractions, were done at constant protein levels at 4, 12, and 19 DAP. Three gels were performed from the first extraction and two from the second extraction, the gels for both extractions running in two independent batches. In the fourth series, three 2-DE gels loaded at 200 μg per stages (6, 10, and 18 DAP) were made with leaves from the second set of plants.
Protein Staining
Gels were stained with Coomassie Blue according to the procedure described by Mathesius et al. (2001), with modifications: Gels were stained for 3 d in the staining solution and destained for 24 h. They were scanned with a JX-330 Sharp electronics scanner (Svenska AB, Bromma, Sweden), equipped with the Labscan version 3.00, and then dried between cellophane membranes (Bio-Rad).
MS Analyses
Spots of interest were excised from Coomassie Blue-stained 2-DE gels and stored at −80°C in a 1.5-mL transparent Eppendorf tube. Frozen spots were analyzed by MALDI-TOF spectrometry at the Proteomic Platform of INRA, Montpellier, France. The peptide mass tolerance was ± 100 ppm. The proteins were identified by searching the protein databases using MASCOT (http://www.matrixsciences.com) and the function of proteins was searched with National Center for Biotechnology Information (NCBI) databases (http://www.ncbi.nlm.nih.gov). Theoretical Mr and pI of the identified proteins were determined from MASCOT databases used for peptide identification or from the sequence using http://us.expasy.ch/tools/peptide-mass.html. Experimental Mr and pI, corresponding to the Mr and pI of spots detected on 2-DE gels, were calculated with ImageMaster 2D Elite. For the precursor form of protein, Mr and pI of the mature form could be predicted by entering the protein sequence at http://www.expasy.ch/tools/peptide-mass.html, without the peptide transit determined with ChloroP at http://www.cbs.dtu.dk/services/ChloroP, or the mitochondrial targeting sequences determined with MitoP at http://www.mips.biochen.mpg.de/cgi-bin/proj/medgen/mitofilter. To consider a protein as unambiguously identified by MALDI-TOF, the following criteria were used: a minimum of four independent matching peptides, significant protein scores given by MASCOT (P < 0.05), and a minimum of 10% coverage of protein by the matching peptides. If these criteria were not satisfied, we compared the Mr/pI of matched protein to the values of the predicted protein to validate the identification. Other spots and some confirmation of spot identity were performed by nano LC-MS/MS (ion trap) at the Proteomic Platform of INRA Le Moulon (Gif sur Yvette, France). The proteins were identified from the MS/MS spectra in protein databases using Bioworks 3.1 (Sequest), and the database peptides were selected with a maximal error of 1.2 D. A protein was successfully identified when at least two different peptides matched the protein sequence with significant correlation scores (XC up to 1.7, 2.2, and 3.5 for + 1, + 2, and + 3 charged peptides, respectively). The XC value represents the overlap correlation between experimental and theoretical MS/MS spectra produced by candidate peptides in the databases.
Quantitative Image Analysis
An image analysis was carried out on 2-DE leaf gels using the software ImageMaster 2-D Elite. For protein spot detection, spot detection wizard mode was used to set the detection parameters and each spot was checked visually. The gel that contained the highest number of spots was arbitrarily chosen as reference gel and spots of the reference gel were then matched across the other gels after adding user seeds. After subtracting the background with the mode of nonspot (margin 45), spot volumes were normalized for differences in staining intensity: The volumes were divided by the sum of the volumes of 25 reference spots, according to Gallardo et al. (2003). These 25 spots were chosen because they were present in all 2-DE gels, their volume appeared visually as constant between stages, they were well determined, well quantified, and distributed throughout the gel. Because a constant protein quantity was loaded onto gels, the normalized spot volumes corresponded to the relative abundance of the corresponding protein in relation to a constant protein basis. However, the quantity of protein per spot, on a fresh-weight basis, could be deduced from the normalized volume by multiplying it by the protein concentration of the extract, as measured according to Bradford. The linear relationship between spot volume and the quantity of protein loaded onto gels was checked for 52 spots, varying from least-to-most abundant spots (data not shown). Mr and pI were calculated using the ImageMaster 2-D Elite software calibrated with commercial molecular mass standards (precision protein standards unstained; Bio-Rad) run in a separate marker lane on the 2-DE gel. A nested ANOVA (P < 0.05) was performed (SAS Institute, 1988) to compare the relative protein abundance of detected spots among the three stages: The normalized volumes were the variables to explain, the stage was the main factor, and the extraction/batch factor was nested in the stage factor. A multiple comparison of means (Student-Newman-Keuls [SNK] test) was performed for normalized spot volumes that were significantly variable with ANOVA among stages. Because the residual variance was better estimated in the ANOVA, by taking into account the nested experimental factor, than in the SNK test, some spots presented significant variations according to ANOVA but not to the SNK test. In these cases, we could conclude that abundance of spots was not constant between stages, but we could not classify them.
Acknowledgments
For their kind and expert technical assistance, we thank C. Weinachter for the preparation of plant material, D. Pouhair and G. Sanchez for taking care of plants, and B. Roy for nitrogen analyses. We are grateful to N. Munier-Jolain and C. Salon for enlightening discussions, and to R. Thompson for critical reading of the manuscript. We also thank anonymous reviewers for helpful comments on the manuscript.
This work was supported in part by the Regional Council of Burgundy, France
Article, publication date, and citation information can be found at www.plantphysiol.org/cgi/doi/10.1104/pp.104.041947.
References
- Adam Z, Clarke AK (2002) Cutting edge of chloroplast proteolysis. Trends Plant Sci 7: 451–456 [DOI] [PubMed] [Google Scholar]
- Bantignies B, Seguin I, Muzac I, Dedaldechamp F, Gulick P, Ibrahim R (2000) Direct evidence for ribonucleolytic activity of a PR-10-like protein from white lupin roots. Plant Mol Biol 42: 871–881 [DOI] [PubMed] [Google Scholar]
- Bardel J, Louwagie M, Jaquinod M, Jourdain A, Luche S, Rabilloud T, Macherel D, Garin J, Bourguignon J (2002) A survey of the plant mitochondrial proteome in relation to development. Proteomics 2: 880–898 [DOI] [PubMed] [Google Scholar]
- Bevan M, Bancroft I, Bent E, Love K, Goodman H, Dean C, Bergkamp R, Dirkse W, Van Staveren M, Stiekema W, et al (1998) Analysis of 1.9 Mb contiguous sequence from chromosome 4 of Arabidopsis thaliana. Nature 39: 809–821 [DOI] [PubMed] [Google Scholar]
- Bhalerao R, Keskitalo J, Sterky F, Erlandsson R, Björkbacka H, Birve SJ, Karlsson J, Gardeström P, Gustafsson P, Lundeberg J, et al (2003) Gene expression in autumn leaves. Plant Physiol 131: 430–442 [DOI] [PMC free article] [PubMed] [Google Scholar]
- Bradford M (1976) A rapid and sensitive method for the quantification of microgram quantities of protein using the principle of protein dye binding. Anal Biochem 72: 248–254 [DOI] [PubMed] [Google Scholar]
- Brouquisse R, Masclaux C, Feller U, Raymond P (2001) Protein hydrolysis and nitrogen mobilisation in plant life and senescence. In JF Morot-Gaudry, PJ Lea, eds, Plant Nitrogen. Springer-Verlag, Berlin, pp 275–293
- Buchanan-Wollaston V (1997) The molecular biology of leaf senescence. J Exp Bot 48: 181–199 [Google Scholar]
- Buchanan-Wollaston V, Ainsworth C (1997) Leaf senescence in Brassica napus: cloning of senescence-related genes by subtractive hybridisation. Plant Mol Biol 33: 821–834 [DOI] [PubMed] [Google Scholar]
- Buchanan-Wollaston V, Earl S, Harrisson E, Mathas E, Navabpour S, Page T, Pink D (2003) The molecular analysis of leaf senescence—a genomics approach. Plant Biotechnol J 1: 3–22 [DOI] [PubMed] [Google Scholar]
- Christensen AB, Cho BH, Naesby M, Gregersen PL, Brandt J, Madriz-Ordenana K, Collinge DB, Thordal-Christensen H (2002) The molecular characterisation of the two barley proteins establishes the novel PR-17 family of pathogenesis-related protein. Mol Plant Pathol 3: 134–144 [DOI] [PubMed] [Google Scholar]
- Comparot S, Lingiah G, Martin T (2003) Function and specificity of 14-3-3 proteins in the regulation of carbohydrate and nitrogen metabolism. J Exp Bot 54: 595–604 [DOI] [PubMed] [Google Scholar]
- Costa P, Pionneau C, Bauw G, Dubos C, Bahrmann N, Kremer A, Frigerio JM, Plomion C (1999) Separation and characterisation of needle and xylem pine proteins. Electrophoresis 20: 1098–1108 [DOI] [PubMed] [Google Scholar]
- Crafts-Brandner SJ, Hölzer R, Feller U (1998) Influence of nitrogen deficiency on senescence and the amounts of RNA and proteins in wheat leaves. Physiol Plant 102: 192–200 [Google Scholar]
- Crafts-Brandner SJ, Klein RR, Klein P, Hölzer R, Feller U (1996) Coordination of protein and mRNA abundances of stromal enzymes and mRNA abundances of the Clp protease subunits during senescence of Phaseolus vulgaris (L.) leaves. Planta 200: 312–318 [DOI] [PubMed] [Google Scholar]
- Feller U, Fisher A (1994) Nitrogen metabolism in senescing leaves. CRC Crit Rev Plant Sci 13: 241–273 [Google Scholar]
- Fulgosi H, Soll J, de Faria Maraschin S, Korthout HA, Wang M, Testerink C (2002) 14-3-3 proteins and plant development. Plant Mol Biol 50: 1019–1029 [DOI] [PubMed] [Google Scholar]
- Gallardo K, Job C, Groot SPC, Puype M, Demol H, Vandekerckhove J, Job D (2001) Proteomic analysis of Arabidopsis seed germination and priming. Plant Physiol 126: 835–848 [DOI] [PMC free article] [PubMed] [Google Scholar]
- Gallardo K, Job C, Groot SPC, Puype M, Demol H, Vandekerckhove J, Job D (2002) Proteomics of Arabidopsis seed germination. A comparative study of wild-type and gibberellin seeds. Plant Physiol 129: 823–837 [DOI] [PMC free article] [PubMed] [Google Scholar]
- Gallardo K, Le Signor C, Vandekerckove J, Thompson RD, Burstin J (2003) Proteomics of Medicago truncatula seed development establishes the time frame of diverse metabolic processes related to reserve accumulation. Plant Physiol 132: 664–682 [DOI] [PMC free article] [PubMed] [Google Scholar]
- Gray JC, Row PE (1995) Protein translocation across chloroplast envelope membranes. Trends Cell Biol 5: 243–247 [DOI] [PubMed] [Google Scholar]
- Hanfrey C, File M, Buchanan-Wollaston V (1996) Leaf senescence in Brassica napus: expression of encoding pathogenesis-related proteins. Plant Mol Biol 30: 597–609 [DOI] [PubMed] [Google Scholar]
- He ZL, von Caemmerer S, Hudson GS, Price GD, Badger MR, Andrews JT (1997) Ribulose-1,5-bisphosphate carboxylase/oxygenase activase deficiency delays senescence of ribulose-1,5-bisphosphate carboxylase/oxygenase but progressively impairs its catalysis during tobacco leaf development. Plant Physiol 115: 1569–1580 [DOI] [PMC free article] [PubMed] [Google Scholar]
- Hörtensteiner S, Feller U (2002) Nitrogen metabolism and mobilisation during senescence. J Exp Bot 53: 927–937 [DOI] [PubMed] [Google Scholar]
- Jensen ES (1987) Seasonal patterns of growth and nitrogen fixation in field-grown pea. Plant Soil 101: 29–37 [Google Scholar]
- Koller A, Washburn MP, Lange BM, Andon NL, Deciu C, Haynes PA, Hays L, Schieltz D, Ulaszek R, Wei J, Wolters D, Yates III Jr (2002) Proteomic survey of metabolic pathways in rice. Proc Natl Acad Sci USA 99: 11969–11974 [DOI] [PMC free article] [PubMed] [Google Scholar]
- Komatsu S, Muhammad A, Rakwal R (1999) Separation and characterisation of proteins from green and etiolated shoots of rice (Oryza sativa L.): towards a rice proteome. Electrophoresis 20: 630–636 [DOI] [PubMed] [Google Scholar]
- Kruft V, Eubel H, Jänsch L, Werhahn W, Braun H-P (2001) Proteomic approach to identify novel mitochondrial proteins in Arabidopsis. Plant Physiol 127: 1694–1710 [PMC free article] [PubMed] [Google Scholar]
- Langer T (2000) AAA proteases: cellular machines for degrading membrane proteins. Trends Biochem Sci 25: 247–251 [DOI] [PubMed] [Google Scholar]
- Lhuillier-Soundele A, Munier-Jolain NG, Ney B (1999) Influence of nitrogen availability on seed nitrogen accumulation in pea. Crop Sci 39: 1741–1748 [Google Scholar]
- Majeran W, Wollmann FA, Vallon O (2000) Evidence for a role of ClpP in the degradation of the chloroplast cytochrome b6f complex. Plant Cell 12: 137–149 [DOI] [PMC free article] [PubMed] [Google Scholar]
- Marshall JS, Keegstra K (1992) Isolation and characterization of a cDNA clone encoding the major Hsp70 of the pea chloroplastic stroma. Plant Physiol 100: 1048–1054 [DOI] [PMC free article] [PubMed] [Google Scholar]
- Masclaux C, Valadier M-H, Brugière N, Morot-Gaudry J-F, Hirel B (2000) Characterisation of the source/sink transition in tobacco (Nicotiana tabacum L.) shoots in relation to nitrogen management and leaf senescence. Planta 211: 510–518 [DOI] [PubMed] [Google Scholar]
- Mathesius U, Keijzers G, Natera SHA, Weinman JJ, Djordjevic MA, Rolfe BG (2001) Establishment of a root proteome reference map for the model legume Medicago truncatula using the expressed sequence tag database for peptide mass fingerprinting. Proteomics 1: 1424–1440 [DOI] [PubMed] [Google Scholar]
- Matile P (1992) Chloroplast senescence. In NR Baker, H Thomas, eds, Crop Photosynthesis: Spatial and Temporal Determinant. Elsevier, Amsterdam, pp 413–440
- Millar AH, Sweetlove LJ, Leaver CJ (2001) Analysis of Arabidospis mitochondrial proteome. Plant Physiol 127: 1711–1727 [PMC free article] [PubMed] [Google Scholar]
- Nakashima K, Kiyosue T, Yamaguchi-Shinozaki K, Shinozaki K (1997) A nuclear gene, erd1 encoding a chloroplast-targeted Clp protease regulatory subunit homolog is not only induced by water stress but also by developmentally up-regulated during senescence in Arabidopsis thaliana. Plant J 12: 851–861 [DOI] [PubMed] [Google Scholar]
- Ney B, Duthion C, Fontaine E (1993) Timing of the reproductive abortions in relation to all division, water content, and growth of pea seeds. Crop Sci 33: 267–270 [Google Scholar]
- Noodèn LD, Guiamet JJ, John I (1997) Senescence mechanisms. Physiol Plant 101: 746–753 [Google Scholar]
- Pate JS (1985) Physiology of pea—a comparison with other legumes in terms of economy of carbon and nitrogen in whole-plant and organ functioning. In PD Hebblewaite, MC Heath, TCK Dawkins, eds, The Pea Crop. Butterworths, London, pp 279–296
- Peltier JB, Emanuelsson O, Kalume DE, Ytterberg J, Friso G, Rudella A, Liberles DA, Söderberg L, Roepstorff P, von Heijne G, et al (2002) Central function of the lumenal and peripheral thylakoid proteome of Arabidopsis determined by experimentation and genome-wide prediction. Plant Cell 14: 211–236 [DOI] [PMC free article] [PubMed] [Google Scholar]
- Peltier JB, Friso G, Kalume DE, Roepstorff P, Nilsson F, Adamska I, van Wijk KJ (2000) Proteomics of the chloroplast: systematic identification and targeting analysis of the lumenal and peripheral thylakoid proteins. Plant Cell 12: 319–341 [DOI] [PMC free article] [PubMed] [Google Scholar]
- Peoples MB, Dalling MS (1988) Proteolysis and amino acid metabolism. In LD Nooden, AC Leopold, eds, Senescence and Aging in Plants. Academic Press, New York, pp 182–217
- Pinheiro C, Chaves MM, Ricardo CP (2001) Alterations in carbon and nitrogen metabolism induced by water deficit in the stems and leaves of Lupinus albus L. J Exp Bot 52: 1063–1070 [DOI] [PubMed] [Google Scholar]
- Portis AR Jr (1992) Regulation of ribulose-1,5-bisphosphate carboxylase/oxygenase activity. Annu Rev Plant Physiol Plant Mol Biol 43: 415–437 [Google Scholar]
- Porubleva L, Vander Velden K, Jothari S, Olivier DJ, Chitnis PR (2001) The proteome of maize leaves: use of gene sequences and expressed sequence tag data for identification of proteins with peptide mass fingerprints. Electrophoresis 22: 1724–1738 [DOI] [PubMed] [Google Scholar]
- Quirino BF, Normanly J, Amasino RM (1999) Diverse range of gene activity during Arabidopsis thaliana leaf senescence includes pathogen-independent induction of defence-related genes. Plant Mol Biol 40: 267–278 [DOI] [PubMed] [Google Scholar]
- Rakwal R, Komatsu S (2000) Role of jasmonate in the rice (Oryza sativa L.) self-defence mechanism using proteome analysis. Electrophoresis 21: 2491–2500 [DOI] [PubMed] [Google Scholar]
- Riccardi F, Gazeau P, de Vienne D, Zivy M (1998) Protein changes in response to progressive water deficit in maize. Plant Physiol 117: 1253–1263 [DOI] [PMC free article] [PubMed] [Google Scholar]
- Saalbach G, Erik P, Wienkoop S (2002) Characterisation by proteomics of peribacteroid space and peribacteroid membrane preparations from pea (Pisum sativum) symbiosomes. Proteomics 2: 325–337 [DOI] [PubMed] [Google Scholar]
- Salekdeh GH, Siopongco J, Wade LJ, Ghareyazie B, Bennett J (2002) Proteomic analysis of rice leaves during drought stress and recovery. Proteomics 2: 1131–1145 [DOI] [PubMed] [Google Scholar]
- Salon C, Munier-Jolain NG, Duc G, Voisin AS, Grangirard D, Larmure A, Emery RJN, Ney B (2001) Grain legume seed filling in relation to nitrogen acquisition: a review and prospects with particular reference to pea. Agronomie 21: 539–552 [Google Scholar]
- SAS Institute (1988) SAS/STAT User's Guide. SAS Institute Inc, Cary, NC
- Schroda M, Vallon O, Wollman FA, Beck CF (1999) A chloroplast-targeted heat shock protein 70 (HSP70) contributes to the photoprotection and repair of photosystem II during and after photoinhibition. Plant Cell 11: 1165–1178 [DOI] [PMC free article] [PubMed] [Google Scholar]
- Shen S, Jing Y, Kuang T (2003) Proteomic approach to identify wound-response related proteins from rice leaf sheath. Proteomics 3: 527–535 [DOI] [PubMed] [Google Scholar]
- Shen S, Matsubae M, Takao T, Tanaka N, Komatsu S (2002) A proteomic analysis of leaf sheaths from rice. J Biochem 132: 613–620 [DOI] [PubMed] [Google Scholar]
- Silva P, Thompson E, Bailey S, Kruse O, Mullineaux CW, Robinson C, Mann NH, Nixon PJ (2003) FtsH is involved in the early stages of repair of photosystem II in Synechocystis sp PCC 6803. Plant Cell 15: 2152–2164 [DOI] [PMC free article] [PubMed] [Google Scholar]
- Sinclair TR, De Wit CT (1976) Analysis of the carbon and nitrogen limitations to soybean yield. Agron J 68: 319–324 [Google Scholar]
- Smart CM (1994) Gene expression during leaf senescence. New Phytol 126: 419–448 [DOI] [PubMed] [Google Scholar]
- Watson BS, Asirvatham VS, Wang L, Summer LW (2003) Mapping of the proteome of Barrel Medic (Medicago truncatula). Plant Physiol 113: 1104–1123 [DOI] [PMC free article] [PubMed] [Google Scholar]
- Wilson KA, McManus MT, Gordon ME, Jordan TW (2002) The proteomics of senescence in leaves of white clover, Trifolium repens (L). Proteomics 2: 1114–1122 [DOI] [PubMed] [Google Scholar]
- Yoshida S (2003) Molecular regulation of leaf senescence. Curr Opin Plant Biol 6: 79–84 [DOI] [PubMed] [Google Scholar]