Abstract
Prostate cancer (PCa) recurrences are often predicted by assessing the status of surgical margins (SM) – positive surgical margins (PSM) increase the chances of biochemical recurrence by 2–4 times which may lead to PCa recurrence. To this end, an electrical impedance acquisition system with a microendoscopic probe was employed in an ex-vivo study of human prostates. This system measures the tissue bioimpedance over a range of frequencies (1 kHz to 1MHz), and computes a number of Composite Impedance Metrics (CIM). A classifier trained using CIM data can be used to classify tissue as benign or cancerous. The system was used to collect the impedance spectra from 14 excised prostates, which were obtained from men undergoing radical prostatectomy, for a total of 23 cancerous and 53 benign measurements. The data revealed statistically significant (p<0.05) differences in the impedance properties of the benign and tumorous tissues, and among the measurements taken on the apical, base, and lateral surface of the prostate. Further, in the leave-one-patient-out cross validation, a maximum predictive accuracy of 90.79% was achieved by combining high frequency CIM phase data to train a support vector machine classifier with a radial basis function kernel. The observations are consistent with the physiology and morphology of benign and malignant prostate tissue. CIMs were found to be an effective tool in distinguishing benign from cancerous tissues.
Index Terms: Prostate Cancer, Electrical Impedance Spectroscopy, Minimally Invasive Surgery, Surgical Margin, Composite Impedance Metric
I. Introduction
Prostatic adenocarcinoma (PCa) is the most diagnosed form of cancer and the second leading cause of cancer-specific death in men in the USA. In 2015, 26% (220,800 men) of all diagnosed cancers in men are expected to be within the prostate, and approximately 27,540 men are expected to die of the disease [1]. Men that have higher risk prostate cancer often opt for radical prostatectomy (RP) as a curative therapy, with the Center for Disease Control reporting that over 100,000 radical prostatectomies are performed annually in the USA [2]. Nearly 4 out of 5 RPs are performed robotically, and the procedure is usually referred to as Robot-Assisted Laparoscopic Prostatectomy (RALP) [3]. RALP is an interventional procedure in which the entire prostate is removed from the body with the objective of eradicating all PCa, most commonly using a da Vinci surgical robotic system (Intuitive Surgical Inc., Sunnyvale, CA). In some cases, however, inspection of the final prostatectomy specimen will show that there is cancer microscopically at the edge of the gland, due to incision of the capsule or spread of cancer into periprostatic tissues. Such an instance is termed Positive Surgical Margin (PSM) and it can lead to recurrence of cancer in the years following the surgery. Currently, the routine protocol for margin assessment is to pathologically assess the excised prostate for PSM, which is used to determine if adjuvant treatment is necessary.
Patients with PSM are at a significantly increased risk of cancer recurrence [4]–[6]. Orvieto et al. reported that the ten-year biochemical disease-free survival rate for patients with PSMs was 59.9%, and the same statistic for patients with negative surgical margins (NSM) was 89.6% [5]. Further, in combination with several other risk factors including extra capsular extension and Gleason grade (a tissue architecture feature used to characterize the aggressiveness of prostate cancer and to assess prognosis [7]), surgical margin status is still useful as an independent indicator of risk for biochemical recurrence [8]. Thus, an intraoperative device that can assess the status of surgical margins in real-time, thereby enabling the surgeon to remove positive margins (with the objective of achieving NSM), would potentially reduce the incidence of PCa recurrence following RALP.
At present, no routine procedures or technology is used in the OR for intraoperative detection of cancer at the margins. A fraction of hospitals have been evaluating the histology-based intraoperative frozen section (IFS) technique for assessing margin status [9], [10], and a limited number of studies have noted its efficacy [10]–[13]. However, each IFS sample requires at least 20 minutes for evaluation [13], samples a small tissue volume [14], and disrupts the surgical workflow as it requires the robot to be dedocked to retrieve the sample.
Towards development of system that can intraoperatively assess surgical margins, several research groups have evaluated the use of optical and photodynamic techniques for the detection of prostate cancer. Salomon et al. reported a method incorporating triple spectroscopy (laser-induced auto fluorescence, white-light remission, and high-frequency impedance) to distinguish between benign and malignant prostatic tissue with a specificity of 87.3% and a sensitivity of 87.5% in an ex vivo study [15]. Using a dual spectroscopy approach (auto-fluorescence and light reflectance), Sharma et al., achieved an accuracy of 85–90% (depending on cancer grade) in classifying benign and malignant tissues [16]. Previous studies by our group reported statistical significance between benign and prostatic adenocarcinoma using a coaxial cable based bipolar probe [17], [18]. Other approaches include methods based on diffuse optical tomography [19], optical coherence tomography [20], and coherent anti-Stokes Raman scattering [21]. While these techniques are promising, their potential for clinical translation and miniaturization for robotic surgeries remains unclear.
To achieve the ultimate goal of developing an intraoperative surgical margin assessment system for use during RALP, this study reports the results from an ex vivo human prostate study performed using an electrical impedance acquisition system [22], with a microendoscopic impedance probe [23]. The microendoscopic probe measures 11 mm in diameter making it suitable for introduction into the surgical cavity through one of the abdominal ports used by the robot to introduce surgical instruments into the operating site. This system leverages tissue electrical impedance as a biomarker to distinguish between benign and cancerous tissues [17], [24], [25]. Using this system, 14 human prostates were evaluated after they had been resected during a RALP procedure. A total of 23 cancerous and 53 benign impedance measurements were recorded from the excised prostates. For each measurement, composite impedance metrics (CIM) were calculated and used for data analysis. Methods were developed to classify a tissue site as being either benign or cancerous and a confidence value was computed for each classification. Image patches corresponding to the classification and confidence level can be generated and displayed to provide the surgeon with an intraoperative image of surgical margin status.
This paper is organized as follows. Section II (methods), describes the data collection process and composite impedance metrics. Section III summarizes results from hypothesis tests for statistical significance, receiver-operating characteristics (ROC) analysis, area under the curve, and the leave-one-patient-out cross validation. In Section IV, we discuss the prostate data in detail, including the physiological and morphological basis for using electrical impedance for cancer detection. A short conclusion completes the paper. Preliminary results from this study were presented at a conference [26].
II. Methods
Impedance data was recorded from several locations on the excised prostates, including the surface of the excised prostate, and the exposed surface of the sectioned (sliced) prostate (specified in section II.C). These surfaces are henceforth referred to as the exterior and interior surface respectively. The electrical impedance acquisition (EIA) system used in this study comprises a data acquisition (DAQ) unit and a microendoscopic impedance-sensing probe. Following subsections detail the impedance DAQ system, prostate data collection protocol, and the composite impedance metric that is used in this study for analysis of prostate bioimpedance measurements.
A. Impedance Measurement Hardware Description
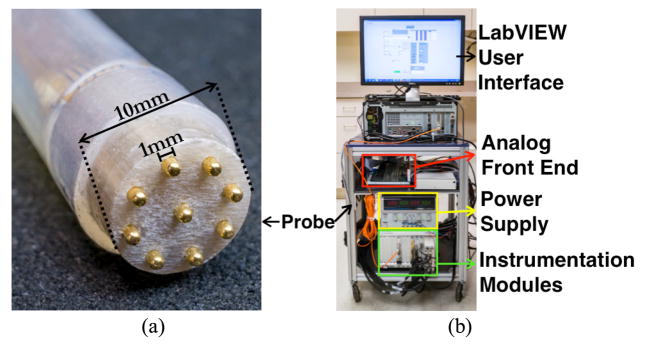
To measure tissue bioimpedance, the electrical impedance acquisition system applies a sinusoidal signal (voltage or current) between a pair of electrodes in the microendoscopic 9-electrode probe (Fig. 1), while the probe is in contact with the tissue under test. Under excitation, the electric potential induced at all electrodes is recorded using the DAQ unit. For any combination of source and sink electrode, tissue impedance can be computed from the measured voltages and currents using Ohm’s law. To reduce errors in impedance measurements due to contact impedance at the tissue-electrode interface, a tetrapolar measurement technique (also known as the 4-wire method) is used. A high-speed electrical impedance sensing system, capable of using up to 32 electrodes, was designed to record data [27] (Fig. 1b).
Fig. 1.
(a) Microendoscopic impedance probe with 9 electrodes used in this study, (b) Electrical impedance acquisition (EIA) system used for data collection.
For this study, a 9-electrode microendoscopic probe was fabricated to record impedance measurements within a 10mm diameter region (Fig. 1a). The probe consists of a 0.5m long, 10 mm ID (inner diameter) silicon rubber tube (5041K76, McMaster Carr, Elmhurst, Illinois) that houses (i) the probe tip housing constructed with electrical-grade G-9 type garolite (McMaster Carr, Elmhurst, Illinois), (ii) nine 1mm diameter gold electrodes (205089-4-ND, DigiKey), (iii) nine 24 gauge Teflon coated cables interfacing the electrodes to the EIA system. All materials and the medical grade epoxy (30673, Ellsworth Adhesives) used in probe construction can withstand repeated sterilization and are suitable for intraoperative use. This probe is sufficiently small to fit within a standard 12 mm laparoscopic port used during RALP.
To study the efficacy of using this system to measure bio-impedance as a biomarker to distinguish between benign and malignant tumors, an ex-vivo study was performed (as a precursor to in-vivo experiments) on 14 human patients. Impedances were recorded from excised prostates by driving current through multiple pairings of electrodes in contact with the prostate, and recording the voltage induced at all other electrodes.
The electrical impedance acquisition system [22] used in this study is capable of applying current or voltage signals at frequencies ranging from 100 Hz to 10 MHz; however, the parasitic impedances associated with the multiplexer and the passive probe cable (~0.5m long), were the limiting factors in selecting the frequency range for this study (1 kHz – 1 MHz). Measured signals can also be averaged at an averaging factor of 2 to 16384. The instrument can acquire data at frame rates exceeding 100 Hz at signal frequencies ≥10 kHz. The signal-to-noise ratio (SNR) with 8 averages is over 90 dB across the frequency spectrum. The instrument’s voltage measurement reciprocity error is less than 0.5% and 1% at signal frequencies up to 100 kHz and 1 MHz respectively.
The EIA system utilizes Field Programmable Gate Arrays (FPGA) for signal sampling, averaging and spectral characterization. Using a Discrete Fourier Transform (DFT) block implemented on the FPGA, the EIT system can calculate the noise power associated with each voltage measurement at an individual electrode for each input signal frequency. The noise power metric is the sum (L1 norm) of all harmonics (magnitudes) in the DFT output computed on the FPGA, excluding the fundamental and DC components. The FPGA computes a 512-point DFT spectrum, and there are 255 unique harmonics (not counting fundamental and DC components). When the sum of magnitudes of the 255 harmonics exceeds 1 (~3.9 mV per harmonic), the voltage measurement corresponding to the fundamental harmonic is considered unreliable (this could be due to improper tissue-electrode contact, extremely low or high load impedance, etc.). In comparison, at the voltage injecting electrode, the fundamental harmonic magnitude (L2 norm) is usually observed at ~0.58 volts.
B. Impedance Measurement Technique
Impedance spectra were recorded at several probed sites on the exterior and interior surface of the prostate. For each probe site, impedance data is acquired by sequentially driving an excitation signal through multiple combinations of electrode-pairs such that each electrode-pair denotes a so-called ‘pattern’. For example, in a nine-electrode system, the measurement of current flow between two current driving electrodes, and induced voltage recorded from 7 voltage sensing electrodes constitutes a single pattern-data (Fig. 2). For this study, data was collected for several electrode-pair patterns under current excitation. The data was acquired for 72 electrode-pair patterns at 28 discrete frequencies ranging from 1 kHz – 1 MHz. For each electrode-pair pattern, 512 voltage samples from an integer number of cycles of the sine wave are acquired at every electrode. For our experiments, 64 sample sets containing 512-points each are averaged together to increase SNR. The system requires ~55 seconds to acquire a full spectrum (28 frequencies) of data from each probing site when 72 patterns are used and signal averaging is set to 64. The system acquired data for 72 electrode-pair patterns for a 9-electrode probe (# of exhaustive pattern combinations = n*(n-1); n=9 => # of patterns = 72). In this study we used a subset of these patterns; full dataset can be used for Electrical Impedance Tomography (EIT), which is an intended future study outside the scope of this work.
Fig. 2.
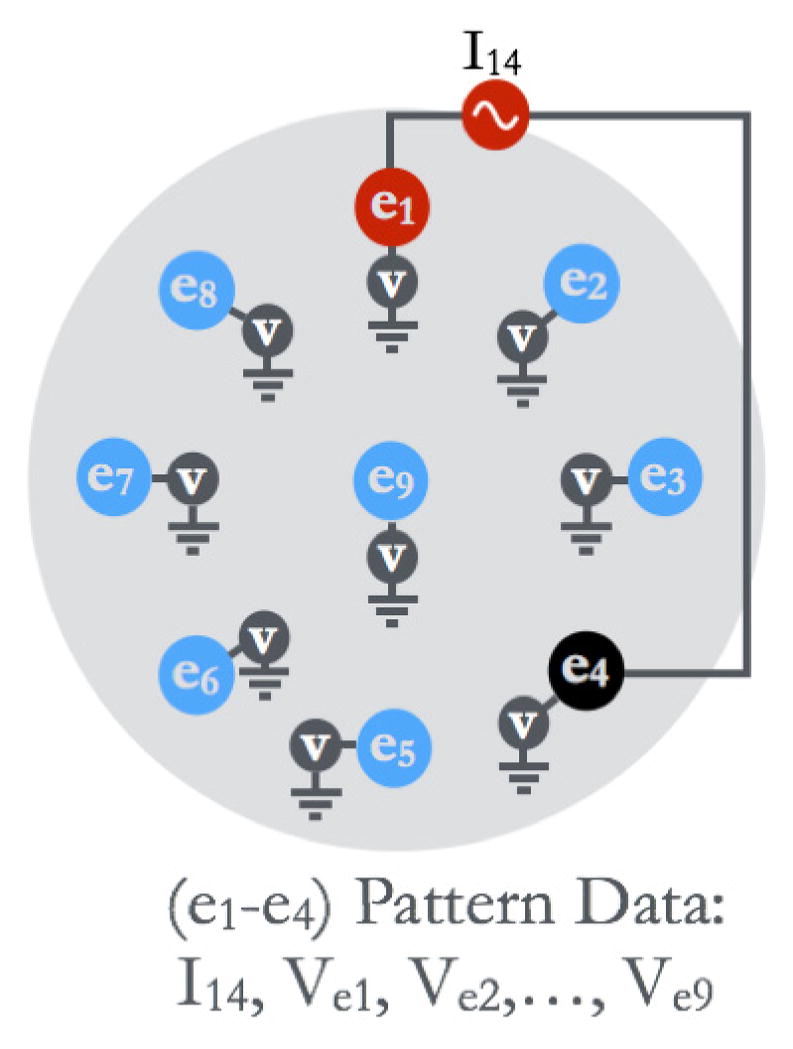
An illustration of data collection in EIA for a single ‘pattern’. Electrode 1 (e1) and electrode 4 (e4) were used to apply the current signal, and the induced electric potential was measured at all electrodes. The data corresponding to the (e1–e4) pattern consists of current measurement (I14), and measured voltage at all electrodes.
C. Prostate Procurement and Histological Assessment
All ex-vivo prostate experiments were performed at Dartmouth-Hitchcock Medical Center (DHMC, Hanover, NH, USA), under an Institutional Review Board (IRB) approved protocol. Prior to a patient undergoing RALP procedure, the surgeon (Dr. Elias Hyams) obtains a consent form signed by the patient. After the surgery, the excised prostate is placed in an airtight bag and transported immediately to a pathology laboratory, where a pathologist measures the size and weight of the prostate.
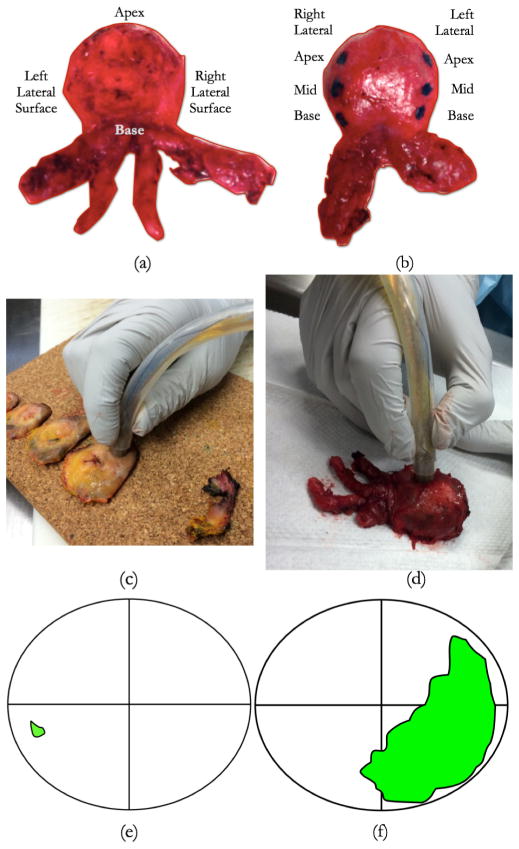
Following these measurements, impedance data is recorded by probing the exterior surface of the prostate. Each prostate is probed on the exterior surface at the apex, base, and on the right and left posterior lateral surfaces (these represent locations with high incidences of positive surgical margins) (Fig. 3). The probed site is marked with green ink to enable its delineation during microscopic evaluation. Following these exterior surface measurements, the prostate is sectioned into ~3mm thick tissue slices. The prostate slices are arranged on a corkboard in the order in which they were sectioned (Fig. 3c). Each slice can be divided into four quadrants; right posterior, left posterior, right anterior, and left anterior. In each quadrant, a circular region of 10mm diameter is probed using the EIA system. A total of 4–8 quadrants from the entire slice-set are probed to obtain the intraprostatic impedance measurements. Following data acquisition, the prostate slices are fixed in formalin for microscopic analysis.
Fig. 3.
(a) Prostate exterior surface probing sites. Prostate is probed at 3 sites (inked) on the right and left posterior lateral surfaces, 4 sites around the apex, and 1 site at the base. (c) Prostate interior surface being probed at the right posterior location using the impedance probe. Prostate was sliced by a pathologist and placed on a cork board for evaluation, (d) Prostate being probed on the exterior surface using the impedance probe, (e) an example of a ‘benign’ probing site, identified using the histological maps provided by the pathologist. Green spot represents the location of malignant tissues within the slice, (f) an example ‘malignant’ probing site; data collected from the right posterior (lower right) side of slice in (e) is labeled ‘malignant’, whereas data collected from the right posterior side of slice in (f) is labeled benign.
Each prostate quadrant was microtomed and stained with Hematoxylin and Eosin (H&E) for microscopic review using a procedure we have previously developed [23]. An experienced pathologist (Dr. Alan Schned) reviewed the stained tissue samples from each quadrant probed, identified regions of PCa and delineated the PCa boundaries with a marking pen. The boundaries are then transferred onto a slice map where the cancerous region can be observed with respect to each quadrant. These maps were used as ground truth to label the impedance datasets for classifier training and testing. Our group has used this approach in the past [23]. These histology maps are used to label each probed site as ‘benign’ or ‘malignant’ (fig. 3e–f). The impedance data corresponding to prostate slice quadrants that contained >75% PCa within the probed region were labeled ‘malignant’, and the impedance data corresponding to prostate slice quadrants that did not contain PCa were labeled ‘benign’. Cancer containing quadrants with <75% PCa were not included in this analysis.
D. Composite Impedance Metric (CIM)
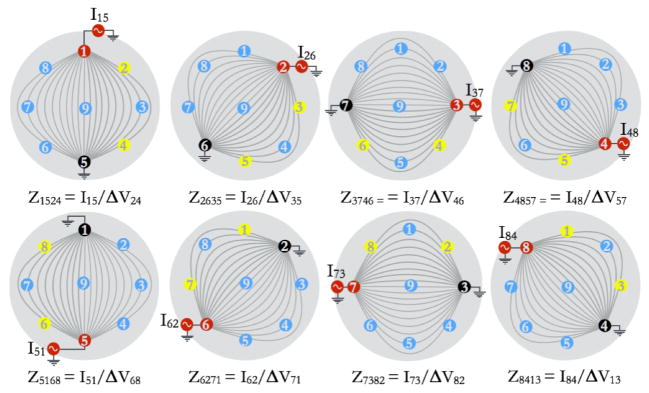
A CIM can be calculated for each electrode-pair pattern type, by averaging the complex impedances obtained for a set of tetrapolar patterns that are geometrically similar. Figure 4 illustrates a CIM for a current source and current sink electrode-pair combination of electrode 1 and electrode 5. This CIM is referred to as CIM1524, where the subscripts refer to the current source-sink combination of electrode 1 and electrode 5, and voltage difference measured across electrode 2 and electrode 4. The subscript ‘1524’ in this case represents the CIM obtained by averaging all non-reciprocal patterns that are geometrically similar to the pattern 1524, such as pattern 2635, pattern 3746, and so on. For example, CIM1524 is calculated using the following equation:
| (1) |
where Zijkl represent the complex-valued impedance computed when current is injected through electrode i and sunk through electrode l, and a voltage difference is measured between electrode j and k.
Fig. 4.
Illustration to show the patterns used for computing CIM1524, which is an average of 8 impedances values as shown in the figure. The 8 impedances values used are: Z1524, Z2635, Z3746, Z4857, Z5168, Z6271, Z7382, Z8413. Notice that the subscript ‘1524’ in CIM1524 is only used as an index to represent an average of data acquired for the 8 patterns shown here. These 8 patterns are ‘corresponding’ in the sense that each pattern is a rotated version of pattern 1524 (current applied through electrodes 1 and 5, and potential difference sensed across electrodes 2 and 4).
The CIMs can be used as features for classification algorithms; to create a feature set for classification, multiple complex-valued CIMs were computed at each signal frequency for probed sites on the exterior and interior surface of the prostate.
III. Results and Analysis
A. Exterior Measurements
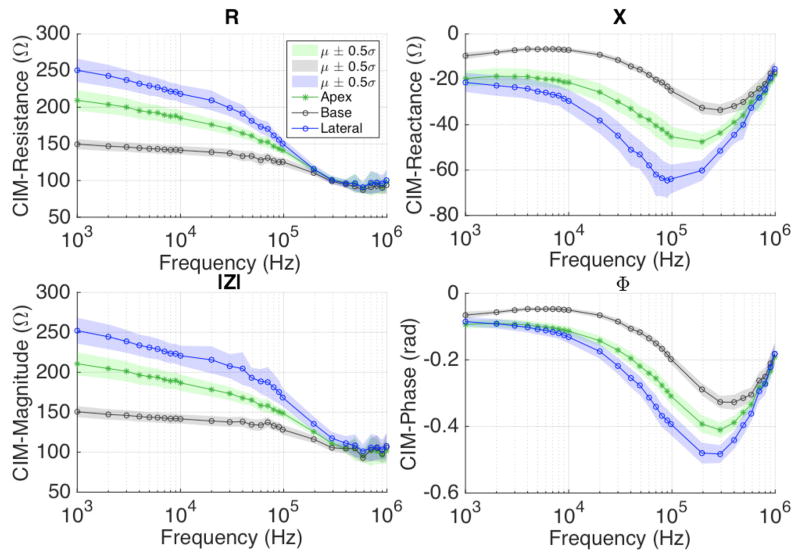
Impedance data collected on the exterior surface of the prostate was grouped according to their location, i.e., apex, base and lateral surface. The apex, base and right and left lateral surface of the prostate were probed four, one and three times each (base, mid and apex), as shown in Fig. 3b. CIMs were computed for each probed site at all frequencies, and were averaged together according to their location on the prostate (i.e. apex, base, or lateral aspects). For one out of the 14 patients, impedance data on the exterior surface could not be collected due to a delay in acquiring the prostate specimen from the operating room. Overall, there were 13, 78, and 52 CIM data points recorded from the base, lateral surface, and apex, respectively. The CIM data for these impedance measurement types (by location) were averaged to calculate the mean CIM spectra (Fig. 5). The noise power metric returned by EIA system at the source electrode was used to filter out unreliable measurements. Since the mean CIM is a complex quantity, we can calculate the associated resistance (R), reactance (X), magnitude (|Z|), and phase (ϕ) components of CIM, as the real, imaginary, magnitude, and angle component of CIM, respectively. Figure 5 shows the R, X, |Z|, ϕ spectra of mean CIM1524 corresponding to the apex, base and lateral surface measurements over the signal frequency range (1kHz – 1MHz).
Fig. 5.
CIM1524 plots show resistance (top left), reactance (top right), magnitude (bottom left), and phase (bottom right) spectra for apex, base and lateral surface measurements. Differences in CIM properties can be observed.
To compute the mean (μ) and standard deviation (σ ), of CIM components (R, X, |Z|, ϕ), the data within 5th and 95th percentile was used. It can be observed that the impedances vary corresponding to the prostatic tissue being probed. The trend suggests that the R and |Z| of CIM1524 is highest at the lateral prostatic tissues, and lowest at the base prostatic tissues at a given frequency, with a maximum mean resistance (at 1kHz) of 149.6 Ω, 207.9 Ω and 250.4 Ω at the base, apex and lateral surfaces, respectively. The reactance and phase angle show an opposite trend; for example, the mean reactance of CIM1524 at 100kHz was −24.9 Ω, −44.9 Ω, −63.2 Ω, at the base, apex and lateral surface, respectively. These plots suggest that bioimpedance varies with respect to prostate anatomy.
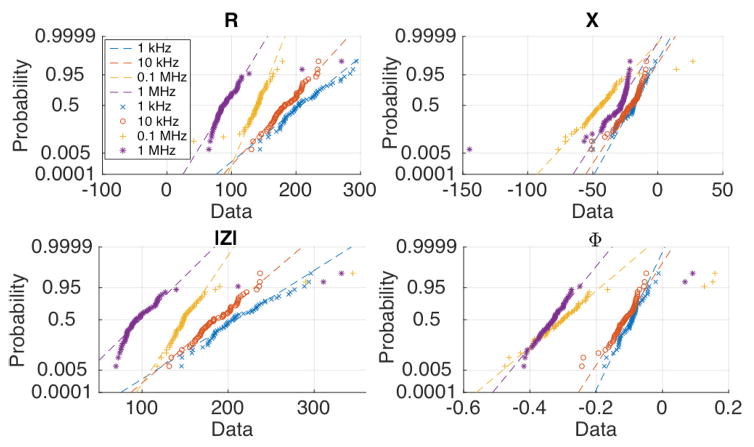
To test the assumption of data (CIM1524) being drawn from a uniformly distributed population, probability plots were generated, fig. 6. With the exception of a fraction of outliers, the CIM properties appear to be normally distributed; as a result, t-statistic was used for hypothesis tests (assuming unequal variance) to evaluate whether the differences in apex, base, and lateral surface CIM1524 are statistically significant. The t-statistic was calculated for differences in mean CIM-R, mean CIM-X, mean CIM-|Z|, and mean CIM-ϕ, by first taking into account all of the data without removing any outliers. Next, the hypothesis test was repeated with outliers extending beyond the 5th and 95th percentile being removed. Data points exceeding the noise power threshold were removed in both of the hypothesis test scenarios (with and without outlier removal), since the system can detect such unreliable data points automatically. Unacceptable noise power was observed in 1%, 4.6% and 3.8% of total voltage measurements from the apex, base, and lateral surface measurements, respectively, and these data points were removed. Hypothesis testing revealed statistically significant differences for the test statistic for all four CIM quantities (R, X, |Z|, ϕ), and all three pairs of the apex, base, and lateral surface CIMs. Table 1 summarizes the results.
Fig. 6.
Probability plot of Composite Impedance Metric (CIM) properties measured on the exterior surface. Out of the four CIM properties (R, X, |Z|, ϕ), the phase data appears to most closely conform with the assumption of normality.
TABLE I.
Hypothesis Testing To Compare CIM1524 Data For Apex, Base, And Lateral Surface Measurements
| CIM Property | Frequency range (kHz) with p-value < 0.05
|
|||
|---|---|---|---|---|
| Lateral-Apex | Apex-Base | Lateral-Base | ||
| With OR | R | 20–100 | 1–100 - {50} | 1–100 |
| X | 9–400 | 1–400 | 1–600 | |
| |Z| | 20–400 | 1–200 - {50} | 1–300 | |
| Φ | 20–500 | 1–500 | 2–500 | |
|
|
||||
| Without OR | R | 2–90 - {3,6} | 1–90 | 2–500 |
| X | 7–400 - {20} | 1–400 | 1–400 - {20,40, 50} | |
| |Z| | 20–400 | 1–90 | 1–200 | |
| Φ | 2–400 -{3,6,300} | 1–900 - {600} | 2–500 | |
OR: Outlier Removal (data beyond 5th and 95th percentile was removed)
The numbers represent range of signal frequencies for which the null hypothesis that the two datasets had same population mean can be rejected at a significance level of 0.05 (p-value<0.05). A t-test was performed. The numbers in the brackets list the frequencies that are exception within the given range of signal frequencies.
With outliers removed (beyond 5th and 95th percentile), the reactance (X) and phase (ϕ) components of CIM1524 provide a large range of signal frequencies (9–400 kHz and 20–400 kHz, respectively) where electrical properties are significantly different for apex, base, and lateral surface measurements. Further, with the exception of 50 kHz at the Apex-Base hypothesis test, signal frequencies 20–100 kHz had a CIM1524 that was significantly different for apex, base, and lateral surface measurements. Excluding 50 kHz, all four CIM1524 components (R, X, |Z|, ϕ) were significantly different for apex, base and lateral surface measurements.
Without outlier removal, the CIM1524 magnitude (|Z|) shows significant differences in the frequency range 20–90 kHz. CIM1524 phase (ϕ) shows significant differences for the frequency range 2–400 kHz, with an exception of 3, 6, and 300 kHz. Keeping the outliers does not significantly alter the frequency range where resistance and reactance components of CIM1524 show statistically significant differences.
Overall, at 30 kHz, and 60–90 kHz, all four CIM1524 components (R, X, |Z|, ϕ) are significantly different for apex, base, and lateral measurements, with or without outlier removal. If the data beyond 8th and 92nd percentile is discarded as outlier, all four CIM1524 components were found to be significantly different for apex, base and lateral surface measurements in the frequency range 1–100 kHz. Additionally, it can be noted that the resistance component does not show significant differences in the higher frequency range (>100 kHz). This can be attributed to the fact that as the signal frequency increases, the reactive components begins to draw more current (than the current drawn at low frequencies), which leads to a reduction in measured resistance at higher frequencies and ultimately results in the differences in resistance component of CIM being not significant.
B. Interior Measurements
The impedance data collected on the prostate slices was grouped into two categories: benign and malignant. Impedance data collected from a site (one of the quadrants of the prostate slice) was labeled as benign, if the quadrant that was probed was devoid of any PCa (identified using histologist’s report). Similarly, if the quadrant had majority cancer (>75% PCa), the impedance data collected from that quadrant was labeled as malignant. Based on the pathologists report, 53 quadrants (and the corresponding impedance measurements) were labeled benign, and 23 quadrants were labeled malignant. Additionally, 33 probed locations were found to have partial presence of malignant tissues; because an exact registration between the probed site and cancerous regions could not be established for these measurements, they were not included in this study. Subsequently, CIM1524 spectra were computed for the benign and malignant impedance data.
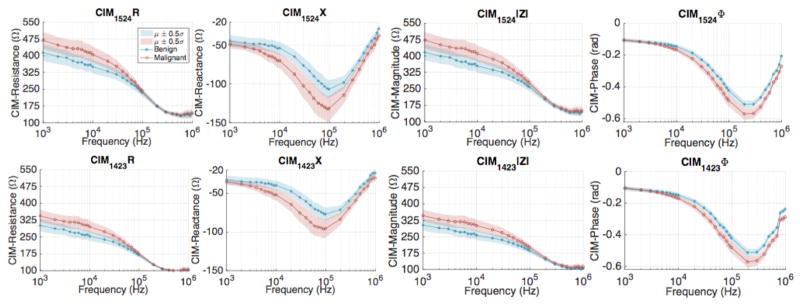
Figure 7 shows the R, X, |Z|, ϕ spectra of mean CIM1524 corresponding to the benign and malignant measurements over the signal frequency range (1kHz–1MHz). The trend apparent from these plots suggests that the resistance and magnitude components of CIM1524 are higher for malignant data. At 1 kHz, the mean resistance of CIM1524 is 300.9Ω for benign tissue as compared to 344.5Ω for the malignant tissue. Similarly, the mean magnitude of CIM1524 at 1kHz was 303.5Ω and 347.2Ω, for benign and malignant tissues, respectively.
Fig. 7.
Comparison of CIM spectra plotted using data collected from all 14 patients; CIM1524 (top row) and CIM1423 (bottom row).
Since the reactive component at 1kHz is very low in comparison to the resistive component, the overall magnitude turns out to be close to the resistive component at low frequencies. The mean reactance and phase components of CIM1524 also show contrast between benign and malignant tissues, with a mean reactance of −76.8Ω for benign measurement, as compared to the −95.9Ω for the malignant measurement. Similarly, at 200 kHz, the mean phase component of CIM1524 was computed to be −0.51 radians and −0.57 radians for the benign and malignant measurements, respectively. In summary, all four components of CIM1524 show contrast between benign and malignant tissues.
Similar to our evaluation of exterior surface measurements, a hypothesis test was performed to check the null hypothesis that the benign and malignant measurements have the same mean. The probability plots (not shown) ensured that the data was sampled from a uniformly distributed population. Thus, a t-statistic was used for hypothesis tests (assuming unequal variance). The t-statistic was calculated for differences in mean CIM components, with and without removing the outliers. Data points that exceeded the noise power threshold were removed in both of the hypothesis test scenarios (with and without outlier removal), which resulted in 0.6% and 1% of total voltage measurements being removed from the benign and malignant measurements, respectively.
Hypothesis tests showed statistically significant differences for the test statistic for all four CIM quantities (R, X, |Z|, ϕ), for benign and malignant measurements (Table 2). The table suggests that the largest frequency range with significant CIM differences occur for the CIM-phase (ϕ) component, with ϕ differences being significant in the 10–1000 kHz range. Similarly, CIM-X is significantly different for benign and malignant tissues in the 5–200 kHz frequency range. The resistance and reactance differences are only significant in the 5–30 kHz range and 5–50 kHz range, respectively. The frequency range with significant CIM difference expands with outliers (data beyond 5th and 95th percentile) being removed. The CIM-phase is significantly different over a larger range of frequency, and is a strong candidate for being used as a feature in classifying benign and malignant tissues.
TABLE II.
Hypothesis Testing To Compare CIM1524 Data for Benign And Malignant Measurements
| CIM Property | Frequency range (kHz) with P-value < 0.05
|
|
|---|---|---|
| Malignant-Benign (with OR) | Malignant-Benign (without OR) | |
| R | 4–50 | 5–30 |
| X | 5–1000 | 5–1000 -{300,500,700,800} |
| |Z| | 4–100 | 5–50 |
| Φ | 7–1000 | 10–1000 |
OR: Outlier Removal (data beyond 5th and 95th percentile was removed)
The numbers represent range of signal frequencies for which the null hypothesis that the two datasets had same population mean can be rejected at a significance level of 0.05 (P-value<0.05). T-test was performed. The numbers in the parenthesis list the frequencies that are exception within the given range of signal frequencies.
Lastly, among the external measurements, 1%, 4.6% and 3.8% of total voltage measurements from the apex, base, and lateral surface measurements, respectively, were removed. In comparison, only 0.6% and 1% of voltage measurements were removed from benign and malignant measurements, respectively. There are a few factors that might have led to higher percentage of unacceptable noise power in the external measurements. The external surface of the prostate was exposed to the air, and became more dehydrated than internal tissue because it was exposed to the air for a longer period of time prior to probing; the larger impedance associated with a dehydrated prostatic capsule could cause a subset of measurements to have unacceptable noise power. Further, the internal prostate slice surface is relatively flat compared to the external surface; this results in electrodes-tissue contact being more consistent in the internal surface. In contrast, the external surface has varying degree of curvature depending on location; this might lead to lower contact area between electrode and the tissue for some electrodes. Both of these issues (dehydrated surface and uneven surface) could result in higher levels of noise power in the external measurements.
C. Classification
Hypothesis tests confirmed that the EIA instrument was able to sense electrical property differences between benign and malignant tissues, as measured using CIM1524. In this section, we show the receiver operating characteristic (ROC) data for a classifier trained using the CIM1524 data, and discuss ways to combine multiple types of CIMs and CIM properties for classifying the measurement as benign or malignant.
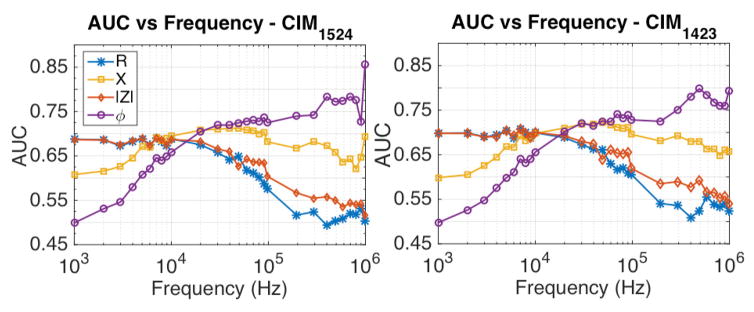
Using the CIM1524 data, ROC curves and the associated area under curve (AUC) were calculated at each operating signal frequency, fig. 8. The AUC plots show that the thresholding based classifier has higher probability of classifying malignant measurement as malignant using the CIM-R and CIM-|Z| data over the low frequency range, than the higher frequency CIM-R and CIM-|Z| data. Similarly, the CIM-X and CIM-ϕ AUC plots suggest that the thresholding based classifier affords higher probability of classifying a malignant measurement as malignant using the high frequency CIM-ϕ data. The ROC analysis was repeated using CIM1423 and confirmed the trends observed in the AUC plots obtained using CIM1524 data, fig. 8.
Fig. 8.
Comparison of AUC over frequency using CIM1524 and CIM1423. The phase data at high frequencies (>100 kHz) offers higher AUC than the AUC resulted by using other CIM properties.
To evaluate the predictive value of using CIM data to distinguish between benign and malignant morphologies, a leave-one-patient-out (LOPO) cross validation strategy was used. The training dataset was formed by using data acquired from all but one patient, and was used to train a radial basis function (RBF) kernel based Support Vector Machine (SVM) classifier. The predictive accuracy obtained using CIM1524 data is shown in the Fig. 9; it can be observed that the CIM1524-ϕ data at 1 MHz leads to highest predictive accuracy of 80.75%.
Fig. 9.
Predictive accuracy obtained using the CIM properties for different CIMs. Figure legend included in the top-left plot. High frequency phase data generally led to predictive accuracy > 75% at select frequencies. By combining high frequency phase data in the manner described in this paper, a maximum predictive accuracy of 90.79% was achieved. Fig. 10 shows the arrangement of CIM patterns reported in this figure.
The ROC, AUC, and predictive accuracy tests were further extended to evaluate if any other type of CIMs afforded higher AUC and accuracy. Eight of the CIMs that were used for this evaluation have been graphically represented in Fig. 10. First six of the eight electrodes were chosen by keeping the source and sink fixed at electrode 1 and 5, respectively, and by sensing the voltage difference at several other electrodes with reference to electrode 2. Similarly, last two of the eight CIMs were chosen by keeping source and sink fixed at electrode 1 and 4, and by measuring the potential difference at electrode 3 and 9 with reference to electrode 2. The corresponding cross validation accuracy plots for these CIM types have been shown in Fig. 9. In general, the CIM-ϕ data provides the highest AUCs at signal frequencies exceeding 100 kHz, with CIM1527-ϕ resulting in ~80.4% accuracy at 300 kHz, and CIM1523-ϕ resulting in ~82.6% accuracy at 1 MHz.
Fig. 10.
The 8 CIM pattern types that were used for the analysis resulting in Fig. 9.
Further, since each CIM represents the response of a different tissue morphology, combination of CIMs were tried to evaluate potential improvements in the classification accuracy. Based on the AUC and predictive accuracy plots corresponding to each CIM, following trend was observed. CIMs that were calculated using potential difference across electrodes that were relatively further apart (e.g. CIM1524), resulted in large potential difference across the sensing electrodes by virtue of their geometrical arrangement. Such CIMs usually led to high classifier AUC (≥ 0.8) and accuracy (≥ 0.75) at signal frequencies exceeding 100 kHz, when the classifier was trained and tested on the CIM-ϕ data; e.g. CIM1524-ϕ and CIM1526-ϕ. To test the SVM-based classifier on a combination of CIM data, the phase data from CIMs that led to AUC of at least 0.75 was pooled together (total 17 features), with data acquired at each signal frequency (for a single CIM) defined as an independent feature.
Next, the SVM-based classifier was used to perform leave-one-patient-out (LOPO) cross validation using the selected CIM dataset. Using the entire feature set, led to a predictive accuracy of 69.5%. To identify the most discriminative set of features that maximize predictive accuracy, combinations of n (= 2, 3, 4, 5) features from the feature set containing a total of 17 features were tried (referred to as best-n feature trials). We found that a combination of two CIMs (CIM1524, CIM1526), led to LOPO cross validation accuracy of 90.3%. Further, by using three and four of the 17 features, the classification accuracy was 89.7% (approximately same). The predictive accuracy reduced slightly to 88.7% when 5 of the best case feature combinations were used. High frequency CIM1524-ϕ and CIM1526-ϕ data were common features in the feature combinations that led to highest predictive accuracy in the best-n feature trials.
Overall, by combining the CIM-ϕ data, the maximum accuracy achieved was 90.3%, using the best-two feature set. Further, to find an optimal threshold that maximizes the product of specificity and sensitivity towards cancer detection of the SVM-based classifier, an ROC analysis was performed by thresholding the RBF-kernel-based raw SVM score; ROC curve has been shown in Fig. 11. At optimal threshold that maximizes predictive accuracy, the predictive accuracy was found to be 90.8% with a specificity of 94.3% and a sensitivity of 82.6%.
Fig. 11.
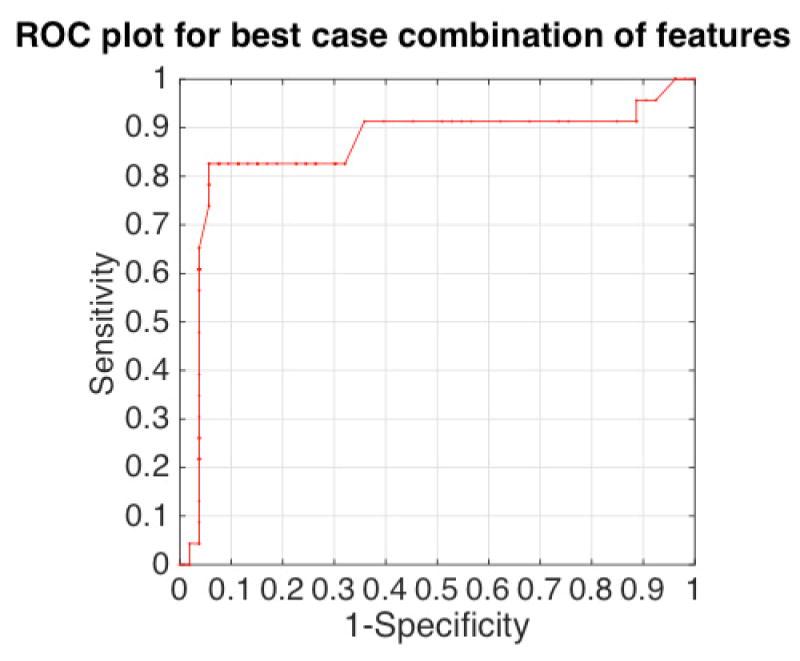
ROC curve obtained by thresholding the raw support vector machine classifier score. The classifier was trained and tested using CIM features (R, X, |Z|, ϕ), at specific frequencies (AUC>0.75 at a frequency, Fig. 8). The resulting area-under-curve (AUC) was found to be 0.86.
IV. Discussion
A. CIM Patterns and Intraprostatic Measurements
In order to show that the differences in electrical properties of benign and malignant tissues are significant (as sensed by our EIA system), the exterior and interior measurements in the previous section were analyzed using the CIM1524 data. The ROC, AUC, and accuracy tests performed using several other CIM patterns suggested that only a few CIM patterns led to high predictive accuracy (>70%) in the leave-one-patient-out cross validation. These findings were not completely surprising; their correlation with the tissue physiology can be understood as follows.
The EIA system applies an ac current on the order of 1–10 mA (amplitude varies with signal frequency), and the amplitude of applied current does not change as the system switches through the source-sink electrode combinations (or ‘patterns’) at a given signal frequency. If the tissue medium is assumed to be homogenous, the amplitude of induced potential at all other electrodes varies in proportion to a geometry factor, which in turn depends on the distance between the source and the sink electrode. This is the reason why CIM patterns such as CIM1524, were expected to be more sensitive to changes in tissue structure (benign/malignant) thus leading to higher classification accuracy, than patterns such as CIM1593.
Further, it can be observed from fig. 7 that at malignant site the magnitude of CIM1524 was higher (472.4 Ω at 1 kHz) than the magnitude of CIM1423 (347.2 Ω at 1 kHz). This is explained as follows. The amplitude of current at a given signal frequency remains constant for electrode source-sink pattern e1-e5 (for CIM1524) and e1-e4 (for CIM1423). Additionally, the current flows through a longer distance in case of e1-e5 pattern than in case of e1-e4 pattern, which results in potential difference measured across e1-e5 for CIM1524 being greater than the potential difference measured across e1-e4 for CIM1423; this leads to potential difference across e2-e4 (CIM1524) to be greater than e2-e3 (CIM1423). Thus, as per the Ohm’s law (R = V/I), the CIM magnitude at a probed site is higher for CIM1524, than for CIM1423.
B. Exterior Measurements
Impedance data recorded from the exterior surface of the prostate were grouped according to their location, i.e., apex, base and lateral surface. Results revealed that the electrical properties of tissues at the apex, base and lateral surface differ significantly from each other, with CIM magnitude being highest at the lateral surface, and lowest at the base. These observations correspond well with prostate anatomy.
The base region is a relatively inert portion of the prostate, comprised of relatively loose stroma; it falls within the conical-shaped central zone defined per the McNeal model of the prostate [28], and comprises roughly 20% of the prostatic volume. The apex of the prostate is poorly demarcated from the extraprostatic tissue; skeletal muscle fibers of the sphincter intermingle with the fibromuscular stroma and even some benign glands of the prostate in the apical and anterior portions of the prostate. The peripheral zone of the prostate, which accounts for 70–80% of the prostatic volume and consists of up to 80% of the glandular tissues found in the prostate, occupies most of the posterolateral portions of the prostate. This portion of the prostate is bordered by a relatively well-defined fibrous “capsule”. Since the flow of current is opposed more by the fibrous and glandular tissues than stroma, it is expected that the impedance magnitude would be highest at the lateral surface (densely packed with fibrous and glandular tissue), and lowest at the base (low density of glandular tissue, loose stroma).
The differences in electrical properties at the exterior surface of the prostate will be useful for establishing electrical property baseline for benign/malignant distinction at different surgical margins.
C. Results and Classification
The interior measurements primarily interrogated the peripheral region of the prostate (70–80% of the prostatic volume), and revealed significant differences in the electrical properties between malignant and benign tissues. Although this observation is consistent with the literature [15], [17], [18], [24], [25], it should be noted that the data for this study was acquired with an impedance probe that was constructed using 1mm diameter gold-plated electrodes (205089-4-ND, DigiKey) that have a small contact area (thus high contact impedance) and as such are more prone to the effects of stray impedances than the electrodes with large contact area. Additionally, the probe can withstand autoclave sterilization protocol, which requires that the probe be maintained at 135°C for 6 minutes, and can be used for in-vivo trials.
The electrical property differences between benign and malignant tumors arise primarily because of the differences in the volume of extracellular fluid (ECF) present in each pathology. ECF is an electrolytic medium in the extracellular space that comprises Na+ (150mM), K+ (5mM), and Cl−(100mM) ions. As cancer cells proliferate, the ECF volume reduces due to the growth of the neoplasm. The flow of current is primarily confined within the ECF at low frequencies; this results in CIM magnitudes (|Z|) measured at malignant sites being significantly larger than the CIM-|Z| measured at the benign sites. However, as the signal frequency increases, the reactive impedance associated with the capacitive cellular wall increases, and results in current shunting through the intracellular fluid. Essentially, at high signal frequencies, the tightly packed neoplastic cells in the malignant site result in the CIM phase (ϕ) component being significantly higher than the CIM-ϕ measured at a benign site.
The classification algorithm used in this study was SVM with an RBF kernel. The SVM based approach is flexible and led to a maximum predictive accuracy of 90.3% in benign/malignant binary classification, using the high frequency phase data from CIM1524 and CIM1526. Additionally, using Platt’s scaling technique [29], [30], it is possible to select an optimal threshold for classification, and to obtain the posterior probability, which can be used as an indicator of confidence in the classification. It is envisioned that the posterior probability can be used to create a confidence-encoded image patch, which can be displayed to the surgeon intraoperatively, (Fig. 12). Further, by detecting the pose of the impedance probe, using either optical [31], [32] or electromagnetic tracking [33], [34] a transformation between the 3D camera frame of reference and the frame of reference defined on the impedance probe head can be computed. This transformation can be used within an imaging protocol, where the surgeon probes a number of tissue sites in sequence, and a corresponding color-coded assessment patch is displayed at each of the probed site. This arrangement will allow the surgeon to sequentially image margins around the prostate.
Fig. 12.
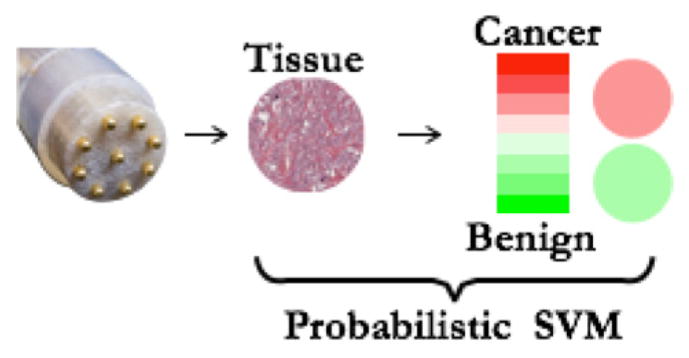
An illustration of probability-encoded image patch that can be displayed on the surgeon’s console for intraoperative assessment of the margin tissues. Platt’s scaling technique can be used to convert SVM raw score into a probability output.
With the classification and confidence information displayed on the screen, the surgeon can make an informed decision about margin resection during RALP, where high-confidence results from the EIA system can be used to deviate from the usual course of action. An example of such a decision is whether or not to extract neurovascular bundles (NVB) in RALP. In RALP, particularly for high-risk patients (Gleason score>8, nearly 20–30% of all cases, [35]), surgeons often opt for extracting NVBs [36]. However, NVB extraction significantly increases the chances of erectile dysfunction [37], [38], and urinary incontinence [39], which stands in contrast to the expectations that majority of patients have regarding regaining their sexual functionality following RALP [40]. The surgeons can use a high-confidence classification from the EIA system to intraoperatively assess the status of NVB and decide if nerve sparing can be considered.
In addition to NVB, extracapsular extension frequently occurs at the base and apex, where prostate connects to bladder and urethra respectively. It has also been shown that PSM >3mm in size with Gleason grade 8 or higher pose a much greater risk of disease recurrence than PSM < 3mm or Gleason grade < 8 [41]. Therefore, a high-confidence ‘cancer’ classification will enable the surgeons to resect large PSMs at the tissue site surrounding base and apex of the prostate, thereby reducing the chances of biochemical recurrence [42].
D. Limitations of the approach
There are three main limitations of the system used in this study: i) the threshold used for benign/cancer classification can change if the probe geometry is changed; ii) high frequency measurements are affected by stray impedance in the instrumentation, iii) data variability.
The first limitation arises from the fact that the impedance measurements are sensitive to the contact area of the electrodes, and the spacing between the source electrode and sink electrode. Moreover, the effective contact area afforded by a specific electrode type can change depending on the size of the electrode and the type of material used to manufacture and coat the electrode. While the results obtained in this study, and the CIM-based approach should remain valid even if a different electrode design is used, the impedance thresholds can change.
The second limitation mainly arises due to the presence of multiplexers in the analog front end of the EIA system. The multiplexers are used to switch source and sink electrodes, and present up to 300pF capacitance at the output lines. Fortunately, these stray impedances do not fluctuate in value. As a result, the benign and malignant measurements are affected similarly. The effect of stray impedance is also partially mitigated by system calibration.
Lastly, as described in [17] the variability observed in the CIM data arises due to patient-to-patient variations, operator-induced variability in data collection, and the approximation inherent in labeling the measurements. The patient-to-patient variability in data is always present and is difficult to model. The CIM data collected from 14 patients in this study was found to be uniform, and validated the analysis performed on the data. To reduce the operator-induced variability in data collection, the data used in this study was acquired by a single researcher (Aditya Mahara) who followed a fixed protocol of data collection to maintain approximately uniform applied pressure. Finally, the maps returned by the pathologists show an approximate position of the cancerous islands within the tissue slice. Thus, the registration between probed site and the surgeon’s map is approximate. However, since we label a measurement as ‘malignant’ only if the probed quadrant contains majority cancer, the adverse effects of approximate registration in this study are limited.
V. Conclusion
The results presented here lead to two conclusions. The EIA system used in this study, combined with the microendoscopic probe, can sense differences in electrical properties between: i) the benign and malignant tissues within the prostate and, ii) among the apex, base, and lateral surface tissues. The SVM based classifier resulted in high accuracy of benign/malignant classification in the leave-one-patient-out cross validation (90.8%) and can be used in the future to generate confidence-encoded image patches that present the benign/malignant classification of a site, with a confidence value to the surgeon in an image form.
Acknowledgments
This work was supported in part by National Institute of Health (NIH) and National Cancer Institute under Grant 1R01CA14302001A1.
Contributor Information
Shadab Khan, Thayer School of Engineering, Dartmouth College, Hanover, NH 03755 USA.
Aditya Mahara, Thayer School of Engineering, Dartmouth College, Hanover, NH 03755 USA.
Elias S. Hyams, Geisel School of Medicine, Dartmouth College, Hanover, NH 03755 USA and also with the Dart- mouth-Hitchcock Medical Center, Lebanon, NH 03766 USA
Alan R. Schned, Geisel School of Medicine, Dartmouth College, Hanover, NH 03755 USA and also with the Dart- mouth-Hitchcock Medical Center, Lebanon, NH 03766 USA
Ryan J. Halter, Thayer School of Engineering, Dartmouth College, Hanover, NH 03755 USA and Geisel School of Medicine, Dartmouth College, Hanover, NH 03755 USA
References
- 1.Siegel RL, Miller KD, Jemal A. Cancer statistics, 2015. CA Cancer J Clin. 2015 Jan;65(1):5–29. doi: 10.3322/caac.21254. [DOI] [PubMed] [Google Scholar]
- 2.CDC/NCHS National Hospital Discharge Survey. [Accessed: 16-Sep-2015];Number of all-listed procedures for discharges from short-stay hospitals, by procedure category and sex: United States, 2010. 2010 [Online]. Available: http://www.cdc.gov/nchs/data/nhds/4procedures/2010pro4_numberproceduresex.pdf.
- 3. [Accessed: 17-Sep-2015];Tracking the Rise of Robotic Surgery for Prostate Cancer - National Cancer Institute. [Online]. Available: http://www.cancer.gov/about-cancer/treatment/research/rise-robotic-surgery.
- 4.Roehl KA, Han M, Ramos CG, Antenor JAV, Catalona WJ. Cancer progression and survival rates following anatomical radical retropubic prostatectomy in 3,478 consecutive patients: long-term results. J Urol. 2004;172(3):910–914. doi: 10.1097/01.ju.0000134888.22332.bb. [DOI] [PubMed] [Google Scholar]
- 5.Orvieto MA, Alsikafi NF, Shalhav AL, Laven BA, Steinberg GD, Zagaja GP, Brendler CB. Impact of surgical margin status on long-term cancer control after radical prostatectomy. BJU Int. 2006;98(6):1199–1203. doi: 10.1111/j.1464-410X.2006.06563.x. [DOI] [PubMed] [Google Scholar]
- 6.Karakiewicz PI, Eastham JA, Graefen M, Cagiannos I, Stricker PD, Klein E, Cangiano T, Schröder FH, Scardino PT, Kattan MW. Prognostic impact of positive surgical margins in surgically treated prostate cancer: Multi-institutional assessment of 5831 patients. Urology. 2005;66(6):1245–1250. doi: 10.1016/j.urology.2005.06.108. [DOI] [PubMed] [Google Scholar]
- 7.Oon SF, Pennington SR, Fitzpatrick JM, Watson RWG. Biomarker research in prostate cancer–towards utility, not futility. Nat Rev Urol. 2011 Mar;8(3):131–8. doi: 10.1038/nrurol.2011.11. [DOI] [PubMed] [Google Scholar]
- 8.Stephenson AJ, Eggener SE, Hernandez AV, Klein Ea, Kattan MW, Wood DP, Rabah DM, Eastham Ja, Scardino PT. Do Margins Matter? The Influence of Positive Surgical Margins on Prostate Cancer-Specific Mortality. Eur Urol. 2013 Aug;65(4):675–680. doi: 10.1016/j.eururo.2013.08.036. [DOI] [PubMed] [Google Scholar]
- 9.Tsuboi T, Ohori M, Kuroiwa K, Reuter VE, Kattan MW, Eastham JA, Scardino PT. Is intraoperative frozen section analysis an efficient way to reduce positive surgical margins? Urology. 2005;66(6):1287–1291. doi: 10.1016/j.urology.2005.06.073. [DOI] [PubMed] [Google Scholar]
- 10.Dillenburg W, Poulakis V, Witzsch U, De Vries R, Skriapas K, Altmansberger HM, Becht E. Laparoscopic radical prostatectomy: The value of intraoperative frozen sections. Eur Urol. 2005;48(4):614–621. doi: 10.1016/j.eururo.2005.06.015. [DOI] [PubMed] [Google Scholar]
- 11.von Bodman C, Brock M, Roghmann F, Byers A, Löppenberg B, Braun K, Pastor J, Sommerer F, Noldus J, Palisaar RJ. Intra-operative frozen section of the prostate reduces positive margin rates while ensuring nerve-sparing procedure during radical prostatectomy. J Urol. 2013 doi: 10.1016/j.juro.2013.02.011. [DOI] [PubMed] [Google Scholar]
- 12.Eichelberg C, Erbersdobler A, Haese A, Schlomm T, Chun FKH, Currlin E, Walz J, Steuber T, Graefen M, Huland H. Frozen Section for the Management of Intraoperatively Detected Palpable Tumor Lesions During Nerve-Sparing Scheduled Radical Prostatectomy. Eur Urol. 2006;49(6):1011–1018. doi: 10.1016/j.eururo.2006.02.035. [DOI] [PubMed] [Google Scholar]
- 13.Fromont G, Baumert H, Cathelineau X, Rozet F, Validire P, Vallancien G. Intraoperative frozen section analysis during nerve sparing laparoscopic radical prostatectomy: feasibility study. J Urol. 2003 Nov;170(5):1843–6. doi: 10.1097/01.ju.0000092081.71167.34. [DOI] [PubMed] [Google Scholar]
- 14.Goharderakhshan RZ, Sudilovsky D, Carroll LA, Grossfeld GD, Marn R, Carroll PR. Utility of intraoperative frozen section analysis of surgical margins in region of neurovascular bundles at radical prostatectomy. Urology. 2002 May;59(5):709–714. doi: 10.1016/s0090-4295(02)01539-x. [DOI] [PubMed] [Google Scholar]
- 15.Salomon G, Hess T, Erbersdobler A, Eichelberg C, Greschner S, Sobchuk AN, Korolik AK, Nemkovich NA, Schreiber J, Herms M, Graefen M, Huland H. The Feasibility of Prostate Cancer Detection by Triple Spectroscopy. Eur Urol. 2009;55(2):376–384. doi: 10.1016/j.eururo.2008.02.022. [DOI] [PubMed] [Google Scholar]
- 16.Sharma V, Olweny EO, Kapur P, Cadeddu Ja, Roehrborn CG, Liu H. Prostate cancer detection using combined auto-fluorescence and light reflectance spectroscopy: ex vivo study of human prostates. Biomed Opt Express. 2014;5(5):1512–29. doi: 10.1364/BOE.5.001512. [DOI] [PMC free article] [PubMed] [Google Scholar]
- 17.Halter RJ, Schned A, Heaney J, Hartov A, Schutz S, Paulsen KD. Electrical impedance spectroscopy of benign and malignant prostatic tissues. J Urol. 2008 Apr;179(4):1580–6. doi: 10.1016/j.juro.2007.11.043. [DOI] [PubMed] [Google Scholar]
- 18.Halter RJ, Hartov A, Heaney JA, Paulsen KD, Schned AR. Electrical Impedance Spectroscopy of the Human Prostate. Prostate, The. 2007;54(7):1321–1327. doi: 10.1109/TBME.2007.897331. [DOI] [PubMed] [Google Scholar]
- 19.Jiang Z, Piao D, Xu G, Ritchey JW, Holyoak GR, Bartels KE, Bunting CF, Slobodov G, Krasinski JS. Trans-rectal ultrasound-coupled near-infrared optical tomography of the prostate, part II: experimental demonstration. Opt Express. 2008;16(22):17505–17520. doi: 10.1364/oe.16.017505. [DOI] [PubMed] [Google Scholar]
- 20.Dangle P, Shah K, Kaffenberger B, Patel V. The use of high resolution optical coherence tomography to evaluate robotic radical prostatectomy specimens. Int Brazaliain J Urol. 2009;35:344–53. doi: 10.1590/s1677-55382009000300011. [DOI] [PubMed] [Google Scholar]
- 21.Gao L, Zhou H, Thrall MJ, Li F, Yang Y, Wang Z, Luo P, Wong KK, Palapattu GS, Wong STC. Label-free high-resolution imaging of prostate glands and cavernous nerves using coherent anti-Stokes Raman scattering microscopy. Biomed Opt Express. 2011;2(4):915–926. doi: 10.1364/BOE.2.000915. [DOI] [PMC free article] [PubMed] [Google Scholar]
- 22.Khan S, Manwaring P, Borsic A, Halter R. FPGA-based voltage and current dual drive system for high frame rate electrical impedance tomography. IEEE Trans Med Imaging. 2015 Apr;34(4):888–901. doi: 10.1109/TMI.2014.2367315. [DOI] [PubMed] [Google Scholar]
- 23.Mahara A, Khan S, Murphy E, Schned A, Hyams E, Halter R. 3D Microendoscopic Electrical Impedance Tomography for Margin Assessment during Robot-Assisted Laparoscopic Prostatectomy. IEEE Trans Med Imaging. 2015 Feb; doi: 10.1109/TMI.2015.2407833. [DOI] [PubMed] [Google Scholar]
- 24.Halter RJ, Schned A, Heaney J, Hartov A, Paulsen KD. Electrical properties of prostatic tissues: II. Spectral admittivity properties. J Urol. 2009 Oct;182(4):1608–13. doi: 10.1016/j.juro.2009.06.013. [DOI] [PMC free article] [PubMed] [Google Scholar]
- 25.Halter RJ, Schned A, Heaney J, Hartov A, Paulsen KD. Electrical properties of prostatic tissues: I. Single frequency admittivity properties. J Urol. 2009 Oct;182(4):1600–7. doi: 10.1016/j.juro.2009.06.007. [DOI] [PMC free article] [PubMed] [Google Scholar]
- 26.Khan S, Mahara A, Hyams ES, Schned A, Halter R. Towards intraoperative surgical margin assessment and visualization using bioim-pedance properties of the tissue. SPIE Medical Imaging. 2015;9414(c):94141C. [Google Scholar]
- 27.Khan S, Borsic A, Manwaring P, Hartov A, Halter R. FPGA Based High Speed Data Acquisition System for Electrical Impedance Tomography. XV International Conference on Electrical Bio-Impedance (ICEBI) & XIV Conference on Electrical Impedance Tomography (EIT); 2013. [DOI] [PMC free article] [PubMed] [Google Scholar]
- 28.McNeal JE. The zonal anatomy of the prostate. Prostate. 1981;2(1):35–49. doi: 10.1002/pros.2990020105. [DOI] [PubMed] [Google Scholar]
- 29.Platt J. Probabilistic outputs for support vector machines and comparisons to regularized likelihood methods. Adv large margin Classif. 1999;10(3):61–74. [Google Scholar]
- 30.Lin HT, Lin CJ, Weng RC. A note on Platt’s probabilistic outputs for support vector machines. Mach Learn. 2007;68(3):267–276. [Google Scholar]
- 31.Jayarathne UL, Mcleod AJ, Peters TM, Chen ECS. Robust Intraoperative US Probe Tracking Using a Monocular Endoscopic Camera. 2013. pp. 363–370. [DOI] [PubMed] [Google Scholar]
- 32.Hughes-Hallett A, Mayer EK, Marcus HJ, Cundy TP, Pratt PJ, Darzi AW, Vale Ja. Augmented reality partial nephrectomy: examining the current status and future perspectives. Urology. 2014 Feb;83(2):266–73. doi: 10.1016/j.urology.2013.08.049. [DOI] [PubMed] [Google Scholar]
- 33.Pagador JB, Sánchez LF, Sánchez JA, Bustos P, Moreno J, Sánchez-Margallo FM. Augmented reality haptic (ARH): An approach of electromagnetic tracking in minimally invasive surgery. Int J Comput Assist Radiol Surg. 2011;6(2):257–263. doi: 10.1007/s11548-010-0501-0. [DOI] [PubMed] [Google Scholar]
- 34.Franz AM, Haidegger T, Birkfellner W, Cleary K, Peters TM, Maier-Hein L. Electromagnetic tracking in medicine–a review of technology, validation, and applications. IEEE Trans Med Imaging. 2014 Aug;33(8):1702–25. doi: 10.1109/TMI.2014.2321777. [DOI] [PubMed] [Google Scholar]
- 35.D’Amico AV. Biochemical Outcome After Radical Prostatectomy, External Beam Radiation Therapy, or Interstitial Radiation Therapy for Clinically Localized Prostate Cancer. JAMA. 1998 Sep;280(11):969. doi: 10.1001/jama.280.11.969. [DOI] [PubMed] [Google Scholar]
- 36.Lavery HJ, Nabizada-Pace F, Carlucci JR, Brajtbord JS, Samadi DB. Nerve-sparing robotic prostatectomy in preoperatively high-risk patients is safe and efficacious. Urol Oncol. 2012 Jan;30(1):26–32. doi: 10.1016/j.urolonc.2009.11.023. [DOI] [PubMed] [Google Scholar]
- 37.Quinlan DM, Epstein JI, Carter BS, Walsh PC. Sexual function following radical prostatectomy: influence of preservation of neurovascular bundles. J Urol. 1991 May;145(5):998–1002. doi: 10.1016/s0022-5347(17)38512-9. [DOI] [PubMed] [Google Scholar]
- 38.Krishnan R, Katz D, Nelson CJ, Mulhall JP. Erectile function recovery in patients after non-nerve sparing radical prostatectomy. Andrology. 2014 Nov;2(6):951–4. doi: 10.1111/andr.282. [DOI] [PubMed] [Google Scholar]
- 39.Eastham JA, Kattan MW, Rogers E, Goad JR, Ohori M, Boone TB, Scardino PT. Risk factors for urinary incontinence after radical prostatectomy. J Urol. 1996 Nov;156(5):1707–13. [PubMed] [Google Scholar]
- 40.Deveci S, Gotto GT, Alex B, O’Brien K, Mulhall JP. A survey of patient expectations regarding sexual function following radical prostatectomy. BJU Int. 2015 Dec; doi: 10.1111/bju.13398. [DOI] [PMC free article] [PubMed] [Google Scholar]
- 41.Ochiai A, Sotelo T, Troncoso P, Bhadkamkar V, Babaian RJ. Natural History of Biochemical Progression After Radical Prostatectomy Based on Length of a Positive Margin. Urology. 2008;71(2):308–312. doi: 10.1016/j.urology.2007.08.042. [DOI] [PubMed] [Google Scholar]
- 42.Yossepowitch O, Briganti A, Eastham Ja, Epstein J, Graefen M, Montironi R, Touijer K. Positive surgical margins after radical prostatectomy: a systematic review and contemporary update. Eur Urol. 2014 Feb;65(2):303–13. doi: 10.1016/j.eururo.2013.07.039. [DOI] [PubMed] [Google Scholar]


