

Abstract
The precise molecular and cellular events responsible for age-dependent cognitive dysfunctions remain unclear. We report that small guanine nucleotide-binding protein Rheb (ras homolog enriched in brain), an activator of mammalian target of rapamycin (mTOR), regulates memory functions in mice. Conditional depletion of Rheb selectively in the forebrain of mice obtained from crossing Rhebflox/flox and CamKIICre results in spontaneous signs of age-related memory loss, i.e., spatial memory deficits (T-maze, Morris water maze) without affecting locomotor (open-field test), anxiety-like (elevated plus maze), or contextual fear conditioning functions. Partial depletion of Rheb in forebrain was sufficient to elicit memory defects with little effect on the neuronal size, cortical thickness or mTOR activity. Rheb depletion, however, increased the levels of beta-site amyloid precursor protein cleaving enzyme 1 (BACE1), a protein elevated in aging and Alzheimer disease (AD). Overall, our study demonstrates that forebrain Rheb promotes aging-associated cognitive defects. Thus, targeting the Rheb pathway may provide therapeutic potentials for aging and/or AD-associated memory deficits.
Introduction
Aging is a major risk factor for cognitive decline and dementia. Dissecting the age-related mechanisms becomes important, not only because it is a fundamental biological question that we do not yet understand completely, but also because memory affecting disorders, such as Alzheimer disease (AD) and related dementia, are a major problem that affect the elderly population. What age-related factors determine the age of onset, and how the age of onset relates to the selective dysfunction of neurons in the brain remains unclear. Rheb (Ras homolog-enriched in brain) GTPase belongs to Ras family of GTPase highly enriched in brain and is induced in the brain in an activity-dependent manner (Yamagata, et al., 1994). Classically, Rheb is implicated in the activation of mTOR (mammalian target of rapamycin), a kinase with diverse cellular functions. mTOR signaling has been implicated in life-span extension (Johnson, et al., 2013), as well as in behavioral and pathological symptoms in neurodegenerative diseases (Korolchuk, et al., 2010, Ravikumar, et al., 2004), including AD (Caccamo, et al., 2010, Spilman, et al., 2010). mTOR pathway also intersects with the degradation pathway, autophagy, which is another important modulator of aging (Rubinsztein, et al., 2011). For example, pharmacological inhibition of mTOR (e.g., with rapamycin), genetic manipulations of genes (DN PI3Ka, ATG-7Tg, mTOR+/−) or calorie restriction that increase life span in model organisms often stimulate autophagy, and its inhibition compromises the longevity-promoting effects (Juhasz, et al., 2007, Lamming, et al., 2012, Onal, et al., 2013, Rubinsztein, et al., 2011, Ruckenstuhl, et al., 2014). A direct role for Rheb in aging was also demonstrated in C. elegans (Kandalepas and Vassar, 2012). But the molecular mechanisms how Rheb participates in aging and neurodegenerative disorders remains unclear.
Earlier we found a biochemical link for Rheb and BACE1, a critical enzyme that generates Aβ (Shahani, et al., 2014), which is increased in normal aging, sporadic AD, familial AD, and in mild cognitive impairment (Cheng, et al., 2014, Kandalepas and Vassar, 2012, Kuhn, et al., 2012, Sinha, et al., 1999, Vassar, et al., 1999, Vassar and Kandalepas, 2011). We reported that Rheb regulates the BACE1 protein levels; while overexpression of Rheb reduces BACE1 in the intact hippocampus, Rheb depletion enhances BACE1 protein levels in cultured cortical neurons (Shahani, et al., 2014). The physiological implication of the Rheb–BACE1 link in brain function remains unknown. Homozygous deletion of Rheb was embryonically lethal, hindering the study of Rheb functions in adult brain. Heterozygous Rheb mice, however, do breed and have normal lifespans. A recent study in which a further depletion of Rheb using an inducible promoter in the forebrain (Rhebf/−; CaMKIIα-CreERT2) found no behavioral or anatomical defects in mice that was of 2–5 months old (Goorden, et al., 2015). In another study where Rheb was deleted in neural progenitor cells by Nes-cre (Rheb1f/f; Nes-Cre), there were no apparent defects in the development of progenitor cells, but most of Rheb1f/f; Nes-Cre mice died at ~5–6 weeks old with severe defects in myelination (Zou, et al., 2011).
To further assess the role of Rheb in brain functions, we crossed Rhebf/f mice with transgenic mice (CaMKIIα) that constitutively express Cre in the forebrain beginning after P5 (Dragatsis and Zeitlin, 2000), and we report motor, cognitive, biochemical and morphological alterations upon forebrain Rheb depletion in 6–8 months old mice.
Materials and Methods
Animals
All procedures were approved by the Scripps Florida Institutional Animal Care and Use Committee (IACUC) and were consistent with the guidelines outlined in the NIH “Guide for the Care and Use of Laboratory Animals.” We independently produced mutant mice by cross-breeding Rhebflox/flox (Rhebf/f) mice (Goorden, et al., 2011) (a gift from Ype Elgersma, ENCORE Expertise Centre for Neurodevelopmental Disorders, The Netherlands) with CamKIIαCre (generously provided by Ioannis Dragatsis, University of Tennessee). Three genotypes of mice Rhebf/f & Rhebf/+ (Control, n=21; 11 females); cRhebf/+; CamKIICre (Het, n=13; 9 females); cRhebf/f; CamKIICre (Null, n=18; 9 females) were produced after multiple breeding sessions, and the genotypes were confirmed by an established PCR protocol (Dragatsis and Zeitlin, 2000, Goorden, et al., 2011). Mice were housed in groups of 3–5 mice per cage in standard laboratory conditions of 12:12 light:dark cycle. All behavioral tests were performed during the light period. All mice were handled once a day for three days prior to the start of behavioral testing in order to acclimate them to the experimenters (Albarran-Zeckler, et al., 2012). The investigator was blind to the genotypes of the mice throughout the duration of the behavioral test battery. Two different cohorts of mice were used for all experiments. Three genotypes of mice were subjected to behavioral batteries beginning at six months of age. The elevated plus maze (EPM), open field test (OFT), spontaneous alternation in the T-maze, Morris water maze (MWM) and contextual fear conditioning (FC) tests were carried out in sequential order before the mice were sacrificed (eight months old, see Fig. 1A, scheme).
Fig 1. Behaviors unaltered by forebrain deletion of Rheb.
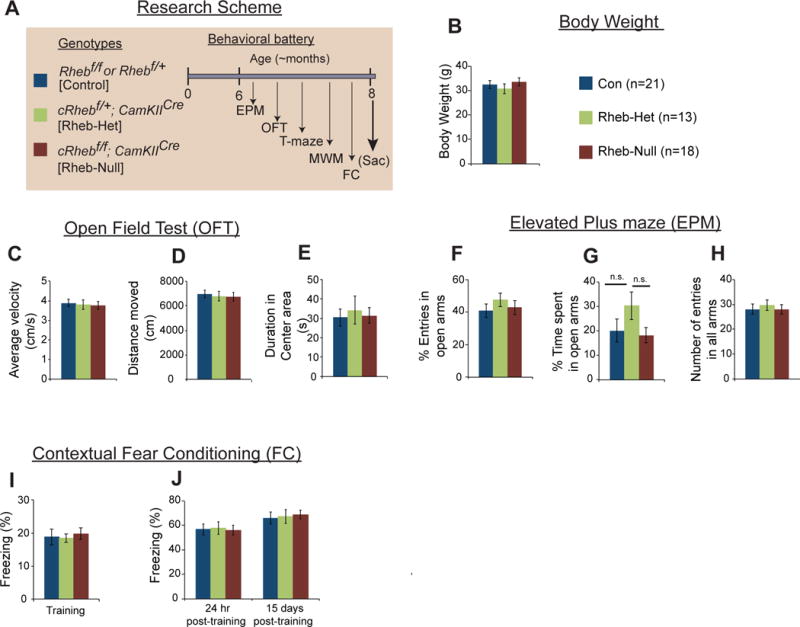
(A) Research Scheme. (B) Average body weight of Rhebf/f& Rhebf/+ (Con), cRhebf/+;CamKIICre (Rheb-Het), cRhebf/f;CamKIICre (Rheb-Null) mice. (C–E) Analysis of open field exploration behavior for (C) average velocity, (D) distance traveled, or (E) duration spent in the center of the field. (F–H) Analysis of elevated plus maze exploration behavior for (F) percentage (%) of entries in open arms, (G) percentage of time spent in open arms, and (H) number of entries in all arms of the maze. (I–J) Analysis of contextual fear conditioning for (I) percentage of time freezing during training, and (J) percentage of time freezing during context testing (24 h or 15 days post-training). All values are mean ± SEM. Rhebf/f& Rhebf/+ (Con), n=21; cRhebf/+/CamKIICre (Rheb-Het), n=13; cRhebf/f;CamKIICre (Rheb-Null), n=18, one-way ANOVA followed by Tukey’s post hoc test was used There were no significant differences in any of these behaviors between the three groups. n.s.: not significant
Elevated Plus Maze
Anxiety-like behavior was assessed in the elevated plus maze (EPM) test. The EPM apparatus (Med Associates, Inc.) consisted of a center platform elevated 40 cm from the floor with four arms attached (two open arms across from each other and two closed arms perpendicular to the open arms with a white floor insert). Mice were placed in the center platform facing a closed arm and allowed to freely explore the maze for 5 min. The location of the mice was tracked with an automated video-tracking system (EthoVision XT 11, Noldus Information Technology, Leesburg, VA). All experimental sessions were conducted under white light illumination and with a white noise generator (set at 65 dB to mask external noises and provide a constant noise level). The arms were cleaned with 0.1% Micro-90 (International Products Corporation, Burlington, NJ) before and between trials. The number of entries and time spent in open arms were analyzed.
Open field: activity and anxiety-like behavior
To test for baseline activity, locomotor behavior was measured in an open field arena (17 inch length × 17 inch width × 12 inch height, created by the Scripps FL Behavior Core). Prior to testing, uniformity of light across the arena was confirmed using a light intensity meter, and the chambers were cleaned with 0.1% Micro-90 (International Products corporation) before and between trials. A white noise generator was set at 65 dB to mask external noises and provide a constant noise level. Mice were placed into the center of the chamber to begin testing, and activity was recorded for 30 min. Data were analyzed in 10 min blocks.
Activity during the first 5 min of the open field test was analyzed for differences in anxiety-like behavior. Thigmotaxis, or the tendency of a mouse to avoid the center of the open field (where ‘fear of predation’ potentially exists) and instead stay close to the sides, was measured as percent of time spent in the center of the open field (Bailey and Crawley, 2009, Crawley, et al., 1997).
Spontaneous alternation T-Maze
Spontaneous alternation in the T-maze is considered a test of spatial memory, and it also makes use of the natural preference of rodents to explore a novel environment. Each maze contained three arms with walls made opaque including a start box (17.8 × 7.3 cm) at the base of the start arm (38.1 × 7.3 cm) and adjoined to a central choice area (10.2 × 10.2 cm) with two choice arms 30.5 × 7.3 cm) radiating 180 degrees from the central choice area. Automatic guillotine doors were installed at the end of the start arm box and at the entrances of each of the choice arms that were activated by motion detected by an Ethovision XT 11 system linked to CCTV cameras. Two of the mazes oriented 180 degrees from each other were used for all assessments with each mouse tested in a different maze on two days (with a gap of two days in between). Mice received two successive non-rewarded trials. Briefly, the mouse was first allowed to enter one of the two equally unfamiliar choice arms (i.e. trial 1). After being confined to the chosen arm for ten seconds, the mouse was removed from the maze and then placed back on the start arm (i.e. trial 2), and once again allowed to choose freely between the same two arms that now differed in terms of familiarity – namely, a visited vs. an unvisited arm. Here, either no-delay or a delay of 1 min was introduced. Testing half of mice with delay and half without delay on the same day, then reverse the conditions on the subsequent day. Wild-type mice are expected to show a preference for the novel arm in the second trial, which is scored as a spontaneous alternation. A discreet-two-trials spontaneous alternation paradigm with only one opportunity to assess alternation on the second trial was meant to be more stringent and specific than the multi-trial procedure (Deacon and Rawlins, 2006, Lalonde, 2002).
Morris water maze
Spatial learning and memory was assessed using the Morris water maze/navigation task as described previously (Vorhees and Williams, 2006, Wenk, 2004). Briefly, the mice had to learn to use distal cues to locate a platform hidden in a circular tank (48-in. diameter, water temperature 23 °C). The water was made op aque by adding non-toxic white tempera paint so that the platform was not visible during trials. Before starting the training, a visual platform test (platform elevated above water level and no distal cues) was performed to assess visual ability of the mice. The animals were then trained for consecutive days in four trials per day (inter trial interval, approx. 30 min) until the mice reached the criteria of 20s escape latency and 95% success rate of finding the platform (11 days). The start position varied randomly for each trial. The platform was placed in the NW compartment of the tank. The mice had 60 s to locate the platform, or they were guided to it. Once the platform was reached, the mice were left 15 s on the platform. If the mouse did not find the platform within 60 s, it was placed on or guided to the platform and kept there for 15 s. Mice were dried with a soft towel after each trial and placed into cages located atop a hot water heating plate to keep them warm, and an inter-trial interval of 20 min was used to space the acquisition trials and prevent hypothermia effects. The % of success and latency to find the platform were averaged per day, and used as acquisition parameters. In order to assess reference memory and memory consolidation, four probe trials (60 s each), during which the platform was removed, were performed on acquisition day 6, 9, and 24 h and 7 days following the acquisition. Time spent in the target quadrant (NW) of the tank, number of platform crossings (number of times mice cross the exact location of the platform (5 cm in radius) during the 60-s test) and proximity measure (Gallagher’s measure: average distance in centimeters of mice from center of the platform location across the 60-s test) (Gallagher, et al., 1993) was recorded. Performance was tracked using EthoVision XT 11 (Noldus Information Technology, Inc).
Fear conditioning
A mild contextual fear conditioning protocol was used in order to discern subtle genotypic effects. The fear conditioning chambers (Noldus Information Technology, Leesburg, VA) have been previously described (Pham, et al., 2009). Each chamber was cleaned with 70% ethanol prior to each trial. White light was used inside the chamber for training and testing, and white noise was played in the room to mask any unintended noise that might add to the context. Mice were placed individually into each chamber and allowed to explore it for 150 sec. Mice then received a 3-shock protocol: two-second 0.75 mA foot shock with time between shocks: 60s following shock 1, 90s following shock 2, and 30s following shock 3, and following the foot shock the mice were removed from the chambers and returned to their home cages. 24 h later, mice were tested for contextual fear conditioning by placing them back into the chambers for 5 min. Percent of time spent freezing (immobility except for breathing) was recorded using EthoVision XT 11 (Noldus Information Technology, Inc). Mice received a second fear-conditioning test 21 days after training and percent freezing was recorded.
Reagents, Plasmids, and Antibodies
Unless otherwise specified, chemicals and reagents were purchased from Sigma (St. Louis. MO). Antibodies used for Western blotting experiments were: mTOR (1:2000, #2983), BACE1 (1:1000, #5606) antibody that was validated in our previous study (Shahani, et al., 2014), and Rheb (1:3000, #13879) were from Cell Signaling Technology, Inc. Antibody for actin (1:10000, sc47778) was from Santa-Cruz Biotechnology.
Immunohistochemistry
Mouse brains were fixed in 4% paraformaldehyde, incubated in a 20% sucrose/PBS solution at 4°C for thr ee days, and embedded in Tissue-Tek OCT compound (Sakura). Coronal sections (50 μm) were collected on Superfrost/Plus slides and immunostained with the following antibodies, as previously described (Chen, et al., 2015). Primary antibodies used in this study include phospho-S6 (Ser235/236, p-S6) (1:2000, Cell Signaling, #4858), cleaved caspase-3 antibody (1:2000, Cell Signaling, #9664), NeuN (1:1000, Millipore, MAB377). Alexa Fluor-488-, Alexa Fluor-594-conjugated secondary antibodies (Life Technologies) were used in this study. Immunofluorescent brain sections were counterstained with ProLong® Gold Antifade Mountant with DAPI (Thermo Fisher Scientific, P36931). Images were obtained with the Olympus VS120 microscope and processed using the VS-DESKTOP software (Olympus). For quantification of p-S6 intensity, regions of interest (ROIs), somatosensory cortex and hippocampus, were cropped from whole brain images, and then ImageJ was used to measure mean grey intensity. Three ROIs were measured in each animal. The number of cleaved caspase-3-positive cells was measured in the dorsal hippocampus. Three adjacent brain sections were measured from each mouse. The density of cleaved caspase-3-positive cells was calculated by dividing the number of cleaved caspase-3-positive cells to the area of dorsal hippocampus. N=3 animals each genotype.
Cell size analysis
Brain sections were stained with 0.1% Cresyl violet solution. Regions of interest (ROIs) were cropped from primary somatosensory cortex barrel field (coronal section) using Photoshop (Adobe). Layer II/III was further cropped according to the anatomical boundaries judged by Nissl staining. Cell soma size of all neurons in each layer was measured using the freehand tool in ImageJ to contour the boundary of neuronal soma, as described previously (Chen, et al., 2015). Three ROIs were measured in each animal.
Cortical thickness analysis
The thickness of somatosensory cortex was measured in this study. After brain sections were stained with p-S6 and DAPI, somatosensory cortex was cropped from the whole brain images, and ImageJ was used to measure the thickness of the cortex, as described previously (Chen, et al., 2015).
Western blotting experiments
Mouse brain cortex homogenates (10% (w/v)) were prepared in tissue homogenization buffer (20 mM Tris base, pH 7.4, 250 mM sucrose, 1 mM EDTA, 1 mM EGTA) with 1% CHAPS, 100 mM AEBSF, protease inhibitors [protease inhibitors cocktail Complete (Roche) and phosphatase inhibitors (PhosStop, Roche). Protein concentration was measured with a BCA protein assay reagent (Pierce). Equal amounts of protein were loaded and were separated by electrophoresis in 4–12% Bis–Tris Gel (Invitrogen), transferred to PVDF membranes, and Western blotting was carried out as previously described (Pryor, et al., 2014, Shahani, et al., 2014, Swarnkar, et al., 2015).
Statistical Analysis
Data are presented as mean ± SEM. Statistical analysis was performed using the one-way analysis of variance (ANOVA) followed by Tukey’s multiple comparison post hoc test, or two-way ANOVA followed by Bonferroni multiple comparison post hoc test, or repeated measures two-way ANOVA followed by Bonferroni multiple comparison post hoc test, as is indicated in the figure legends. Analysis of open field exploration behavior, elevated plus maze exploration behavior and contextual fear conditioning was performed using one-way ANOVA followed by Tukey’s multiple comparison post hoc tests. Analysis of T-maze spontaneous alternation was carried out by two-way ANOVA followed by Bonferroni multiple comparison post hoc tests. Repeated measures two-way ANOVA followed by a post hoc Bonferroni multiple comparison tests were used for Morris water maze parameters tested. Immunohistochemical and biochemical data analyses were performed using one-way ANOVA followed by Tukey’s multiple comparison post hoc tests. Significance was set at p<0.05. All statistical tests were performed using Prism 6.0 (Graphpad).
Results
Rheb depletion promotes spatial memory deficits
To investigate whether forebrain deletion of Rheb has any impact on mouse behaviors, (Goorden, et al., 2011). We began subjecting controls [Rhebf/f or Rhebf/+ (Con)] and forebrain Rheb-depleted mice [cRhebf/+; CamKIICre (Rheb-Het); and Rhebf/f; CamKIICre (Rheb-Null)] to a battery of behavior tests beginning at around six months of age that lasted ~50 days (See Fig. 1A, scheme). Forebrain Rheb-depleted mice are phenotypically indistinguishable from control mice and appear normal and have comparable body weight (Fig. 1B). In the OFT, which measures locomotor and anxiety-like behaviors, the mutant mice were not significantly different from controls (Fig. 1C–D); similarly, performance in the EPM, which also evaluates anxiety-like behaviors, we found no difference between the genotypes (Fig. 1F–H). But there was a trend of increased time spent in open arm in Rheb-het mice which was not statistically significant compare to control or Rheb-null mice [Fig. 1G, (F2,49) = 1.700, P = 0.19, one-way ANOVA followed by Tukey’s post hoc test, Het vs Con: P = 0.29; Null vs Con: P = 0.94; Het vs Null: P = 0.19)]. There was no deficit observed in contextual FC in any genotype (Fig. 1I–J). However, in T-maze spontaneous alternation, the Rheb-Het mice showed a significantly poorer performance compared to control mice controls, especially when delay of 1 min was introduced, suggesting a spatial memory deficit (Fig. 2A). (F(2,98) = 4.329, P = 0.01, Het vs Con: *P<0.01; Het vs Null: **P<0.01), There was no effect of no-delay vs delay (F(1,98) = 2.106, P = 0.15, for no delay-delay: Het vs Het: P = 0.086.), Two-way ANOVA followed by a post hoc Bonferroni multiple comparison test. We next tested spatial learning and memory in the MWM (See scheme, Fig. 2B). We excluded one control animal and one null group animal from MWM, as they were “floaters,” and did not swim. During acquisition of the hidden platform version of MWM, control mice reached the criteria of 20s escape latency and 95% success rate of finding the platform by 8–11 days, whereas Rheb-Het mice exhibited longer escape latency and lower success rate (Fig. 2C,D). For escape latency, there is a significant effect of day of training (F(10,470) = 20.63, P < 0.0001), *Rheb-Het vs Con: P<0.01; For % success rate there is a significant effect of genotype (F(2,47) = 4.035, P = 0.02) and day of training (F(10,470) = 18.66, P < 0.0001), *Rheb-Het vs Con: P<0.01, **Rheb-Het vs Con: P<0.001, using a repeated measures two-way ANOVA followed by a post hoc Bonferroni multiple comparison test. Both Rheb-Het and Rheb-Null mice displayed robust spatial memory deficits, compared to control mice (Fig. 2E–H). The heat maps indicated that control mice (compared to Het and Null mice) searched more extensively around the target location (i.e., the former platform location) (Fig. 2E). Compared to the control mice, both Rheb-Het and Rheb-Null mice spent less time in the target quadrant, crossed the platform location fewer times and were away from the center of the platform location in probe tests when the platform was removed (Fig. 2F–H). Using Two-way ANOVA followed by a post hoc Bonferroni multiple comparison test we found that, for percentage of time spent in the target quadrant, there was a significant effect of genotype (F (2,47) = 2.439, P = 0.04) and probe trial day (F (3,141) = 2.976, P = 0.034), Het vs. Con: *P<0.01, Null vs. Con: *P<0.01, for the frequency of platform crossing significant effect of genotype (F (2,47) = 2.439, P = 0.04), Het vs. Con: **P<0.001, Null vs. Con: **P<0.001, and for proximity measure there was significant effect of probe trial day (F(3,141) = 6.407, P = 0.0004), Het vs. Con: *P<0.01, Null vs. Con: *P<0.01. Overall, we found that depletion of Rheb selectively in the forebrain of mice elicits robust spatial memory deficits.
Fig 2. Spatial memory deficits in mice with forebrain deletion of Rheb.

(A) Performance of Rhebf/f& Rhebf/+ (Con), cRhebf/+;CamKIICre (Rheb-Het), cRhebf/f;CamKIICre (Rheb-Null) mice in the T-maze spontaneous alternation with no-delay or 1-minute delay between two trials. There is a significant effect of genotype (F(2,98) = 4.329, P = 0.01). There was no effect of no-delay vs delay (F(1,98) = 2.106, P = 0.15). Two-way ANOVA followed by a post hoc Bonferroni multiple comparison test, for delay: Het vs Con: *P<0.01; Het vs Null: **P<0.001 and for no delay-delay: Het vs Het: P = 0.086. n.s.: not significant. Rhebf/f& Rhebf/+ (Con), n=21; cRhebf/+;CamKIICre (Rheb-Het), n=13; cRhebf/f;CamKIICre (Rheb-Null), n=18. (B) Schematic of the Morris water maze testing schedule showing the habituation day (day 0), acquisition phase with 4 trials each day (days 1–11), probe trial days (acquisition day 6 and 9, 24 hour post-acquisition on day 12, and remote probe trial test on day 19). (C–D) Escape latency (C) and % success to find the platform (D) in the Morris water maze plotted against the acquisition days. For escape latency, there is a significant effect of day of training (F(10,470) = 20.63, P < 0.0001), Het vs Con: *P<0.01; For % success rate there is a significant effect of genotype (F(2,47) = 4.035, P = 0.02) and day of training (F(10,470) = 20.63, P < 0.0001), Het vs Con: *P<0.01, Het vs Con: **P<0.001; Repeated measures Two-way ANOVA followed by a post hoc Bonferroni multiple comparison test. (E) Heat map of all swimming tracks combined per genotype showing where Con, Rheb-Het and Rheb-Null mice concentrated their searches in the probe trials (days 12, 19). The white circle shows the location of former platform location (northwest) in the target quadrant. The color scale represents the mean number of visits per animal per 5 cm × 5 cm area. (F) Percentage of time spent in the target quadrant during a 60 s probe trial of MWM test on different probe trial days. There is a significant effect of genotype (F(2,47) = 2.439, P = 0.04) and probe trial day (F(3,141) = 2.976, P = 0.034), Het vs Con: *P<0.01, Null vs Con: *P<0.01. (G) Frequency of platform crossings during a 60 s probe trial of MWM test on different probe trial days. There is a significant effect of genotype (F(2,47) = 2.439, P = 0.04), Het vs Con: **P<0.001, Null vs Con: **P<0.001. (H) Average distance in centimeters of mice from center of the platform location (proximity measure) across the 60 s probe trial of MWM test on different probe trial days. There is a significant effect of probe trial day (F(3,141) = 6.407, P = 0.0004), Het vs Con: *P<0.01, Null vs Con: *P<0.01. Repeated measures two-way ANOVA followed by a post hoc Bonferroni multiple comparison test was used for MWM parameters tested. All values are mean ± SEM. Rhebf/f& Rhebf/+ (Con), n=20; cRhebf/+;CamKIICre (Rheb-Het), n=13; cRhebf/f;CamKIICre (Rheb-Null), n=17.
Rheb depletion promotes anatomical and biochemical deficits
As Rheb is a potent activator of mTORC1 signaling that regulates cell size, we investigated how these functions are altered in the forebrain of Rheb-depleted mice, post-behavioral analysis. Coronal sections of whole brain revealed strong anatomical defects Rheb-Null mice in the forebrain area, including hippocampal shrinkage (Fig. 3A). Immunohistochemistry of phosphorylated forms of S6 (p-S6, a marker of mTORC1 activity) in hippocampus and cerebral cortex of Rheb-Het groups were not significantly different from control mice. The Rheb-Null mice, however, showed a dramatic loss of p-S6 staining in the hippocampus and cortex compared to control mice (Fig. 3 B–E). Similarly, cortical thickness and cell size in the layer 2/3 were not altered in Rheb-Het groups, but robustly diminished in Rheb-Null mice, compared to WT (Fig. 3F–H). We then tested whether hippocampal abnormalities is associated with cell death pathway. Histochemical analysis of cleaved caspase-3 immunostaining in the hippocampus did not show apparent caspase-3 activation in Rheb-Het or Rheb-Null mice compared to WT (Fig. S1). We next tested the levels of BACE1, a rate-limiting enzyme in the generation of amyloid-beta, whose stability is regulated by Rheb. Consistent with previous work (Shahani, et al., 2014), we found BACE1 levels were markedly elevated with a corresponding loss of Rheb levels in the cortical brain regions of Rheb-depleted mice (Fig. 4A–C). Overall, we found that forebrain Rheb depletion promotes age-related cognitive, anatomical, and biochemical deficits.
Fig 3. Anatomical deficits in mice with forebrain deletion of Rheb.

(A) Representative images of the cresyl violet-stained brain sections of Rhebf/f& Rhebf/+ (Con), cRhebf/+;CamKIICre (Rheb-Het), cRhebf/f;CamKIICre (Rheb-Null) mice. (B and D) Representative images of hippocampal (B) and cortical (D) sections immunohistochemically stained for p-S6 in Con, Rheb-Het, and Rheb-Null mice. (C and E) Quantification of p-S6 immunoreactivity in hippocampus (C) and cerebral cortex (E) of Con, Rheb-Het, and Rheb-Null mice. (F) Quantification of cortical thickness of layer 2/3 cells. (G) Representative images of Nissl staining in the cerebral cortex of Rhebf/f& Rhebf/+ (Con), cRhebf/+;CamKIICre (Rheb-Het), cRhebf/f;CamKIICre (Rheb-Null) mice. (H) Quantification of cell soma size of layer 2/3 cells. For (C, E, F and H) all values are mean ± SEM, one-way ANOVA followed by Tukey’s post hoc test was used. ***P<0.001. N=3 animals per genotype.
Fig 4. Biochemical alterations in forebrain Rheb-deleted mice.
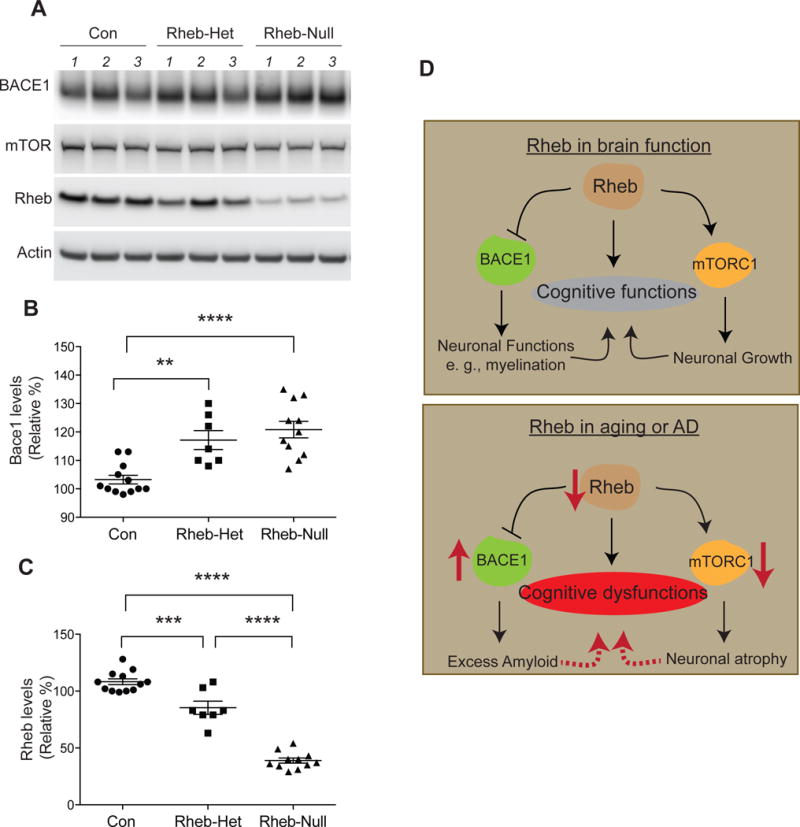
(A) Western blot depicting mTOR, BACE1, Rheb, and actin in indicated groups. (B) BACE1 quantification. (C) Rheb Quantification. (D) Model of how Rheb may regulate cognitive functions through alteration of mTORC1 and BACE1 signaling. In aging and AD, Rheb levels decrease, resulting in high BACE1 and low mTORC1 and negatively affecting cognitive functions. All values are mean ± SEM. Rhebf/f& Rhebf/+ (Con), n=12; cRhebf/+;CamKIICre (Rheb-Het), n=7; cRhebf/f;CamKIICre (Rheb-Null), n=11, one-way ANOVA followed by Tukey’s post hoc test was used. **P<0.01, ***P<0.001, ****P<0.0001
Discussion
Our study suggests forebrain Rheb depletion does not affect overall body weight, motor activity, or context-based fear memory in mice. But these mice have subtle effects on learning spatial memory tasks, and recalling of those memories (T-maze and MWM) are selectively impaired when delays were introduced. Such selective memory deficits are a major problem of aging and incur a debilitating effect on humans with AD and related dementia. How a selective set of neurons in the entorhinal cortex and hippocampus shrink and what aging-related factors contribute to memory disturbances and neurodegeneration remains unclear (Arendt, et al., 2015, Frisoni, et al., 1999, Laakso, et al., 2000, Mattson and Magnus, 2006, Mizutani and Kasahara, 1997). A striking observation was we find no evidence of brain shrinkage in partial Rheb depleted mice (Rheb-Het) but these mice display deficits in recalling spatial memory tasks. This suggests that neuronal dysfunction precede shrinkage or that these two abnormalities are independent process. Consistent with this assumption, despite a robust shrinkage of cortical thickness in Rheb-null mice, we found that the memory deficits are comparable between Rheb-Null vs. Rheb-Het mice. This suggests Rheb may have brain targets that control memory deficits independent of neuronal shrinkage.
Only small portion of AD or AD-related cases have a definitive genetic link, while the rest are sporadic, as their exact etiology or genetic causes remain elusive. Its premature to implicate Rheb in AD or dementia-related abnormalities. Yet Rheb is major target of mTORC1, which is implicated in aging and AD. Our data supports, but does not prove, however that Rheb‘s effect on cognitive deficits are mTORC1 independent for two reasons: 1) Rheb-Het mice elicit robust cognitive deficits despite no significant alterations in mTORC1 signaling or neuronal size in forebrain and 2) Rheb-Null mice show a robust loss of mTORC1 signaling and neuronal shrinkage in forebrain, yet exhibit cognitive deficits that are comparable to Rheb-Het groups (Fig. 2C–H and Fig. 3). Previous work showed Rheb can signal both mTOR-dependent and -independent pathways (Alves, et al., 2015, Neuman and Henske, 2011, Saito, et al., 2005, Tyagi, et al., 2015), and we found that Rheb can signal eIF2α (Tyagi, et al., 2015), a target implicated in AD (Chang, et al., 2002, Devi and Ohno, 2010, Hoozemans, et al., 2005, Segev, et al., 2013). How Rheb-eIF2α link in neuronal dysfunction remains unknown. Thus Rheb can promote memory deficits through mTORC1 independent brain targets.
Previous studies linked mTORC1 signaling in aging and AD. For example, a global inhibition of mTOR signaling with rapamycin reduces cognitive deficits in an AD mouse model (Spilman, et al., 2010), and human AD and mild cognitive impairment post-mortem brain samples show high mTOR activation compared to healthy control (An, et al., 2003, Tramutola, et al., 2015). Oddo and colleague showed that genetic depletion of mTOR or its target S6K ameliorated behavioral and pathological deficits in Tg2576 and 3xTg AD mouse model respectively (Caccamo, et al., 2015, Caccamo, et al., 2014). Thus there is a strong evidence for beneficial effects of mTOR inhibition in AD, in increasing life span in diverse set of animals (Ehninger, et al., 2014, Johnson, et al., 2013). Contrary to this beneficial effects, the rapamycin or genetic disruption of mTOR has shown to block long-term potentiation and memory functions in vitro and intact animals (Rozas, et al., 2015, Stoica, et al., 2011, Sui, et al., 2008, Tang, et al., 2002). Thus biological effects of mTOR inhibition are diverse and often have opposite effects based on the model or the mTOR regulator studied. For example constitutive activation of mTORC1 or depletion of its negative regulator, tuberous sclerosis (TSC), is detrimental to neuronal functions (Ehninger, 2013, Ehninger, et al., 2008, Pryor, et al., 2014). Thus detailed mechanisms how mTOR signaling and its regulators participate in neuronal functions and disease remain to be fully resolved. For example, a new genetic model in which Rheb is depleted but have intact mTORC1 activity would be valuable approach to test whether Rheb-depleted onset of spatial memory deficits, occurs independent of mTORC1 signaling.
Paradoxically, Rheb-Het groups performed worse in the T-maze and had learning deficits in MWM compared to Rheb-Null mice (Fig. 2A). Similar phenotypic differences between heterozygous and homozygous were observed in dopamine D4 receptor (Drd4) and parkin mutant mice. While heterozygous Drd4 mice exhibited robust attention deficits, they were not found in homozygous Drd4 KO mice (Young, et al., 2011). Similarly heterozygous parkin mice brain slices show abnormal synaptic recordings compared to homozygous parkin-KO mice (Hanson, et al., 2010). Thus unknown compensatory effects in the KO groups may contribute to alleviation of such phenotype seen in Het groups, but the mechanisms remains unclear.
A previous study found no apparent memory or anatomical deficits in global heterozygous Rheb mice (Goorden, et al., 2015). We speculate that reasons for the differences found in our study are two-fold: 1) Mouse model; unlike our model, where we depleted Rheb only in the forebrain, in the Goorden et al study, Rheb was further depleted in a global het background using an inducible system; and 2) Age of the mice; while we employed six to eight months old mice, Goorden et al employed mice of ~two-five months old. Nonetheless, our study reflected the importance of Rheb in development and disease, and this is consistent with a study of Rheb1f/f; Nes-Cre mice, in which Rheb was depleted in progenitor cells that result in a severe phenotype and premature death of mice at ~five-six weeks of age (Zou, et al., 2011).
Our model predicts that memory deficits upon Rheb depletion can occur through BACE1 upregulation (See model, Fig. 4D). Consistent with our previous study we found Rheb depletion enhances BACE1 protein (Shahani, et al., 2014), which might be a contributing factor for memory deficits. We also found Rheb levels are reduced, which is correlated with an increased BACE1, in human post mortem brain samples (Shahani, et al., 2014). As BACE1 is increased in aging and implicated in AD (Ohno, 2016), we predict that Rheb depletion elicits BACE1, which is a contributing factor for memory deficit, through BACE1-mediated Aβ accumulation. But we could not stain for amyloid deposition in our model; the reasons could be technical or amyloid deposition might occur in Rheb-depleted mice at older age. To establish a definitive role of BACE1 in our model, we would need to test whether Rheb depletion elicits spatial memory deficits in mice that lacks BACE1 or its activity is inhibited through pharmacological blockers.
This study raised another question, what are the mechanisms by which Rheb protein or activity might be downregulated in normal aging and AD? Evidence suggests that Rheb mRNA, which is an activity-induced gene (Yamagata, et al., 1994), is rapidly induced upon protein starvation in drosophila and fungi (Panepinto, et al., 2002, Saucedo, et al., 2003). This observation lead us to propose a hypothesis that a high protein diet in humans might decrease Rheb levels with age, resulting in a mild-to-severe cognitive deficits, as seen in our model (Fig. 2). In support of this notion, high protein diet caused loss of brain mass compare to normal diet in an AD TgCRND8 model (Pedrini, et al., 2009). A recent correlation study predicts that high protein consumption might be a risk for the developing AD (Grant, 2016). Thus, the nutrient signaling might regulate cognitive functions in mammals through alteration of the activity of Rheb–BACE1 and Rheb–mTOR pathways.
Overall, this study reveals a brain-specific role of Rheb in selective age-related memory-related deficits in mice. A deeper understanding of how the Rheb pathway orchestrates cognitive functions might lead to new drug targets for the treatment of aging-associated memory disorders, including AD, in humans.
Supplementary Material
(A) Representative images of hippocampal sections immunohistochemically stained for cleaved caspase-3, and NeuN in Rhebf/f& Rhebf/+ (Con), cRhebf/+;CamKIICre (Rheb-Het), cRhebf/f;CamKIICre (Rheb-Null) mice. Scale bar: 500μm. (B) Quantification of number of cleaved caspase-3-positive in hippocampus of Con, Rheb-Het, and Rheb-Null mice. Numbers of cleaved caspase-3-positive cells per mm2 are given as mean ± SEM, one-way ANOVA followed by Tukey’s post hoc test was used. No significant difference was found between the groups. N=3 animals per genotype.
Highlights.
Depletion of Rheb in the forebrain of mice results in age-related memory loss.
Protein levels of BACE1 enzyme are increased after partial Rheb depletion in forebrain.
Rheb in the forebrain may promote aging-associated cognitive deficits.
Rheb may be a therapeutic target for Alzheimer’s-associated memory dysfunction.
Acknowledgments
We would like to thank Melissa Benilous and Trina Miles for administrative help. We would like to thank Ioannis Dragatsis, University of Tennessee, for generously providing CamKIIαCre mice and Ype Elgersma, ENCORE Expertise Centre for Neurodevelopmental Disorders, The Netherlands, for providing Rhebflox/flox mice. This work was supported by ”gift funds from Ms. Nancy Lurie Marks” and “NIH/NIMH R01-MH105610” to Damon Page, and “Alzheimer’s disease association grant” and “NIH/NINDS R01-NS087019-01A1” grant to S. Subramaniam.
Footnotes
Publisher's Disclaimer: This is a PDF file of an unedited manuscript that has been accepted for publication. As a service to our customers we are providing this early version of the manuscript. The manuscript will undergo copyediting, typesetting, and review of the resulting proof before it is published in its final citable form. Please note that during the production process errors may be discovered which could affect the content, and all legal disclaimers that apply to the journal pertain.
References
- Albarran-Zeckler RG, Brantley AF, Smith RG. Growth hormone secretagogue receptor (GHS-R1a) knockout mice exhibit improved spatial memory and deficits in contextual memory. Behav Brain Res. 2012;232(1):13–9. doi: 10.1016/j.bbr.2012.03.012. [DOI] [PMC free article] [PubMed] [Google Scholar]
- Alves MM, Fuhler GM, Queiroz KC, Scholma J, Goorden S, Anink J, Spek CA, Hoogeveen-Westerveld M, Bruno MJ, Nellist M, Elgersma Y, Aronica E, Peppelenbosch MP. PAK2 is an effector of TSC1/2 signaling independent of mTOR and a potential therapeutic target for Tuberous Sclerosis Complex. Scientific reports. 2015;5:14534. doi: 10.1038/srep14534. [DOI] [PMC free article] [PubMed] [Google Scholar]
- An WL, Cowburn RF, Li L, Braak H, Alafuzoff I, Iqbal K, Iqbal IG, Winblad B, Pei JJ. Upregulation of phosphorylated/activated p70 S6 kinase and its relationship to neurofibrillary pathology in Alzheimer’s disease. The American journal of pathology. 2003;163(2):591–607. doi: 10.1016/S0002-9440(10)63687-5. [DOI] [PMC free article] [PubMed] [Google Scholar]
- Arendt T, Bruckner MK, Morawski M, Jager C, Gertz HJ. Early neurone loss in Alzheimer’s disease: cortical or subcortical? Acta neuropathologica communications. 2015;3:10. doi: 10.1186/s40478-015-0187-1. [DOI] [PMC free article] [PubMed] [Google Scholar]
- Bailey KR, Crawley JN. Anxiety-Related Behaviors in Mice. In: Buccafusco JJ, editor. Methods of Behavior Analysis in Neuroscience. Boca Raton (FL): 2009. [Google Scholar]
- Caccamo A, Branca C, Talboom JS, Shaw DM, Turner D, Ma L, Messina A, Huang Z, Wu J, Oddo S. Reducing Ribosomal Protein S6 Kinase 1 Expression Improves Spatial Memory and Synaptic Plasticity in a Mouse Model of Alzheimer’s Disease. The Journal of neuroscience: the official journal of the Society for Neuroscience. 2015;35(41):14042–56. doi: 10.1523/JNEUROSCI.2781-15.2015. [DOI] [PMC free article] [PubMed] [Google Scholar]
- Caccamo A, De Pinto V, Messina A, Branca C, Oddo S. Genetic reduction of mammalian target of rapamycin ameliorates Alzheimer’s disease-like cognitive and pathological deficits by restoring hippocampal gene expression signature. The Journal of neuroscience: the official journal of the Society for Neuroscience. 2014;34(23):7988–98. doi: 10.1523/JNEUROSCI.0777-14.2014. [DOI] [PMC free article] [PubMed] [Google Scholar]
- Caccamo A, Majumder S, Richardson A, Strong R, Oddo S. Molecular interplay between mammalian target of rapamycin (mTOR), amyloid-beta, and Tau: effects on cognitive impairments. The Journal of biological chemistry. 2010;285(17):13107–20. doi: 10.1074/jbc.M110.100420. [DOI] [PMC free article] [PubMed] [Google Scholar]
- Chang RC, Wong AK, Ng HK, Hugon J. Phosphorylation of eukaryotic initiation factor-2alpha (eIF2alpha) is associated with neuronal degeneration in Alzheimer’s disease. Neuroreport. 2002;13(18):2429–32. doi: 10.1097/01.wnr.0000048020.74602.bb. [DOI] [PubMed] [Google Scholar]
- Chen Y, Huang WC, Sejourne J, Clipperton-Allen AE, Page DT. Pten Mutations Alter Brain Growth Trajectory and Allocation of Cell Types through Elevated beta-Catenin Signaling. The Journal of neuroscience: the official journal of the Society for Neuroscience. 2015;35(28):10252–67. doi: 10.1523/JNEUROSCI.5272-14.2015. [DOI] [PMC free article] [PubMed] [Google Scholar]
- Cheng X, He P, Lee T, Yao H, Li R, Shen Y. High activities of BACE1 in brains with mild cognitive impairment. The American journal of pathology. 2014;184(1):141–7. doi: 10.1016/j.ajpath.2013.10.002. [DOI] [PMC free article] [PubMed] [Google Scholar]
- Crawley JN, Belknap JK, Collins A, Crabbe JC, Frankel W, Henderson N, Hitzemann RJ, Maxson SC, Miner LL, Silva AJ, Wehner JM, Wynshaw-Boris A, Paylor R. Behavioral phenotypes of inbred mouse strains: implications and recommendations for molecular studies. Psychopharmacology (Berl) 1997;132(2):107–24. doi: 10.1007/s002130050327. [DOI] [PubMed] [Google Scholar]
- Deacon RM, Rawlins JN. T-maze alternation in the rodent. Nat Protoc. 2006;1(1):7–12. doi: 10.1038/nprot.2006.2. [DOI] [PubMed] [Google Scholar]
- Devi L, Ohno M. Phospho-eIF2alpha level is important for determining abilities of BACE1 reduction to rescue cholinergic neurodegeneration and memory defects in 5XFAD mice. PloS one. 2010;5(9):e12974. doi: 10.1371/journal.pone.0012974. [DOI] [PMC free article] [PubMed] [Google Scholar]
- Dragatsis I, Zeitlin S. CaMKIIalpha-Cre transgene expression and recombination patterns in the mouse brain. Genesis. 2000;26(2):133–5. doi: 10.1002/(sici)1526-968x(200002)26:2<133::aid-gene10>3.0.co;2-v. [DOI] [PubMed] [Google Scholar]
- Ehninger D. From genes to cognition in tuberous sclerosis: implications for mTOR inhibitor-based treatment approaches. Neuropharmacology. 2013;68:97–105. doi: 10.1016/j.neuropharm.2012.05.015. [DOI] [PubMed] [Google Scholar]
- Ehninger D, Han S, Shilyansky C, Zhou Y, Li W, Kwiatkowski DJ, Ramesh V, Silva AJ. Reversal of learning deficits in a Tsc2+/− mouse model of tuberous sclerosis. Nat Med. 2008;14(8):843–8. doi: 10.1038/nm1788. [DOI] [PMC free article] [PubMed] [Google Scholar]
- Ehninger D, Neff F, Xie K. Longevity, aging and rapamycin. Cellular and molecular life sciences: CMLS. 2014;71(22):4325–46. doi: 10.1007/s00018-014-1677-1. [DOI] [PMC free article] [PubMed] [Google Scholar]
- Frisoni GB, Laakso MP, Beltramello A, Geroldi C, Bianchetti A, Soininen H, Trabucchi M. Hippocampal and entorhinal cortex atrophy in frontotemporal dementia and Alzheimer’s disease. Neurology. 1999;52(1):91–100. doi: 10.1212/wnl.52.1.91. [DOI] [PubMed] [Google Scholar]
- Gallagher M, Burwell R, Burchinal M. Severity of spatial learning impairment in aging: development of a learning index for performance in the Morris water maze. Behav Neurosci. 1993;107(4):618–26. doi: 10.1037//0735-7044.107.4.618. [DOI] [PubMed] [Google Scholar]
- Goorden SM, Abs E, Bruinsma CF, Riemslagh FW, van Woerden GM, Elgersma Y. Intact neuronal function in Rheb1 mutant mice: implications for TORC1-based treatments. Human molecular genetics. 2015;24(12):3390–8. doi: 10.1093/hmg/ddv087. [DOI] [PubMed] [Google Scholar]
- Goorden SM, Hoogeveen-Westerveld M, Cheng C, van Woerden GM, Mozaffari M, Post L, Duckers HJ, Nellist M, Elgersma Y. Rheb is essential for murine development. Mol Cell Biol. 2011;31(8):1672–8. doi: 10.1128/MCB.00985-10. [DOI] [PMC free article] [PubMed] [Google Scholar]
- Grant WB. Using Multicountry Ecological and Observational Studies to Determine Dietary Risk Factors for Alzheimer’s Disease. J Am Coll Nutr. 2016;35(5):476–89. doi: 10.1080/07315724.2016.1161566. [DOI] [PubMed] [Google Scholar]
- Hanson JE, Orr AL, Madison DV. Altered hippocampal synaptic physiology in aged parkin-deficient mice. Neuromolecular Med. 2010;12(3):270–6. doi: 10.1007/s12017-010-8113-y. [DOI] [PMC free article] [PubMed] [Google Scholar]
- Hoozemans JJ, Veerhuis R, Van Haastert ES, Rozemuller JM, Baas F, Eikelenboom P, Scheper W. The unfolded protein response is activated in Alzheimer’s disease. Acta neuropathologica. 2005;110(2):165–72. doi: 10.1007/s00401-005-1038-0. [DOI] [PubMed] [Google Scholar]
- Johnson SC, Rabinovitch PS, Kaeberlein M. mTOR is a key modulator of ageing and age-related disease. Nature. 2013;493(7432):338–45. doi: 10.1038/nature11861. [DOI] [PMC free article] [PubMed] [Google Scholar]
- Juhasz G, Erdi B, Sass M, Neufeld TP. Atg7-dependent autophagy promotes neuronal health, stress tolerance, and longevity but is dispensable for metamorphosis in Drosophila. Genes Dev. 2007;21(23):3061–6. doi: 10.1101/gad.1600707. [DOI] [PMC free article] [PubMed] [Google Scholar]
- Kandalepas PC, Vassar R. Identification and biology of beta-secretase. Journal of neurochemistry. 2012;120(Suppl 1):55–61. doi: 10.1111/j.1471-4159.2011.07512.x. [DOI] [PubMed] [Google Scholar]
- Korolchuk VI, Menzies FM, Rubinsztein DC. Mechanisms of cross-talk between the ubiquitin-proteasome and autophagy-lysosome systems. FEBS Lett. 2010;584(7):1393–8. doi: 10.1016/j.febslet.2009.12.047. [DOI] [PubMed] [Google Scholar]
- Kuhn PH, Koroniak K, Hogl S, Colombo A, Zeitschel U, Willem M, Volbracht C, Schepers U, Imhof A, Hoffmeister A, Haass C, Rossner S, Brase S, Lichtenthaler SF. Secretome protein enrichment identifies physiological BACE1 protease substrates in neurons. EMBO J. 2012;31(14):3157–68. doi: 10.1038/emboj.2012.173. [DOI] [PMC free article] [PubMed] [Google Scholar]
- Laakso MP, Frisoni GB, Kononen M, Mikkonen M, Beltramello A, Geroldi C, Bianchetti A, Trabucchi M, Soininen H, Aronen HJ. Hippocampus and entorhinal cortex in frontotemporal dementia and Alzheimer’s disease: a morphometric MRI study. Biological psychiatry. 2000;47(12):1056–63. doi: 10.1016/s0006-3223(99)00306-6. [DOI] [PubMed] [Google Scholar]
- Lalonde R. The neurobiological basis of spontaneous alternation. Neurosci Biobehav Rev. 2002;26(1):91–104. doi: 10.1016/s0149-7634(01)00041-0. [DOI] [PubMed] [Google Scholar]
- Lamming DW, Ye L, Katajisto P, Goncalves MD, Saitoh M, Stevens DM, Davis JG, Salmon AB, Richardson A, Ahima RS, Guertin DA, Sabatini DM, Baur JA. Rapamycin-induced insulin resistance is mediated by mTORC2 loss and uncoupled from longevity. Science. 2012;335(6076):1638–43. doi: 10.1126/science.1215135. [DOI] [PMC free article] [PubMed] [Google Scholar]
- Mattson MP, Magnus T. Ageing and neuronal vulnerability. Nature reviews Neuroscience. 2006;7(4):278–94. doi: 10.1038/nrn1886. [DOI] [PMC free article] [PubMed] [Google Scholar]
- Mizutani T, Kasahara M. Hippocampal atrophy secondary to entorhinal cortical degeneration in Alzheimer-type dementia. Neurosci Lett. 1997;222(2):119–22. doi: 10.1016/s0304-3940(97)13365-1. [DOI] [PubMed] [Google Scholar]
- Neuman NA, Henske EP. Non-canonical functions of the tuberous sclerosis complex-Rheb signalling axis. EMBO molecular medicine. 2011;3(4):189–200. doi: 10.1002/emmm.201100131. [DOI] [PMC free article] [PubMed] [Google Scholar]
- Ohno M. Alzheimer’s therapy targeting the beta-secretase enzyme BACE1: Benefits and potential limitations from the perspective of animal model studies. Brain Res Bull. 2016;126(Pt 2):183–98. doi: 10.1016/j.brainresbull.2016.04.007. [DOI] [PubMed] [Google Scholar]
- Onal M, Piemontese M, Xiong J, Wang Y, Han L, Ye S, Komatsu M, Selig M, Weinstein RS, Zhao H, Jilka RL, Almeida M, Manolagas SC, O’Brien CA. Suppression of autophagy in osteocytes mimics skeletal aging. The Journal of biological chemistry. 2013;288(24):17432–40. doi: 10.1074/jbc.M112.444190. [DOI] [PMC free article] [PubMed] [Google Scholar]
- Panepinto JC, Oliver BG, Amlung TW, Askew DS, Rhodes JC. Expression of the Aspergillus fumigatus rheb homologue, rhbA, is induced by nitrogen starvation. Fungal genetics and biology: FG & B. 2002;36(3):207–14. doi: 10.1016/s1087-1845(02)00022-1. [DOI] [PubMed] [Google Scholar]
- Pedrini S, Thomas C, Brautigam H, Schmeidler J, Ho L, Fraser P, Westaway D, Hyslop PS, Martins RN, Buxbaum JD, Pasinetti GM, Dickstein DL, Hof PR, Ehrlich ME, Gandy S. Dietary composition modulates brain mass and solubilizable Abeta levels in a mouse model of aggressive Alzheimer’s amyloid pathology. Mol Neurodegener. 2009;4:40. doi: 10.1186/1750-1326-4-40. [DOI] [PMC free article] [PubMed] [Google Scholar]
- Pham J, Cabrera SM, Sanchis-Segura C, Wood MA. Automated scoring of fear-related behavior using EthoVision software. J Neurosci Methods. 2009;178(2):323–6. doi: 10.1016/j.jneumeth.2008.12.021. [DOI] [PMC free article] [PubMed] [Google Scholar]
- Pryor WM, Biagioli M, Shahani N, Swarnkar S, Huang WC, Page DT, MacDonald ME, Subramaniam S. Huntingtin promotes mTORC1 signaling in the pathogenesis of Huntington’s disease. Sci Signa. 2014;17(349):ra103. doi: 10.1126/scisignal.2005633. [DOI] [PubMed] [Google Scholar]
- Ravikumar B, Vacher C, Berger Z, Davies JE, Luo S, Oroz LG, Scaravilli F, Easton DF, Duden R, O’Kane CJ, Rubinsztein DC. Inhibition of mTOR induces autophagy and reduces toxicity of polyglutamine expansions in fly and mouse models of Huntington disease. Nature genetics. 2004;36(6):585–95. doi: 10.1038/ng1362. [DOI] [PubMed] [Google Scholar]
- Rozas NS, Redell JB, Pita-Almenar JD, McKenna J, 3rd, Moore AN, Gambello MJ, Dash PK. Intrahippocampal glutamine administration inhibits mTORC1 signaling and impairs long-term memory. Learning & memory. 2015;22(5):239–46. doi: 10.1101/lm.038265.115. [DOI] [PMC free article] [PubMed] [Google Scholar]
- Rubinsztein DC, Marino G, Kroemer G. Autophagy and aging. Cell. 2011;146(5):682–95. doi: 10.1016/j.cell.2011.07.030. [DOI] [PubMed] [Google Scholar]
- Ruckenstuhl C, Netzberger C, Entfellner I, Carmona-Gutierrez D, Kickenweiz T, Stekovic S, Gleixner C, Schmid C, Klug L, Sorgo AG, Eisenberg T, Buttner S, Marino G, Koziel R, Jansen-Durr P, Frohlich KU, Kroemer G, Madeo F. Lifespan extension by methionine restriction requires autophagy-dependent vacuolar acidification. PLoS Genet. 2014;10(5):e1004347. doi: 10.1371/journal.pgen.1004347. [DOI] [PMC free article] [PubMed] [Google Scholar]
- Saito K, Araki Y, Kontani K, Nishina H, Katada T. Novel role of the small GTPase Rheb: its implication in endocytic pathway independent of the activation of mammalian target of rapamycin. Journal of biochemistry. 2005;137(3):423–30. doi: 10.1093/jb/mvi046. [DOI] [PubMed] [Google Scholar]
- Saucedo LJ, Gao X, Chiarelli DA, Li L, Pan D, Edgar BA. Rheb promotes cell growth as a component of the insulin/TOR signalling network. Nat Cell Biol. 2003;5(6):566–71. doi: 10.1038/ncb996. [DOI] [PubMed] [Google Scholar]
- Segev Y, Michaelson DM, Rosenblum K. ApoE epsilon4 is associated with eIF2alpha phosphorylation and impaired learning in young mice. Neurobiology of aging. 2013;34(3):863–72. doi: 10.1016/j.neurobiolaging.2012.06.020. [DOI] [PubMed] [Google Scholar]
- Shahani N, Pryor W, Swarnkar S, Kholodilov N, Thinakaran G, Burke RE, Subramaniam S. Rheb GTPase regulates beta-secretase levels and amyloid beta generation. The Journal of biological chemistry. 2014;289(9):5799–808. doi: 10.1074/jbc.M113.532713. [DOI] [PMC free article] [PubMed] [Google Scholar]
- Sinha S, Anderson JP, Barbour R, Basi GS, Caccavello R, Davis D, Doan M, Dovey HF, Frigon N, Hong J, Jacobson-Croak K, Jewett N, Keim P, Knops J, Lieberburg I, Power M, Tan H, Tatsuno G, Tung J, Schenk D, Seubert P, Suomensaari SM, Wang S, Walker D, Zhao J, McConlogue L, John V. Purification and cloning of amyloid precursor protein beta-secretase from human brain. Nature. 1999;402(6761):537–40. doi: 10.1038/990114. [DOI] [PubMed] [Google Scholar]
- Spilman P, Podlutskaya N, Hart MJ, Debnath J, Gorostiza O, Bredesen D, Richardson A, Strong R, Galvan V. Inhibition of mTOR by rapamycin abolishes cognitive deficits and reduces amyloid-beta levels in a mouse model of Alzheimer’s disease. PloS one. 2010;5(4):e9979. doi: 10.1371/journal.pone.0009979. [DOI] [PMC free article] [PubMed] [Google Scholar]
- Stoica L, Zhu PJ, Huang W, Zhou H, Kozma SC, Costa-Mattioli M. Selective pharmacogenetic inhibition of mammalian target of Rapamycin complex I (mTORC1) blocks long-term synaptic plasticity and memory storage. Proceedings of the National Academy of Sciences of the United States of America. 2011;108(9):3791–6. doi: 10.1073/pnas.1014715108. [DOI] [PMC free article] [PubMed] [Google Scholar]
- Sui L, Wang J, Li BM. Role of the phosphoinositide 3-kinase-Akt-mammalian target of the rapamycin signaling pathway in long-term potentiation and trace fear conditioning memory in rat medial prefrontal cortex. Learning & memory. 2008;15(10):762–76. doi: 10.1101/lm.1067808. [DOI] [PubMed] [Google Scholar]
- Swarnkar S, Chen Y, Pryor WM, Shahani N, Page DT, Subramaniam S. Ectopic expression of the striatal-enriched GTPase Rhes elicits cerebellar degeneration and an ataxia phenotype in Huntington’s disease. Neurobiology of disease. 2015;82:66–77. doi: 10.1016/j.nbd.2015.05.011. [DOI] [PubMed] [Google Scholar]
- Tang SJ, Reis G, Kang H, Gingras AC, Sonenberg N, Schuman EM. A rapamycin-sensitive signaling pathway contributes to long-term synaptic plasticity in the hippocampus. Proceedings of the National Academy of Sciences of the United States of America. 2002;99(1):467–72. doi: 10.1073/pnas.012605299. [DOI] [PMC free article] [PubMed] [Google Scholar]
- Tramutola A, Triplett JC, Di Domenico F, Niedowicz DM, Murphy MP, Coccia R, Perluigi M, Butterfield DA. Alteration of mTOR signaling occurs early in the progression of Alzheimer disease (AD): analysis of brain from subjects with pre-clinical AD, amnestic mild cognitive impairment and late-stage AD. Journal of neurochemistry. 2015;133(5):739–49. doi: 10.1111/jnc.13037. [DOI] [PubMed] [Google Scholar]
- Tyagi R, Shahani N, Gorgen L, Ferretti M, Pryor W, Chen PY, Swarnkar S, Worley PF, Karbstein K, Snyder SH, Subramaniam S. Rheb Inhibits Protein Synthesis by Activating the PERK-eIF2alpha Signaling Cascade. Cell Rep. 2015 doi: 10.1016/j.celrep.2015.01.014. [DOI] [PMC free article] [PubMed] [Google Scholar]
- Vassar R, Bennett BD, Babu-Khan S, Kahn S, Mendiaz EA, Denis P, Teplow DB, Ross S, Amarante P, Loeloff R, Luo Y, Fisher S, Fuller J, Edenson S, Lile J, Jarosinski MA, Biere AL, Curran E, Burgess T, Louis JC, Collins F, Treanor J, Rogers G, Citron M. Beta-secretase cleavage of Alzheimer’s amyloid precursor protein by the transmembrane aspartic protease BACE. Science. 1999;286(5440):735–41. doi: 10.1126/science.286.5440.735. [DOI] [PubMed] [Google Scholar]
- Vassar R, Kandalepas PC. The beta-secretase enzyme BACE1 as a therapeutic target for Alzheimer’s disease. Alzheimers Res Ther. 2011;3(3):20. doi: 10.1186/alzrt82. [DOI] [PMC free article] [PubMed] [Google Scholar]
- Vorhees CV, Williams MT. Morris water maze: procedures for assessing spatial and related forms of learning and memory. Nat Protoc. 2006;1(2):848–58. doi: 10.1038/nprot.2006.116. [DOI] [PMC free article] [PubMed] [Google Scholar]
- Wenk GL. Assessment of spatial memory using the radial arm maze and Morris water maze. Curr Protoc Neurosci. 2004 doi: 10.1002/0471142301.ns0805as26. Chapter 8, Unit 8 5A. [DOI] [PubMed] [Google Scholar]
- Yamagata K, Sanders LK, Kaufmann WE, Yee W, Barnes CA, Nathans D, Worley PF. rheb, a growth factor- and synaptic activity-regulated gene, encodes a novel Ras-related protein. The Journal of biological chemistry. 1994;269(23):16333–9. [PubMed] [Google Scholar]
- Young JW, Powell SB, Scott CN, Zhou X, Geyer MA. The effect of reduced dopamine D4 receptor expression in the 5-choice continuous performance task: Separating response inhibition from premature responding. Behav Brain Res. 2011;222(1):183–92. doi: 10.1016/j.bbr.2011.03.054. [DOI] [PMC free article] [PubMed] [Google Scholar]
- Zou J, Zhou L, Du XX, Ji Y, Xu J, Tian J, Jiang W, Zou Y, Yu S, Gan L, Luo M, Yang Q, Cui Y, Yang W, Xia X, Chen M, Zhao X, Shen Y, Chen PY, Worley PF, Xiao B. Rheb1 is required for mTORC1 and myelination in postnatal brain development. Dev Cell. 2011;20(1):97–108. doi: 10.1016/j.devcel.2010.11.020. [DOI] [PMC free article] [PubMed] [Google Scholar]
Associated Data
This section collects any data citations, data availability statements, or supplementary materials included in this article.
Supplementary Materials
(A) Representative images of hippocampal sections immunohistochemically stained for cleaved caspase-3, and NeuN in Rhebf/f& Rhebf/+ (Con), cRhebf/+;CamKIICre (Rheb-Het), cRhebf/f;CamKIICre (Rheb-Null) mice. Scale bar: 500μm. (B) Quantification of number of cleaved caspase-3-positive in hippocampus of Con, Rheb-Het, and Rheb-Null mice. Numbers of cleaved caspase-3-positive cells per mm2 are given as mean ± SEM, one-way ANOVA followed by Tukey’s post hoc test was used. No significant difference was found between the groups. N=3 animals per genotype.