

Abstract
Objectives
The use of ultrasound imaging for cancer diagnosis and screening can be enhanced with the use of molecularly targeted microbubbles. Nonlinear imaging strategies such as pulse inversion (PI) and “contrast pulse sequences” (CPS) can be used to differentiate microbubble signal, but often fail to suppress highly echogenic tissue interfaces. This failure results in false positive detection and potential misdiagnosis. In this study, a novel Acoustic Radiation Force (ARF) based approach was developed for superior microbubble signal detection. The feasibility of this technique, termed ARF-decorrelation-weighted PI (ADW-PI), was demonstrated in vivo using a subcutaneous mouse tumor model.
Materials and Methods
Tumors were implanted in the hindlimb of C57BL/6 mice by subcutaneous injection of MC38 cells. Lipid-shelled microbubbles were conjugated to anti-VEGFR2 antibody and administered via bolus injection. An image sequence using ARF pulses to generate microbubble motion was combined with PI imaging on a Verasonics Vantage programmable scanner. ADW-PI images were generated by combining PI images with inter-frame signal decorrelation data. For comparison, CPS images of the same mouse tumor were acquired using a Siemens Sequoia clinical scanner.
Results
Microbubble-bound regions in the tumor interior exhibited significantly higher signal decorrelation than static tissue (n = 9, p < 0.001). The application of ARF significantly increased microbubble signal decorrelation (n = 9, p < 0.01). Using these decorrelation measurements, ADW-PI imaging demonstrated significantly improved microbubble contrast-to-tissue ratio (CTR) when compared to corresponding CPS or PI images (n = 9, p < 0.001). CTR improved with ADW-PI by approximately 3 dB compared to PI images and 2 dB compared to CPS images.
Conclusions
Acoustic radiation force can be used to generate adherent microbubble signal decorrelation without microbubble bursting. When combined with pulse inversion, measurements of the resulting microbubble signal decorrelation can be used to reconstruct images that exhibit superior suppression of highly echogenic tissue interfaces when compared to PI or CPS alone.
Keywords: ultrasound, microbubbles, molecular imaging, acoustic radiation force, tumor
2. Introduction
Microbubbles are lipid-shelled perfluorocarbon gas bubbles which are used as ultrasound contrast agents for medical imaging due to their high echogenicity and biocompatibility1–3. When insonified at diagnostic ultrasound frequencies, microbubbles exhibit a substantial nonlinear response, which may be relatively easy to distinguish from linear reflections (i.e. fundamental, nonharmonic echoes) produced by most tissues4. Because of their high echogenicity and generation of harmonic signals, non-targeted microbubbles are currently approved for use in medical settings to visualize left ventricular opacification5. Other studies have employed non-targeted microbubbles in patients with hepatocellular carcinomas to enhance the signal of color or power Doppler and increase diagnostic confidence6–10. However, the ability of microbubbles to perfuse into the microvasculature has led to growing interest in the molecular targeting of microbubbles in tumor settings, where circulating microbubbles can bind specifically to cancer disease markers present on endothelial tissue11,12. The ability to identify tumorigenic tissue based on molecular targeting rather than the presence of anatomical features can greatly improve the sensitivity and specificity of diagnostic ultrasound imaging. There is a growing body of interest in using targeted microbubbles for enhanced screening and treatment monitoring of cancer, particularly in the prostate12,13. Phase 0 clinical trials have already been completed using commercial BR55 microbubbles14–16 in human prostate cancer patients (Clinical Trial ID: NCT01253213); Phase 1-2 studies are now in progress (Clinical Trial ID: NCT02142608).
Common nonlinear microbubble imaging techniques such as “contrast pulse sequences” (CPS)17 or pulse inversion (PI)18 are often used to visualize microbubbles through the extraction of harmonic signals. However, these methods are susceptible to misclassifying harmonic signals produced by highly echogenic tissue surfaces such as bone or vascular walls19. Therefore, one significant challenge in imaging ultrasound contrast agents is isolating the harmonic signal generated by tissue-bound microbubbles while suppressing harmonic signal from all other tissues20. The limitations of traditional nonlinear imaging techniques are directly related to the physical properties of static tissue, since highly echogenic tissue boundaries tend to generate harmonic signal. While the harmonic-to-fundamental ratio within tissue may be lower than that of microbubbles, sufficiently echogenic tissue interfaces will generate reflections in both the fundamental and harmonic frequencies strong enough to be clearly visible in most ultrasound imaging systems19. Moreover, harmonic signal amplitudes increase nonlinearly with transmit power, which compounds this effect as transmit pressure increases21.
Since conventional contrast pulse sequence techniques exhibit insufficient cancellation of harmonics from highly echogenic tissue interfaces, new strategies are needed. Several groups have recently proposed new strategies involving time domain filters rather than the frequency domain, as a way to better isolate microbubble signal based on the rapid disappearance of bound microbubbles in response to destructive or near-destructive acoustic pressures. Couture and colleagues developed a form of ultrafast imaging to isolate the signal from bound microbubbles in vitro based on the rapid changes in microbubble signal intensity immediately before and after the administration of a disruption pulse22. Our lab has previously demonstrated that signal from adherent microbubbles in large vessel environments can be isolated based on the distinct statistical signature exhibited by microbubbles in response to shear forces from flow, without the administration of a destruction pulse20,23–26.
Acoustic radiation force has been employed in several past studies to encourage the specific binding of microbubbles to the vascular wall, both in vivo and in vitro27–31. In this study, ARF is not applied to facilitate microbubble targeting, but instead to induce motion of the adherent microbubbles. It is hypothesized that the applied ARF induces small microbubble displacements which give rise to a unique decorrelation signal.
In this study, we sought to use non-destructive imaging pressures to induce small movements of microbubbles, and separate the movement of microbubbles from static tissue based on their unique interframe signal decorrelation properties. Real-time signal decorrelation data was used to visualize bound microbubbles within the microvasculature, where individual vessels and the vessel wall cannot be resolved at typical diagnostic ultrasound frequencies. Decorrelation data was combined with traditional non-linear imaging and harmonic filtering techniques in order to achieve improved contrast-to-tissue ratio (CTR) and signal specificity. Results demonstrated that combining ARF with interframe signal decorrelation of microbubbles can attenuate strong signal from echogenic tissue reflectors to an extent that has not been achieved by previous nonlinear imaging methods.
3. Materials and Methods
3.1. Microbubble Preparation
Biotinylated gas-filled microbubbles were produced by a standard sonication protocol32 from decafluorobutane gas (F2 Chemicals, Lancashire, UK) by dispersing gas in a lipid micellar mixture of distearoyl phosphatidylcholine (Avanti Polar Lipids, Alabaster, AL, USA), polyethylene glycol stearate (Stepan Kessco, Elwood, IL, USA) and biotin-PEG3400-distearoylphosphatidylethanolamine (PEG- DSPE, Shearwater Polymers, Huntsville, AL, USA) in normal saline to create microbubbles coated with a lipid monolayer shell. Following preparation, microbubbles were sealed in vials under decafluorobutane headspace atmosphere and stored refrigerated. Immediately prior to antibody coupling, microbubbles were centrifuged for 10 minutes (140 g) in degassed phosphate-buffered saline (PBS) to eliminate the excess of unincorporated lipid from the solution and counted using a Coulter Multisizer 3 (Beckman Coulter, Brea, CA, USA).
Biotinylated microbubbles were conjugated to biotinylated anti-mouse VEGFR2 antibody (clone Avas 12a1, eBioscience, San Diego, CA, USA)14,33–35 using streptavidin (Anaspec Inc, Fremont, CA, USA) as a linking molecule36. Streptavidin was added to the biotinylated microbubble solution at a concentration of 3 μg/10 million microbubbles and incubated for 15 minutes at room temperature. During incubation, the microbubbles were gently agitated every 2 minutes to ensure mixing. This microbubble solution was washed twice with PBS to remove excess streptavidin and counted again. Next, the biotinylated anti-VEGFR2 antibody was added to the microbubbles at 1.5 μg per 10 million microbubbles and incubated for 10 min. Two more washing steps were performed to remove the excess antibody. Microbubble count and size distribution was acquired before each experiment.
3.2. In Vivo Mouse Model
Following an institutionally approved Animal Care and Use Committee protocol, female C57BL/6 mice received subcutaneous hindlimb injections of murine colon adenocarcinoma cells (MC38, generously provided by Dr. J Schlom, National Institutes of Health, Bethesda, MD). The tumors were allowed to grow for approximately 10 days. During imaging, the mice were anesthetized with 2% isoflurane gas (Henry Schein, Dublin, OH, USA) and secured on a heated motion stage (TM150, Indus Instruments, Webster, TX, USA) in the prone position. The tumor-carrying leg was secured and the skin over the tumor was depilated. An imaging plane within the tumor was located using a Verasonics programmable scanner, and the transducer was secured in place. The tumor was imaged prior to microbubble injection. A bolus injection of 2 × 10⁷ microbubbles was administered retro-orbitally and allowed to circulate and bind for 15 min before imaging37–40. The microbubble-bound tumors were then imaged again using a Verasonics programmable scanner and a Siemens Sequoia commercial scanner (Fig. 1).
Figure 1.

Sequence of imaging events used to create one frame of an ADW-PI image. An initial 5.5 MHz PI transmit signal was followed immediately by an 11 MHz B-mode transmit signal. A train of 10 ARF waveforms (4.5 MHz) was then transmitted at a PRF of 11.4 kHz for 875μs, followed by post-ARF PI and B-mode transmissions identical to the first transmits. This entire sequence was repeated at a framerate of 15 Hz for 5 seconds. In control experiments, the ARF waveforms were omitted.
3.3. Tumor Imaging and Measurement of ARF-based Signal Decorrelation
Tumors were imaged using a 128-element L12-5 38mm linear array transducer (Philips Healthcare, Andover, MA, USA). The imaging sequence was programmed on a Verasonics programmable ultrasound scanner (Vantage 256, Verasonics, Redmond, WA, USA) and involved a combination of pulse inversion (PI) and synthetic aperture virtual source element (SAVSE) imaging23–24. The 64 central transmit and receive elements were designated as the synthetic aperture, with 22 virtual source elements distributed laterally with foci located 35 mm behind the transducer face. Each virtual source element transmitted a positive and negative waveform, and the resulting 44 receive signals (one positive and one negative receive for each source element) were summed to create one complete PI image. This PI image acquisition was followed by a B-mode image, in which only the positive transmit/receive signals from each virtual source were performed and summed. PI imaging was transmitted at a frequency of 5.5MHz, and a bandpass filter was applied to the receive signal, centered at the first harmonic (11 MHz). B-mode transmit and receive was performed at a center frequency of 11 MHz, within the passband of the applied filter. In-phase/quadrature (IQ) data was used for all receive signals in order to preserve variations in both signal amplitude and phase.
Control sequences in which no ARF was applied consisted of one PI image and one B-mode image, followed by a delay of approximately 3 ms, then a second PI and B-mode image acquisition. The transducer position was held stationary throughout all B-mode and PI image sequences in a given tumor. In the ARF sequences, ten 15-cycle, 4.4 MHz ARF waveforms were transmitted at a pulse repetition frequency (PRF) of 11.4 kHz for 875 μs during the 3 ms delay (Fig. 1). For both control and ARF sequences, the complete sequence of transmit events was repeated at a frame rate of approximately 15 Hz for 5 seconds. ARF transmissions had a measured MI of 0.12 and peak negative pressure of approximately 0.25 MPa. For comparison to a commercially available standard of nonlinear imaging43, CPS images of the microbubble-bound tumor were taken using a Siemens Sequoia clinical scanner with a 15L8-5 transducer, at a center frequency of 7 MHz and frame rate of 12 Hz. These images were taken immediately after the ARF and no-ARF trial data had been collected.
After data acquisition, pairs of B-mode and PI images corresponding to events directly before and after the application of ARF were used to assess localized decorrelation. As described in the next section, measurements of signal decorrelation at each image pixel were then used to weight the intensity of the original PI images. Decorrelation-weighted PI images were generated for both pre-injection and post-injection data sets within a given tumor. The purpose of the pre-injection image data was to serve as a control to determine that the imaging technique accentuated the tumor interior only when microbubbles were present. Contrast between pre-injection and post-injection signal intensity was measured based on regions of interest within the tumor interior. Microbubble CTR was calculated from regions of interest within decorrelation-weighted PI images selected both inside the tumor, where microbubbles were visible, and outside of the tumor, where static tissue was visible. Corresponding Sequoia CPS images were matched to the same tumors and analyzed for calculation of microbubble CTR. Since acquisition of CPS images required the use of a different scanner, the exact same imaging plane could not be compared between CPS and PI imaging modes. To obtain CPS images that were comparable to those taken using the Verasonics scanner, free-hand CPS data was acquired while sweeping the scanner imaging plane across the tumor volume. Then, a representative image that best matched the size and orientation of the original tumor image was selected for analysis.
3.4. ARF Decorrelation-Weighted PI Filtering
ADW-PI images created from mouse tumor images in a multi-step process as illustrated by Fig 2. Incoming data from PI image sequences (Fig 2a) were in the form of IQ sample data. For each sample in an image, a 3 × 3 window surrounding the sample of interest was selected for both pre-ARF and post-ARF images. The correlation coefficient between pre-ARF and post-ARF windows was calculated using the “corrCoef” function in MATLAB, and signal decorrelation was calculated as the complement of signal correlation. This calculation, when performed for all samples in the image, resulted in a decorrelation image.
Figure 2.

Flowchart showing the basic processing steps used to generate the ARF-decorrelation-weighted image of a mouse tumor with adherent targeted microbubbles. Signal decorrelation was measured between pre-ARF and post-ARF PI frames (a). Decorrelation due to electronic noise (b) was calculated and subtracted from the raw decorrelation image, resulting in a “Motion-Based Decorrelation” image (c). A Gaussian-shaped remapping filter (d) centered at the decorrelation of microbubbles was used to eliminate low-decorrelation signal from tissue and high-decorrelation signal from random electronic noise. The resulting decorrelation-weighted remapping filter (e) was used to weight the intensity of one of the original PI frames to produce the final ARF-decorrelation-weighted pulse inversion image (f).
Measured signal decorrelation between PI frames was assumed to arise from two additive sources: motion and electronic noise. In order to isolate decorrelation arising from motion only, several processing steps were performed to estimate, and account for, the decorrelation due to electronic noise. In order to estimate decorrelation from electronic noise, it was assumed that signal decorrelation arising from electronic noise could be approximated by the following equation44:
| (1) |
where ρr1r2 is the SNR-based correlation coefficient between two signals. A measurement of noise intensity through depth was acquired by collecting 50 frames of receive data without any transmission signal while applying the same time gain compensation (TGC) settings as used in all imaging experiments. In the absence of an ultrasound transmit, only electronic noise was received by the system. Each A-line of each frame of electronic noise was averaged to obtain an approximation of noise intensity though depth (Fig. 2b). To estimate the combined signal and noise intensity for each ultrasound image, a root-mean-squared (RMS) calculation was performed for every sample in the PI image using a 3×3 window of values from which to calculate RMS. An estimate of the signal and noise could then be computed for each pixel in each image, and these values were applied to Equation 1 to obtain an estimate of the signal decorrelation component due to electronic noise alone. The noise-based decorrelation image was then subtracted from the original decorrelation image to generate an estimate of signal decorrelation arising from motion (Fig. 2c).
Motion-induced decorrelation images were remapped using a Gaussian-shaped remapping filter centered at the expected decorrelation range exhibited by microbubbles. The Gaussian mapping function parameters for standard deviation and mean were applied uniformly for all data sets and set by optimizing specificity to microbubble signal using all frames of ADW-PI image data collected from each mouse in the study. For each mouse in the study, the ADW-PI image was reconstructed using 15 decorrelation images that were spatially median filtered and then compounded. The resulting compounded decorrelation image was multiplied by the original PI image to form the final ADW-PI image.
When displaying ADW-PI images, a parameter α was used to set the intensity of decorrelation values lower than those encompassed by the Gaussian-shaped remapping filter. These low-decorrelation signals were assumed to be static tissue. High values of alpha allowed for more tissue signal to be displayed in ADW-PI images, while lower values of alpha caused tissue signal suppression.
3.5. Signal decorrelation analysis
Filtered signal decorrelation images for ARF and no-ARF trials were generated and rectangular regions of interest (ROIs) corresponding to microbubble-bound tumor tissue or normal static tissue were selected (Fig 3). For each tumor, microbubble ROIs were approximately 5×5 mm in size, while tissue ROIs were approximately 3×3 mm in size. These ROIs, as well as transducer position, were held stationary between control and ARF sequences for each tumor. For tissue ROIs, the most apparent static tissue signal visible in the PI image was chosen for analysis via the ROI placement. For microbubble ROIs, regions of interest that did not overlap with visible static tissue were chosen. Average signal decorrelation between each image pair was calculated within the ROIs, and decorrelation measurements were averaged across approximately 30 frames (i.e. approximately 2 s) for a single mouse trial. Signal decorrelation was calculated in this way for both control and ARF sequences, and averaged across all mice (n = 9).
Figure 3.
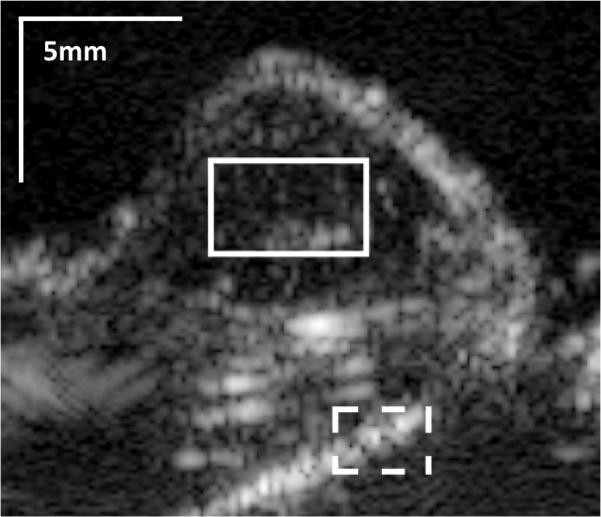
Representative pulse inversion (PI) image of a mouse tumor. The solid line box shows a region of interest in the tumor interior, where bound microbubbles are visible. The dotted line delineates a region of interest where strongly reflecting tissue signal is clearly visible.
3.6 Statistical methods
Signal decorrelation was compared between tissue and microbubble regions of interest using a two-tailed t-test for both ARF and no-ARF trials. The difference between signal decorrelation measured in ARF and no-ARF trials was assessed using a one-tailed t-test. Microbubble CTR was compared between B-mode, PI, CPS, and ADW-PI images using a two-tailed t-test. Contrast between pre-injection and post-injection tumor images was measured using a one-tailed t-test.
4. Results
4.1. Decorrelation of microbubbles in response to ARF
Across 9 mice, the mean decorrelation within microbubble ROIs for PI image pairs was 0.028 when ARF was not applied, and 0.043 when ARF was applied. The increased signal decorrelation within microbubble-bound regions allowed for significant differentiation between ARF-insonated microbubble signal and static tissue signal (p < 0.001). Furthermore, a one-sided t-test performed on the difference between the microbubble signal decorrelations of ARF and no-ARF trials showed that the measured microbubble signal decorrelation for ARF trials was significantly higher than that of no-ARF trials (p < 0.01). Our control measurements of tissue signal decorrelation in both ARF and no-ARF trials also showed that ARF does not increase decorrelation uniformly throughout the entire image. No statistically significant difference in tissue signal decorrelation was found between ARF and no-ARF conditions. (Fig. 4).
Figure 4.

Plot of PI decorrelation data. Both no-ARF and ARF trials show significant difference between tissue and microbubble signal decorrelation. (** p<0.005; ***p<0.0001; n = 9). The application of ARF was shown to significantly increase microbubble signal decorrelation from no-ARF conditions (*p<0.01).
4.2. ADW-PI improvements in contrast-to-tissue ratio
Employing ADW-PI resulted in significantly improved CTR when compared to B-mode, PI, or CPS imaging alone. ARF-based decorrelation weighting allowed for effective suppression of echogenic tissue interfaces from nearby bone structures visible in B-mode, PI, and CPS images of the same tumor (Fig 5). The contrast-to-tissue ratio of ADW-PI was increased by almost 2 dB when compared to corresponding CPS images, and at least 3 dB when compared to corresponding B-mode and PI images (Fig. 6). The decorrelation-based filter was adjusted to different levels of the parameter α to allow for complete cancellation of static tissue signal, or limited visualization of surrounding tissue structures (Fig 7). Measurements of contrast between post-injection and pre-injection intra-tumor ROIs showed an average signal enhancement of 17.6 dB (p<0.05) after injection of microbubbles.
Figure 5.

Demonstration of the ability of ADW-PI to isolate and enhance microbubble signal based on signal decorrelation. Each image is displayed at a 50 dB dynamic range. (a) B-mode. No microbubbles are visible within the tumor interior. (b) PI. Microbubble contrast is improved over B-mode, but PI imaging fails to cancel out echogenic tissue signal, such as the bright signal visible at the femur and skin line (arrows). (c) CPS. Microbubbles are clearly visible, but signal from the mouse femur remains prominent (arrow). (d) ADW-PI (α=0). This imaging mode shows the suppression of bright tissue signal and preservation of signal from bound microbubbles. (e)-(f) ADW-PI imaging (α=0.75) in a post-injection and pre-injection tumor data set, respectively.
Figure 6.

Comparison of measured CTR between CPS-mode images acquired on a Siemens Sequoia clinical scanner and B-mode, PI, and ADW-PI images on a Verasonics Vantage programmable scanner. For imaging, the same regions of interest used for decorrelation calculations were used to measure contrast-to-tissue ratio. These values were averaged across all frames in each mouse (n = 9). For CPS images, one frame from each mouse tumor was used to measure CTR (n = 9). Measured ADW-PI CTR was found to be significantly higher than all other imaging modalities (* = p <0.001).
Figure 7.

Visualization of the image filtering method employed, at various levels of the alpha parameter, α. (a) PI data for a microbubble-bound tumor before any filtering was applied. (b-d) ADW-PI images after a simple Gaussian filter was applied to the signal decorrelation, centered at the measured decorrelation of microbubble signal. The value of α determined the level at which the signal components exhibiting low-decorrelation, corresponding to static tissue, were displayed. When alpha was set to zero, the microbubbles were isolated from all other anatomical features.
5. Discussion
Current microbubble imaging techniques such as pulse inversion and contrast pulse sequences use amplitude or phase modulation to cancel tissue signal. These methods are effective in preserving nonlinear reflections from microbubbles, but they can fail to completely eliminate nonlinear reflections from strong tissue interfaces. The false positive signals arising from these interfaces can make accurate diagnosis more difficult and require more time and skill on the part of clinicians to properly interpret contrast-enhanced ultrasound images. Studies in the past which employ ultrasound molecular imaging for cancer diagnosis have addressed this problem through manual segmentation of the tumor interior40,43,45. However, manual segmentation requires time and prior knowledge of the general location, orientation, and environment of a potential tumor, which can vary based on the specific patient and the disease being diagnosed. All of these factors make it more difficult for contrast-enhanced targeted molecular imaging to be readily adopted in a diagnostic clinical setting. Previous studies have shown how improvements in microbubble CTR are necessary to significantly improve diagnostic accuracy in the clinic46,47.
The results presented in this study showed that inter-frame signal decorrelation can serve as an additional form of microbubble signal differentiation. Microbubble signal within the tumor exhibited significantly higher inter-frame signal decorrelation than static tissue, with and without the application of ARF (p<0.005). It was also found that the application of ARF significantly increased the signal decorrelation of microbubbles (p<0.01), without causing significant changes in tissue signal decorrelation. Finally, this study showed that the proposed ADW-PI image processing technique improved microbubble contrast-to-tissue ratio when compared to PI alone or CPS. Comparison of post microbubble injection ADW-PI signal to pre microbubble injection control further demonstrated that ADW-PI isolated the microbubble signal rather than the tumor tissue (17.6 dB average contrast improvement; p<0.05).
There are several sources of microbubble movement that were possible contributors to the microbubble signal decorrelation observed in this study. First, secondary radiation forces may have resulted in lateral and out-of-beam motion of microbubbles as they deformed or detached from the vessel wall in response to applied ARF. Kokhuis and colleagues found that secondary radiation forces can manifest as attraction between individual targeted microbubbles in vitro, and cause rapid deformation of microbubbles into a prolate shape48. These deformations in the microbubble shell could have manifested as axial motion, which results in a detectable phase shift and resulting signal decorrelation. It has also been found that as ARF insonation pressure increases, secondary radiation force can overcome molecular binding forces, and allow bound microbubbles to dislodge or cluster48–50. Loughran and colleagues determined that the peak negative pressure necessary for secondary radiation forces to overcome the molecular binding forces of adherent microbubbles was approximately 150 kPa49. In the imaging sequence employed in this study, PI, B-mode, and ARF transmissions had peak negative pressures of 286 kPa, 115 kPa, and 255 kPa, respectively without accounting for attenuation. As a result, it is possible that some portion of microbubbles detached from the vessel wall even in the absence of ARF pulses. The addition of ARF pulses in the imaging sequence likely resulted in a higher percentage of bound microbubbles that dislodged over time, and the resulting increase in out-of-beam motion may account for the higher signal decorrelation observed in ARF vs. no-ARF trials (Fig. 4).
The dynamics of blood flow in the tumor microvasculature may be another source of bound microbubble movement and signal decorrelation. Previous studies performed by Wang and colleagues have shown that shear forces from flow are a primary cause of microbubble signal decorrelation in large blood vessels, as continuous microbubble aggregation and dislodgement creates out-of-beam motion20. This motion leads to significant increases in the adherent microbubble normalized single spectrum area (NSSA) values, which has been shown to be monotonic with signal decorrelation20. Shear forces are more difficult to characterize in the microvasculature of a tumor, where blood flow is non-Newtonian with lower velocity51. However, the combination of shear and collision forces from red blood cells in the tumor are likely to induce out-of-beam detachment of targeted microbubbles, similar to what has been observed in large vessels. Owen and colleagues performed in vitro studies of targeted microbubbles in small vessels (using cellulose tubes 200 μm in diameter), which showed how targeted microbubbles may be perturbed and dislodged, or fail to bind with endothelial cells in the first place, due to collision with circulating erythrocytes51. This out-of-beam motion resulting from tumor-bound microbubble collision and dislodgement could possibly lead to an increase in local signal decorrelation, as dislodged microbubbles circulate and contribute to free microbubble signal.
Based on previous studies which have shown high specificity of VEGFR2-targeted microbubbles to the tumor endothelium, it is assumed that the microbubble signal detected during imaging experiments were derived from specific binding33,34,52,53. Previous studies employing mouse tumor models have shown no significant difference between nonspecific uptake in tumor tissue versus normal tissue37,54. Within our own lab, previous studies of targeted microbubbles in vitro have provided optical verification that non-specific binding from applied ARF is minimal55. The concentration of targeted biomarkers in a tumor is correlated with the amount of adherent microbubbles present in the image38, and signal enhancement is monotonic with microbubble concentration56.
It is important to observe that all measurements of signal decorrelation were acquired using IQ data, which contains both real and complex components of the received signal. When complex echo data was ignored and only the absolute signal intensity was used to calculate inter-frame signal decorrelation, no statistically significant difference was found between ARF-insonated microbubbles and no-ARF microbubbles. These results indicate that phase information, acquired from the complex component of echo data, is important in revealing an ARF-based enhancement in microbubble signal decorrelation. Since changes in signal phase are correlated with axial motion of microbubbles, assessed through the “slow-time”, frame-to-frame dimension, it is possible that the enhancement of decorrelation in ARF-insonated trials is due to axial movement of adherent microbubbles.
The importance of using complex echo data to detect enhanced signal decorrelation from ARF agrees with previous literature showing that singular value filtering methods have superior performance when complex echo data is used57. Previous studies by the authors of this paper determined that in the case of singular value filtering, axial movement of acoustic targets can lead to signal basis functions with highly overlapping frequencies. This frequency overlap leads to periodicity in real echo data while complex echo data is not affected57. This discrepancy between real and complex echo data could relate to the decorrelation-based filtering method proposed in this paper, as singular values from complex data are monotonic with signal decorrelation.
Fully-processed images from a Sequoia scanner in CPS contrast mode were used to compare the contrast-to-tissue ratio between CPS and ADW-PI. CPS data was displayed on a 0-50 dB dynamic range, and calculations of CPS CTR assumed linear gamma mapping in grayscale. However, it is likely that non-linear steps were used to form the final CPS image. While the assumption of image linearity may have led to minor inaccuracy in CTR measurements, calculations of CTR were still viable for an approximate comparison between two contrast imaging modes.
In this study, it was demonstrated that long duration acoustic radiation force (ARF) pulses can be used to generate a signal decorrelation signature that is highly specific to microbubbles. As a result, a new imaging approach that combines the decorrelation information with PI, called ADW-PI, was developed and the specificity of this approach was compared to PI alone and CPS. It was determined that the application of acoustic radiation force can significantly increase microbubble inter-frame signal decorrelation in vivo. It was also determined that in conditions both with and without ARF, microbubble signal decorrelation is significantly higher than that of static tissue. The improved robustness from ADW-PI or similar decorrelation-based methods with regards to signal specificity may serve to improve clinical adoption of targeted microbubbles by reducing false positive detection.
Acknowledgments
Disclosure of Funding: NIH R01 HL111077, and Center for Innovative Technology (CIT) Commonwealth Research Commercialization Fund Award MF14F-002-LS.
Contributor Information
Elizabeth Herbst, Department of Biomedical Engineering, University of Virginia, Charlottesville, VA 22908, USA
Sunil Unnikrishnan, Department of Biomedical Engineering, University of Virginia, Charlottesville, VA 22908, USA
Shiying Wang, Department of Biomedical Engineering, University of Virginia, Charlottesville, VA 22908, USA
Alexander L. Klibanov, Division of Cardiovascular Medicine and Department of Biomedical Engineering, University of Virginia, Charlottesville, VA 22908, USA.
John A. Hossack, Department of Biomedical Engineering and Electrical and Computer Engineering, University of Virginia, Charlottesville, VA 22908, USA.
F. William Mauldin, Jr, Department of Biomedical Engineering, University of Virginia, Charlottesville, VA 22908, USA.
Bibliography
- 1.Bernier M, Abdelmoneim SS, Stuart Moir W, et al. CUTE-CV: a prospective study of enhanced left atrial appendage visualization with microbubble contrast agent use during transesophageal echocardiography guided cardioversion. Echocardiography. 2013;30(9):1091–7. doi: 10.1111/echo.12240. [DOI] [PubMed] [Google Scholar]
- 2.Caskey CF, Hu X, Ferrara KW. Leveraging the power of ultrasound for therapeutic design and optimization. J. Control. Release. 2011;156(3):297–306. doi: 10.1016/j.jconrel.2011.07.032. [DOI] [PMC free article] [PubMed] [Google Scholar]
- 3.Qin S, Caskey CF, Ferrara KW. Ultrasound contrast microbubbles in imaging and therapy: physical principles and engineering. Phys. Med. Biol. 2009;54(6):R27. doi: 10.1088/0031-9155/54/6/R01. [DOI] [PMC free article] [PubMed] [Google Scholar]
- 4.Deshpande N, Needles A, Willmann JK. Molecular ultrasound imaging: current status and future directions. Clin. Radiol. 2010;65(7):567–581. doi: 10.1016/j.crad.2010.02.013. [DOI] [PMC free article] [PubMed] [Google Scholar]
- 5.Chahal NS, Senior R. Clinical Applications of Left Ventricular Opacification. JACC Cardiovasc. Imaging. 2010;3(2):188–196. doi: 10.1016/j.jcmg.2009.09.022. Available at: http://dx.doi.org/10.1016/j.jcmg.2009.09.022. [DOI] [PubMed] [Google Scholar]
- 6.Khong PL, Chau MT, Fan ST, et al. Ultrasound contrast agent Levovist in colour Doppler sonography of hepatocellular carcinoma in Chinese patients. Australas Radiol. 1999;43(2):156–159. doi: 10.1046/j.1440-1673.1999.00627.x. Available at: http://www.ncbi.nlm.nih.gov/entrez/query.fcgi?cmd=Retrieve&db=PubMed&dopt=Citation&list_uids=10901894. [DOI] [PubMed] [Google Scholar]
- 7.Plew J, Sanki J, Young N, et al. Early experience in the use of Levovist ultrasound contrast in the evaluation of liver masses. Australas Radiol. 2000;44(1):28–31. doi: 10.1046/j.1440-1673.2000.00771.x. Available at: http://www.ncbi.nlm.nih.gov/entrez/query.fcgi?cmd=Retrieve&db=PubMed&dopt=Citation&list_uids=10761256. [DOI] [PubMed] [Google Scholar]
- 8.Solbiati L, Ierace T, Tonolini M, et al. Guidance and monitoring of radiofrequency liver tumor ablation with contrast-enhanced ultrasound. Eur. J. Radiol. 2004;51(SUPPL.) doi: 10.1016/j.ejrad.2004.03.035. [DOI] [PubMed] [Google Scholar]
- 9.Quaia E, Calliada F, Bertolotto M, et al. Characterization of focal liver lesions with contrast-specific US modes and a sulfur hexafluoride-filled microbubble contrast agent: diagnostic performance and confidence. Radiology. 2004;232:420–430. doi: 10.1148/radiol.2322031401. [DOI] [PubMed] [Google Scholar]
- 10.D'Onofrio M, Crosara S, De Robertis R, et al. Contrast-Enhanced Ultrasound of Focal Liver Lesions. AJR. Am. J. Roentgenol. 2015;205(1):W56–66. doi: 10.2214/AJR.14.14203. Available at: http://www.ncbi.nlm.nih.gov/pubmed/26102419. [DOI] [PubMed] [Google Scholar]
- 11.Bachawal SV, Jensen KC, Lutz AM, et al. Earlier detection of breast cancer with ultrasound molecular imaging in a transgenic mouse model. Cancer Res. 2013;73(6):1689–1698. doi: 10.1158/0008-5472.CAN-12-3391. [DOI] [PMC free article] [PubMed] [Google Scholar]
- 12.Xuan JW, Bygrave M, Valiyeva F, et al. Molecular targeted enhanced ultrasound imaging of flk1 reveals diagnosis and prognosis potential in a genetically engineered mouse prostate cancer model. Mol. Imaging. 2009;8(4):209–20. [PubMed] [Google Scholar]
- 13.Sano F, Uemura H. The utility and limitations of contrast-enhanced ultrasound for the diagnosis and treatment of crostate cancer. Sensors. 2015;15(3):4947–4957. doi: 10.3390/s150304947. [DOI] [PMC free article] [PubMed] [Google Scholar]
- 14.Pochon S, Tardy I, Bussat P, et al. BR55: a lipopeptide-based VEGFR2-targeted ultrasound contrast agent for molecular imaging of angiogenesis. Invest. Radiol. 2010;45(2):89–95. doi: 10.1097/RLI.0b013e3181c5927c. [DOI] [PubMed] [Google Scholar]
- 15.Bzyl J, Lederle W, Rix A, et al. Molecular and functional ultrasound imaging in differently aggressive breast cancer xenografts using two novel ultrasound contrast agents (BR55 and BR38). Eur. Radiol. 2011;21(9):1988–1995. doi: 10.1007/s00330-011-2138-y. [DOI] [PubMed] [Google Scholar]
- 16.Pysz MA, Foygel K, Rosenberg J, et al. Antiangiogenic cancer therapy: monitoring with molecular US and a clinically translatable contrast agent (BR55). Radiology. 2010;256(2):519–527. doi: 10.1148/radiol.10091858. [DOI] [PMC free article] [PubMed] [Google Scholar]
- 17.Phillips PJ. Contrast pulse sequences (CPS): imaging nonlinear microbubbles. IEEE Int. Ultrason. Symp. 2001:1739–1745. [Google Scholar]
- 18.Samakee C, Phukpattaranont P. Performance analysis of linear bandpass filter and pulse inversion in separating subharmonic frequency of signals from ultrasound contrast agent. Songklanakarin J. Sci. Technol. 2012;34(6):629–636. [Google Scholar]
- 19.Averkiou MA, Roundhill DN, Powers JE. A new imaging technique based on the nonlinear properties of tissues. IEEE Ultrason. Symp. 1997;2:1561–1566. [Google Scholar]
- 20.Wang S, Mauldin FW, Jr, Klibanov AL, et al. Shear forces from flow are responsible for a distinct statistical signature of adherent microbubbles in large vessels. Mol. Imaging. 2013;12(0):1–13. [PMC free article] [PubMed] [Google Scholar]
- 21.Desser TS, Jeffrey RB. Tissue harmonic imaging techniques: physical principles and clinical applications. Semin. Ultrasound. CT. MR. 2001;22(1):1–10. doi: 10.1016/s0887-2171(01)90014-9. [DOI] [PubMed] [Google Scholar]
- 22.Couture O, Bannouf S, Montaldo G, et al. Ultrafast imaging of ultrasound contrast agents. Ultrasound Med. Biol. 2009;35(11):1908–1916. doi: 10.1016/j.ultrasmedbio.2009.05.020. [DOI] [PubMed] [Google Scholar]
- 23.Mauldin FW, Jr, Lin D, Hossack JA. The singular value filter: a general filter design strategy for PCA-based signal separation in medical ultrasound imaging. IEEE Trans. Med. Imaging. 2011;30(11):1951–1964. doi: 10.1109/TMI.2011.2160075. [DOI] [PMC free article] [PubMed] [Google Scholar]
- 24.Wang S, Mauldin FW, Jr, Hossack JA. Decorrelation-based adherent microbubble identification as a faster alternative to singular spectrum-based targeted molecular (SiSTM) imaging of large blood vessels. IEEE Int. Ultrason. Symp. 2013:1829–1832. [Google Scholar]
- 25.Patil AV, Rychak JJ, Klibanov AL, et al. Real-time technique for improving molecular imaging and guiding drug delivery in large blood vessels: in vitro and ex vivo results. Mol. Imaging. 2011;10(4):238–247. doi: 10.2310/7290.2011.00002. [DOI] [PMC free article] [PubMed] [Google Scholar]
- 26.Mauldin FW, Dhanaliwala AH, Patil AV, et al. Real-time targeted molecular imaging using singular value spectra properties to isolate the adherent microbubble signal. Phys. Med. Biol. 2012;57(16):5275–5293. doi: 10.1088/0031-9155/57/16/5275. [DOI] [PMC free article] [PubMed] [Google Scholar]
- 27.Zhao S, Kruse DE, Ferrara KW, et al. Selective imaging of adherent targeted ultrasound contrast agents. Phys. Med. Biol. 2007;52(8):2055–2072. doi: 10.1088/0031-9155/52/8/002. [DOI] [PMC free article] [PubMed] [Google Scholar]
- 28.Zhao S, Borden M, Bloch SH, et al. Radiation-force assisted targeting facilitates ultrasonic molecular imaging. Mol. Imaging. 2004;3(3):135–148. doi: 10.1162/1535350042380317. [DOI] [PMC free article] [PubMed] [Google Scholar]
- 29.Rychak JJ, Klibanov AL, Ley KF, et al. Enhanced targeting of ultrasound contrast agents using acoustic radiation force. Ultrasound Med. Biol. 2007;33(7):1132–1139. doi: 10.1016/j.ultrasmedbio.2007.01.005. [DOI] [PubMed] [Google Scholar]
- 30.Dayton P, Klibanov A, Brandenburger G, et al. Acoustic radiation force in vivo: a mechanism to assist targeting of microbubbles. Ultrasound Med. Biol. 1999;25(8):1195–1201. doi: 10.1016/s0301-5629(99)00062-9. [DOI] [PubMed] [Google Scholar]
- 31.Lum AFH, Borden MA, Dayton PA, et al. Ultrasound radiation force enables targeted deposition of model drug carriers loaded on microbubbles. J. Control. Release. 2006;111(1-2):128–134. doi: 10.1016/j.jconrel.2005.11.006. [DOI] [PMC free article] [PubMed] [Google Scholar]
- 32.Klibanov AL, Rychak JJ, Yang WC, et al. Targeted ultrasound contrast agent for molecular imaging of inflammation in high-shear flow. Contrast Media Mol. Imaging. 2006;1(6):259–266. doi: 10.1002/cmmi.113. [DOI] [PubMed] [Google Scholar]
- 33.Willmann JK, Paulmurugan R, Chen K, et al. US imaging of tumor angiogenesis with microbubbles targeted to vascular endothelial growth factor receptor type 2 in mice. Radiology. 2008;246(2):508–518. doi: 10.1148/radiol.2462070536. [DOI] [PMC free article] [PubMed] [Google Scholar]
- 34.Lee DJ, Lyshchik A, Huamani J. Relationship between retention of a vascular endothelial growth factor receptor 2 (VEGFR2)-targeted ultrasonographic contrast agent and the level of VEGFR2 expression in an in vivo breast cancer model. J. Ultrasound Med. 2008;2:855–866. doi: 10.7863/jum.2008.27.6.855. [DOI] [PubMed] [Google Scholar]
- 35.Willmann JK, Cheng Z, Davis C, et al. Targeted microbubbles for imaging tumor angiogenesis: assessment of whole-body biodistribution with dynamic micro-PET in mice. Radiology. 2008;249(1):212–219. doi: 10.1148/radiol.2491072050. Available at: http://eutils.ncbi.nlm.nih.gov/entrez/eutils/elink.fcgi?dbfrom=pubmed&id=18695212&retmode=ref&cmd=prlinks\npapers2://publication/doi/10.1148/radiol.2491072050. [DOI] [PMC free article] [PubMed] [Google Scholar]
- 36.Lindner JR, Song J, Christiansen J, et al. Ultrasound assessment of inflammation and renal tissue injury with microbubbles targeted to P-selectin. Circulation. 2001;104(17):2107–2112. doi: 10.1161/hc4201.097061. [DOI] [PubMed] [Google Scholar]
- 37.Ellegala DB, Leong-Poi H, Carpenter JE, et al. Imaging tumor angiogenesis with contrast ultrasound and microbubbles targeted to alpha(v)beta3. Circulation. 2003;108(3):336–341. doi: 10.1161/01.CIR.0000080326.15367.0C. [DOI] [PubMed] [Google Scholar]
- 38.Deshpande N, Ren Y, Foygel K, et al. Tumor angiogenic marker expression levels during tumor growth: longitudinal assessment with molecularly targeted microbubbles and US imaging. Radiology. 2011;258(3):804–811. doi: 10.1148/radiol.10101079. [DOI] [PMC free article] [PubMed] [Google Scholar]
- 39.Anderson CR, Hu X, Zhang H, et al. Ultrasound molecular imaging of tumor angiogenesis with an integrin targeted microbubble contrast agent. Invest. Radiol. 2011;46(4):215–224. doi: 10.1097/RLI.0b013e3182034fed. [DOI] [PMC free article] [PubMed] [Google Scholar]
- 40.Fokong S, Fragoso A, Rix A, et al. Ultrasound molecular imaging of E-selectin in tumor vessels using poly n-butyl cyanoacrylate microbubbles covalently coupled to a short targeting peptide. Invest. Radiol. 2013;48(12):843–50. doi: 10.1097/RLI.0b013e31829d03ec. Available at: http://www.ncbi.nlm.nih.gov/pubmed/23857137. [DOI] [PubMed] [Google Scholar]
- 41.Frazier CH, O'Brien WD. Synthetic aperture techniques with a virtual source element. IEEE Trans. Ultrason. Ferroelectr. Freq. Control. 1998;45(1):196–207. doi: 10.1109/58.646925. [DOI] [PubMed] [Google Scholar]
- 42.Jensen JA, Nikolov SI, Gammelmark KL, et al. Synthetic aperture ultrasound imaging. Ultrasonics. 2006;44:e5–e15. doi: 10.1016/j.ultras.2006.07.017. Available at: http://linkinghub.elsevier.com/retrieve/pii/S0041624X06003374. [DOI] [PubMed] [Google Scholar]
- 43.Anderson CR, Rychak JJ, Backer M, et al. scVEGF microbubble ultrasound contrast agents: a novel probe for ultrasound molecular imaging of tumor angiogenesis. Invest. Radiol. 2010;45(10):579–85. doi: 10.1097/RLI.0b013e3181efd581. Available at: http://www.pubmedcentral.nih.gov/articlerender.fcgi?artid=3426362&tool=pmcentrez&rendertype=abstract. [DOI] [PMC free article] [PubMed] [Google Scholar]
- 44.Walker WF. Mun SK, Antonuk LE, Chen C-T, et al., editors. The significance of correlation in ultrasound signal processing. Proc. SPIE 4325, Medical Imaging 2001: Ultrasonic Imaging and Signal Processing. 2001:159–171. [Google Scholar]
- 45.Pysz MA, Guracar I, Tian L, et al. Fast microbubble dwell-time based ultrasonic molecular imaging approach for quantification and monitoring of angiogenesis in cancer. Quant. Imaging Med. Surg. 2012;2(2):68–80. doi: 10.3978/j.issn.2223-4292.2012.06.05. [DOI] [PMC free article] [PubMed] [Google Scholar]
- 46.Burns PN, Wilson SR, Simpson DH. Pulse inversion imaging of liver blood flow: improved method for characterizing focal masses with microbubble contrast. Invest. Radiol. 2000 Jan;:35, 58–71. doi: 10.1097/00004424-200001000-00007. 2000. [DOI] [PubMed] [Google Scholar]
- 47.Dalla Palma L, Bertolotto M, Quaia E, et al. Detection of liver metastases with pulse inversion harmonic imaging: preliminary results. Eur Radiol. 1999;9(Suppl 3):S382–7. doi: 10.1007/pl00014079. [DOI] [PubMed] [Google Scholar]
- 48.Kokhuis TJ, Garbin V, Kooiman K, et al. Secondary bjerknes forces deform targeted microbubbles. Ultrasound Med. Biol. 2013;39(3):490–506. doi: 10.1016/j.ultrasmedbio.2012.09.025. [DOI] [PubMed] [Google Scholar]
- 49.Loughran J, Sennoga C, J Eckersley R, et al. Effect of ultrasound on adherent microbubble contrast agents. Phys. Med. Biol. 2012;57(21):6999–7014. doi: 10.1088/0031-9155/57/21/6999. [DOI] [PubMed] [Google Scholar]
- 50.Wang S, Unnikrishnan S, Herbst EB, et al. Ultrasound molecular imaging with modulated acoustic radiation force-based beam sequence in mouse abdominal aorta : a feasibility study. IEEE Int. Ultrason. Symp. 2015 [Google Scholar]
- 51.Owen J, Grove P, Rademeyer P, et al. The influence of blood on targeted microbubbles. J. R. Soc. Interface. 2014;11(100):20140622. doi: 10.1098/rsif.2014.0622. Available at: http://www.pubmedcentral.nih.gov/articlerender.fcgi?artid=4191088&tool=pmcentrez&rendertype=abstract. [DOI] [PMC free article] [PubMed] [Google Scholar]
- 52.Tardy I, Pochon S, Theraulaz M, et al. Ultrasound molecular imaging of VEGFR2 in a rat prostate tumor model using BR55. Invest. Radiol. 2010;45(10):573–578. doi: 10.1097/RLI.0b013e3181ee8b83. [DOI] [PubMed] [Google Scholar]
- 53.Wang S, Herbst EB, Mauldin FW, et al. Ultra-low-dose ultrasound molecular imaging for the detection of angiogenesis in a mouse murine tumor model: How little can we see? Invest. Radiol. 2016 doi: 10.1097/RLI.0000000000000310. [DOI] [PMC free article] [PubMed] [Google Scholar]
- 54.Weller GER, Wong MKK, Modzelewski RA, et al. Ultrasonic imaging of tumor angiogenesis using contrast microbubbles targeted via the tumor-binding peptide arginine-arginine-leucine. Cancer Res. 2005;65(2):533–539. [PubMed] [Google Scholar]
- 55.Wang S, Wang CY, Unnikrishnan S, et al. Optical verification of microbubble response to acoustic radiation force in large vessels with in vivo results. Invest. Radiol. 2015;50(11):772–784. doi: 10.1097/RLI.0000000000000185. [DOI] [PMC free article] [PubMed] [Google Scholar]
- 56.Lampaskis M, Averkiou M. Investigation of the Relationship of Nonlinear Backscattered Ultrasound Intensity with Microbubble Concentration at Low MI. Ultrasound Med. Biol. 2010;36(2):306–312. doi: 10.1016/j.ultrasmedbio.2009.09.011. [DOI] [PubMed] [Google Scholar]
- 57.Mauldin FW, Lin D, Hossack JA. The Singular Value Filter: A General Filter Design Strategy for PCA-Based Signal Separation in Medical Ultrasound Imaging. [April 20, 2015];IEEE Trans. Med. Imaging. 2011 30(11):1951–1964. doi: 10.1109/TMI.2011.2160075. Available at: http://www.ncbi.nlm.nih.gov/pmc/articles/PMC3351208/. [DOI] [PMC free article] [PubMed] [Google Scholar]