Abstract
Background
In head and neck cancer little is known about the kinetics of osteopontin (OPN) expression after tumor resection. In this study we evaluated the time course of OPN plasma levels before and after surgery.
Methods
Between 2011 and 2013 41 consecutive head and neck cancer patients were enrolled in a prospective study (group A). At different time points plasma samples were collected: T0) before, T1) 1 day, T2) 1 week and T3) 4 weeks after surgery. Osteopontin and TGFβ1 plasma concentrations were measured with a commercial ELISA system. Data were compared to 131 head and neck cancer patients treated with primary (n = 42) or postoperative radiotherapy (n = 89; group B1 and B2).
Results
A significant OPN increase was seen as early as 1 day after surgery (T0 to T1, p < 0.01). OPN levels decreased to base line 3-4 weeks after surgery. OPN values were correlated with postoperative TGFβ1 expression suggesting a relation to wound healing. Survival analysis showed a significant benefit for patients with lower OPN levels both in the primary and postoperative radiotherapy group (B1: 33 vs 11.5 months, p = 0.017, B2: median not reached vs 33.4, p = 0.031). TGFβ1 was also of prognostic significance in group B1 (33.0 vs 10.7 months, p = 0.003).
Conclusions
Patients with head and neck cancer showed an increase in osteopontin plasma levels directly after surgery. Four weeks later OPN concentration decreased to pre-surgery levels. This long lasting increase was presumably associated to wound healing. Both pretherapeutic osteopontin and TGFβ1 had prognostic impact.
Keywords: Perioperative changes, Osteopontin, TGFβ1, Head and neck cancer, Survival
Background
Head and neck cancer is one of the leading causes of cancer-related death with almost 60.000 new cases and 12.000 deaths per year in the US [1]. Standard treatment consists of primary surgery and adjuvant radiotherapy in locally advanced tumors. Concomitant chemo-radiotherapy is an alternative to surgery as a definitive treatment option [2]. Despite combined multimodality treatment survival rates at 5 years are still about 20–50% for stage III/IV tumors [3–5]. Modern treatment strategies try to elucidate specific molecular patterns and address these with novel therapeutics like EGFR directed antibodies or small molecules against growth factor receptors [6–8]. Identifying and targeting prognostic and predictive biomarkers is an attractive approach for the development of new treatment strategies.
One of these biomarkers is osteopontin (OPN). It is an actively secreted protein which can be detected in body fluids like blood or urine. Additionally it is overexpressed in many cancer types [9] and plays an important role in tumor progression [10]. Furthermore, it was shown that elevated plasma levels are associated with an unfavorable outcome in cancer [11–16]. High OPN levels are also correlated with tumor hypoxia which is a main resistance factor to radiation treatment [17, 18].
Originally we compared OPN plasma levels in patients with head and neck cancer treated with definitive or postoperative radiotherapy. Surprisingly, there was no difference between both groups at the start of radiation treatment (data published as abstract) [19]. Therefore the osteopontin time course after primary surgery was analyzed in an additional cohort of head and neck cancer patients and data on prognostic significance have been updated. Expression patterns of TGFβ1 were studied in parallel to address the possible correlation of OPN plasma levels immediately after surgery with wound healing (see Fig. 1).
Fig. 1.
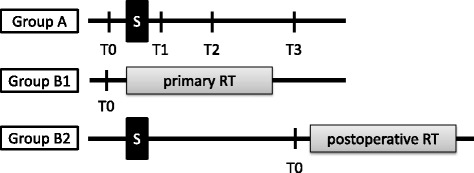
Scheme of the three patient groups treated by A) surgery, B1) definite radio-chemotherapy and B2) surgery followed by postoperative radiotherapy. Time points for blood samples are marked as T0 to T3 (T0, before surgery (group A) or before start of radiotherapy (group B1 and B2), T1, 1 day after surgery, T2, 1 week and T3, 3 to 4 weeks after surgery). S, surgery; RT, radiotherapy
Methods
Patients and samples
Patients with newly diagnosed squamous cell carcinoma of the head and neck (HNSCC) were consecutively enrolled in two prospective trials (A and B1, 2). In group A we included patients with locally confined tumors which were eligible for primary resection. After giving their written informed consent, blood samples were taken at different time points: T0) before surgery, T1) 1 day after surgery, T2) 1 week and T3) 3 to 4 weeks after surgery. Blood samples were immediately centrifuged and plasma was stored at -80 °C. Group B1 consisted of patients who were medically or technically not eligible for surgical interventions or who refused surgery. In group B2 we recruited patients who were treated by primary surgery and were referred to adjuvant treatment according to their final tumor stage. Clinico-pathological patient characteristics are summarized in Table 1. Patients in group A were treated with primary surgery. According to national guidelines these patients received adjuvant treatment when appropriate. No adjuvant treatment was started before time point T3. In group B plasma samples of patients were analyzed before and during radio-(chemo) therapy (definitive treatment n = 41 (B1), postoperative treatment n = 89 (B2)). Patients from group B were enrolled before the start of the second trial (group A). The study was approved by the local clinical ethics committee. For a better understanding of the trial a scheme is shown in Fig. 1.
Table 1.
Patient characteristics
| Group A: surgery | Group B1: primary RT | Group B2: postoperative RT | Controls | p-value | |
|---|---|---|---|---|---|
| Number | 41 | 42 | 89 | 16 | |
| Time frame | 08/11–09/13 | 07/07–06/09 | 09/07 | ||
| Follow-Up (median, months) | 24.6 | 17.3 | 49.3a | <0.01 | |
| Gender m/f | 34/7 | 37/5 | 70/19 | 8/8 | n.s. |
| Age (mean) | 62,3 | 61,0 | 59,9 | 41,6a | n.s. |
| T-stage | |||||
| 1 | 9 | 0 | 27 | < 0.01 | |
| 2 | 15 | 1 | 28 | ||
| 3 | 12 | 6 | 16 | ||
| 4 | 4 | 34 | 17 | ||
| N-stage | |||||
| 0 | 15 | 7 | 39 | < 0,01 | |
| 1 | 6 | 0 | 13 | ||
| 2 | 20 | 29 | 35 | ||
| 3 | 0 | 4 | 2 | ||
| UICC-stage | |||||
| I/II | 5 | 1 | 31 | < 0,01 | |
| III | 14 | 1 | 12 | ||
| IV | 22 | 40 | 46 | ||
| Tumor site | |||||
| Oropharynx | 17 | 18 | 28 | 0,004 | |
| Larynx | 10 | 11 | 18 | ||
| Hypopharynx | 7 | 7 | 4 | ||
| Oral cavity | 6 | 3 | 31 | ||
| CUP | 1 | 3 | 8 | ||
Abbreviations: UICC International union against cancer, CUP Cancer of unknown primary tumor. P-values according to student’s t-test and Fisher’s exact test
aAge was significantly lower in controls compared to patient groups
Blood samples
Blood was anticoagulated with EDTA and subsequently centrifuged (4000 rpm) at room temperature for 10 min. Plasma was removed, aliquoted and stored at -80 °C until use. For comparison of OPN we used archived plasma samples collected from group B which had been prepared in the same way. These samples were collected just before the start of radiotherapy (T0).
ELISA-OPN
Aliquots of each sample were analyzed in duplicate using the Human Osteopontin Assay Kit-IBL (Immuno-Biological Laboratories Co., Ltd., Japan) according to the manufacturer’s instructions.
ELISA TGFβ1
The same aliquots were analysed in duplicate using a commercially available kit (ELISA Pro Kit for Human Latent TGFβ1, Mabtech, Sweden) according to the manufacturer’s instructions. Absolute plasma concentrations for osteopontin and TGFβ1 are given in ng/ml.
Statistics
All statistical analyses were done with SPSS for Windows version 23.0 (IBM SPSS, Inc.). Statistical significance was set at p < 0.05. All reported p values were two-sided. For comparison of patient characteristics Fischer’s Exact test was used. Student’s t-test was used for comparison of plasma concentrations between groups. To test for correlations between plasma osteopontin and TGFβ1 we used Pearson product-moment correlation coefficient. Analysis of variance (ANOVA) was used for evaluation of OPN and TGFβ1 distribution among the different clinical parameters. For comparison of OPN and TGFβ1 values at different time points we employed a general linear model for repeated measures for each plasma marker. Kaplan-Meier analysis using log-rank statistics were used for comparing overall survival. As done in the DAHANCA 5 OPN sub-study [18] and TROG 02.02 study [20] groups were divided according to tertiles and median values of OPN and TGFβ1 concentrations.
Results
Patient characteristics
Table 1 describes the patient groups. Age and gender were comparable. Control patients were significantly younger. Patients from group B1 had more advanced tumor stages compared to group A and B2.
Correlation of osteopontin and TGFβ1 with clinico-pathologic parameters
There was no association of OPN and TGFβ1 with clinical tumor parameters (e.g., histology, TNM- or UICC stage; data not shown).
Osteopontin and TGFβ1 plasma levels
Mean (±SD) osteopontin plasma concentration (ng/ml) was higher in patient groups compared to healthy controls (group A: 630.8 ± 353.0 ng/ml, group B1: 811.5 ± 365.1 ng/ml, group B2: 734.7 ± 310.1 ng/ml, controls: 478.9 ± 155.0 ng/ml; p = 0.028, p = 0.008 and p = 0.04 for group A, B1 and B2 vs controls, respectively, Fig. 2a). TGFβ1 plasma levels differed significantly between group A (15.23 ± 11.6 ng/ml) and group B1 (25.5 ± 11.8 ng/ml), p = 0.002 and between group B1 and controls (18.2 ± 10.1 ng/ml), p = 0.046 (Fig. 2b).
Fig. 2.
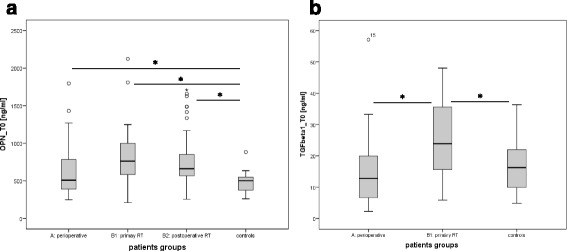
Box and whisker plots demonstrate the distribution plasma levels of a) OPN and b) TGFβ1 in the different patient groups and healthy controls at time point T0 before treatment. Bars indicate statistical significant differences with p < 0.05
Changes in osteopontin and TGFβ1 plasma concentrations over time after surgery
Mean osteopontin plasma concentrations (ng/ml) for the different time points T0 to T3 (mean ± SD) was 631 ± 353, 1363 ± 660, 936 ± 526 and 649 ± 374, p < 0.01 (Fig. 3a). The most prominent difference was seen directly after surgery between time points T0 and T1. Three to four weeks after surgery OPN concentration reached base line levels again (T0 and T3). Patients with higher OPN concentrations (> median) at the time of surgery showed also higher values 3–4 weeks postoperatively (Fig. 3c, p < 0.05).
Fig. 3.
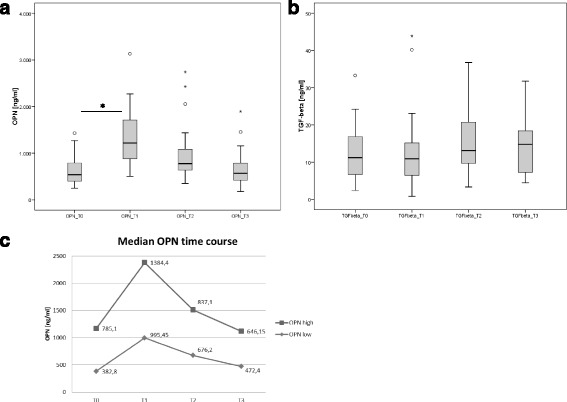
Time course of OPN plasma levels for group A with a) OPN and b) TGFβ1 (T0, before surgery, T1, 1 day after surgery, T2, 1 week and T3, 3 to 4 weeks after surgery). Bars indicate statistical significant differences with p < 0.05. c shows OPN time course for patients with OPN levels above or below median indicating that patients in both groups return to their pre-surgery status
No significant changes were observed in the time course of TGFβ1 concentrations (Fig. 3b) with the highest TGFβ1 values at time points T2 and T3 (as we would expect it in wound healing).
Correlation between osteopontin and TGFβ1
Pretherapeutic plasma concentrations of osteopontin and TGFβ1 values were analysed by the Pearson correlation coefficient test. We observed a significant positive correlation between both parameters, R = 0.619, p = 0.001 (Fig. 4).
Fig. 4.
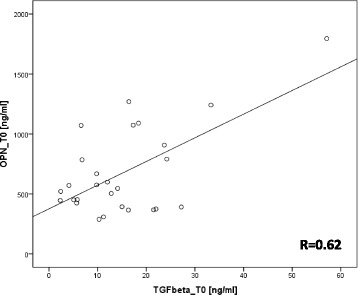
Positive correlation between TGFβ1 and OPN plasma levels at time point T0. Pearson correlation coefficient R = 0.619, p = 0.001
Survival
Both osteopontin and TGFβ1 at the start of treatment correlated with patient overall survival (Figs. 5a-d). Higher OPN values were associated with a shorter overall survival. Median survival times were 11.5 and 33.0 months, p = 0.017 in patients with definitive radiochemotherapy (group B1). Median survival was 33.4 months for patients with higher OPN values and was not reached for lower OPN values (p = 0.031) in patients treated with postoperative RT (group B2). In group A (patients with earlier tumor stage partly with no adjuvant treatment) survival was also worse for the high OPN group but the difference was not statistically significant (survival at 3 years was 76 and 95%, p = 0.13). Patients with TGFβ1 values in the upper tertile showed a worse outcome with median survival times of 10.7 and 33.0 months, p = 0.003 (group B1).
Fig. 5.
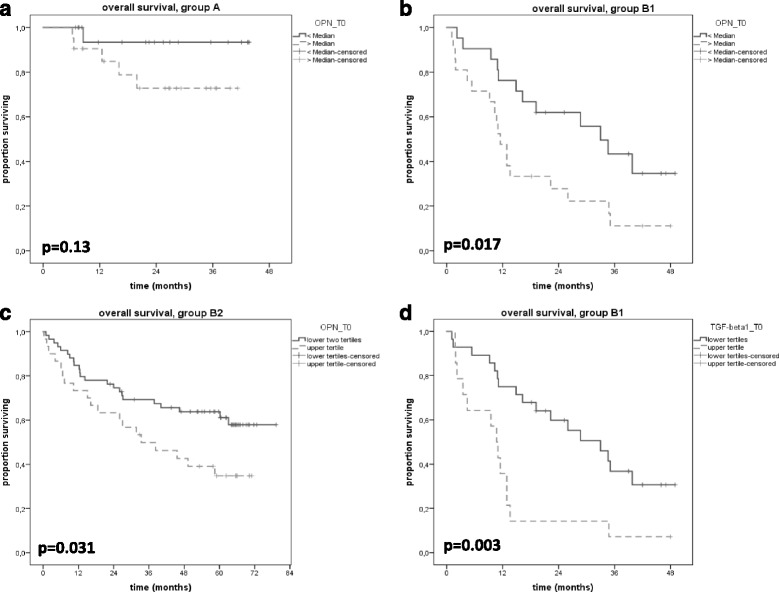
Kaplan-Meier curves show overall survival for patients in group a (perioperative, A), group B1 (primary radiotherapy, b) and group B2 (postoperative RT, c) according to OPN at time point T0. When dichotomized by median or tertiles, patients with lower OPN had an improved overall survival. For TGFβ1 a difference in survival was seen in patients from group B1, showing a better survival for patients in the lower two tertiles (d)
Discussion
To our knowledge this is the first study presenting short term osteopontin expression after surgery in head and neck cancer patients. Blasberg and coworkers reported on OPN time course after tumor resection in lung cancer patients [21]. They described a similar pattern with decreasing OPN plasma values in the longer follow-up but did not study OPN changes within the first days and weeks after surgery.
Our results suggest that both tumor mass (related microenvironment) and the postsurgical situation can result in significantly elevated OPN levels. Instead of an anticipated immediate postoperative decrease we observed a doubling of OPN within 1 day and a return to preoperative values 3 to 4 weeks thereafter. Values at this time point seemed to mirror the situation before surgery. Adjuvant radiotherapy typically starts 4 weeks after surgery. Under the assumption that OPN is prognostic for malignant behavior and influences radiation response [22], this may explain that OPN before radiotherapy was prognostic both in primary and postoperative treatments.
OPN and TGFβ1 in wound healing
We propose the hypothesis that the transitory rise in OPN plasma levels in the postoperative setting is associated with wound healing and not caused by OPN secretion or expression from cancer cells since its increase was seen within 24 h. It is well known that OPN is not a tumor specific protein and can also originate from immune cells like macrophages or from endothelial cells [23, 24]. In wound healing there is a wide range of cells and cytokines which are differentially expressed [25]. Therefore we chose TGFβ1 as a representative marker and looked for changes in its expression patterns. We observed an increase of its plasma concentration peaking at 1 week after surgery which is in line with data from the literature [26, 27]. Changes of OPN and TGFβ1 levels were correlated (R = 0.62). From preclinical studies there is good evidence for an OPN mediated TGFβ1 expression [28–30]. This is in agreement with the kinetics observed in this study, peak concentration of TGFβ1 lagged behind.
TGFβ1 and OPN as prognostic factors
Transforming growth factor beta 1 is both expressed by tumor cells and adjacent stroma [31–33]. Prognostic impact of plasma levels is therefore controversial [34–38]. In this patient cohort we observed a significant negative correlation of pre-therapeutic TGFβ1 with overall survival.
The prognostic significance of osteopontin in head and neck cancer has been reported in patients treated by definite radiotherapy [15, 16, 18, 39] and is thought to relate to an association with tumor hypoxia and malignant phenotype. A hypoxic sensitizer (nimorazole) was of benefit in the high osteopontin tertile in the Dahanca 5 study. In contrast, data from TROG 02.02 did not find an association with survival parameters [20] and no predictive correlation with tirapazamine treatment.
Our data support a role of OPN as a prognostic biomarker for inoperable patients (treated with definite radiochemotherapy) and extend this observation to patients with combined surgery and radiotherapy.
Limitations of this and other single center studies are caused by the limited sample size. Furthermore, despite the fact that there is a large body of data on OPN detection there is still not a generally validated and certified test, making cross study comparisons more difficult. Most groups have been using an ELISA based system. But still there is also no standard ELISA kit, which would make at least these data more comparable. As shown by Vordermark et al. OPN values differed significantly when different ELISA systems were applied [40]. Also different OPN values are generated when using plasma or serum samples. For TGFβ1 the described ELISA system can only detect the total latent form and not the functionally active form of TGFβ1 which could also lead to some bias.
Conclusion
In conclusion, patients with head and neck cancer showed a rise in osteopontin plasma levels as short as 24 h after surgery. Four weeks after tumor resection OPN concentration decreased to baseline levels mirroring the pre-treatment situation. This long lasting OPN increase was presumably associated with wound healing. Both osteopontin and TGFβ1 base line levels had prognostic impact on patient survival. Confirmation, especially for the postoperative setting as well as correlation with tumor gene signatures seems worthwhile.
Acknowledgements
Not applicable.
Funding
This publication was supported by the Open Access Publication Fund of the University of Würzburg. This institution had no influence in the trial design or data collection, analyses and interpretation of data and also not in writing the manuscript.
Availability of data and materials
The datasets used and/or analysed during the current study are available from the corresponding author on reasonable request.
Authors’ contributions
PB, VD and FM designed the study. KP, GT, SA, SM and PB were responsible for patient recruitment and sample assessment. KP and WG aliquoted the samples, stored them and performed the ELISA experiments. GT, FT, SA, SM and PB participated in the data collection and PB and MU in the statistical analysis. PB, WG and FM drafted the manuscript. All authors performed critical review of the manuscript and finally approved the manuscript.
Competing interests
All authors declare that they do not have any competing interests.
Consent for publication
Not applicable. In this manuscript no individual patient data is presented.
Ethical approval and consent to participate
The study was approved by the ethics committee of the medical faculty of the University of Würzburg, Germany (reference numbers 05/06 and 221/11). All patients gave their written informed consent.
Abbreviations
- EDTA
Ethylenediaminetetraacetic acid
- ELISA
Enzyme-linked immunosorbent assay
- HNSCC
Squamous cell carcinoma of the head and neck
- OPN
Osteopontin
- TGFβ1
Transforming growth factor 1
Contributor Information
Bülent Polat, Phone: +49 931 201 28210, Email: Polat_B@ukw.de.
Philipp Kaiser, Email: ph.kaiser@gmx.de.
Gisela Wohlleben, Email: Wohlleben_G@ukw.de.
Thomas Gehrke, Email: Gehrke_T@ukw.de.
Agmal Scherzad, Email: Scherzad_A@ukw.de.
Matthias Scheich, Email: Scheich_M@ukw.de.
Uwe Malzahn, Email: Malzahn_U@ukw.de.
Dirk Vordermark, Email: dirk.vordermark@medizin.uni-halle.de.
Michael Flentje, Email: Flentje_M@ukw.de.
References
- 1.Siegel RL, Miller KD, Jemal A. Cancer statistics, 2015. CA Cancer J Clin. 2015;65:5–29. doi: 10.3322/caac.21254. [DOI] [PubMed] [Google Scholar]
- 2.Pignon JP, le Maitre A, Maillard E, Bourhis J, Group M-NC. Meta-analysis of chemotherapy in head and neck cancer (MACH-NC): an update on 93 randomised trials and 17,346 patients. Radiother Oncol. 2009;92:4–14. doi: 10.1016/j.radonc.2009.04.014. [DOI] [PubMed] [Google Scholar]
- 3.Blanchard P, Baujat B, Holostenco V, Bourredjem A, Baey C, Bourhis J, Pignon JP, Group M-CC Meta-analysis of chemotherapy in head and neck cancer (MACH-NC): a comprehensive analysis by tumour site. Radiother Oncol. 2011;100:33–40. doi: 10.1016/j.radonc.2011.05.036. [DOI] [PubMed] [Google Scholar]
- 4.Nguyen-Tan PF, Zhang Q, Ang KK, Weber RS, Rosenthal DI, Soulieres D, et al. Randomized phase III trial to test accelerated versus standard fractionation in combination with concurrent cisplatin for head and neck carcinomas in the Radiation Therapy Oncology Group 0129 trial: long-term report of efficacy and toxicity. J Clin Oncol. 2014;32:3858–66. doi: 10.1200/JCO.2014.55.3925. [DOI] [PMC free article] [PubMed] [Google Scholar]
- 5.Bourhis J, Sire C, Graff P, Gregoire V, Maingon P, Calais G, et al. Concomitant chemoradiotherapy versus acceleration of radiotherapy with or without concomitant chemotherapy in locally advanced head and neck carcinoma (GORTEC 99–02): an open-label phase 3 randomised trial. Lancet Oncol. 2012;13:145–53. doi: 10.1016/S1470-2045(11)70346-1. [DOI] [PubMed] [Google Scholar]
- 6.Machiels JP, Haddad RI, Fayette J, Licitra LF, Tahara M, Vermorken JB, et al. Afatinib versus methotrexate as second-line treatment in patients with recurrent or metastatic squamous-cell carcinoma of the head and neck progressing on or after platinum-based therapy (LUX-Head & Neck 1): an open-label, randomised phase 3 trial. Lancet Oncol. 2015;16:583–94. doi: 10.1016/S1470-2045(15)70124-5. [DOI] [PubMed] [Google Scholar]
- 7.Rosenthal DI, Harari PM, Giralt J, Bell D, Raben D, Liu J, Schulten J, Ang KK, Bonner JA. Association of Human Papillomavirus and p16 Status With Outcomes in the IMCL-9815 Phase III Registration Trial for Patients With Locoregionally Advanced Oropharyngeal Squamous Cell Carcinoma of the Head and Neck Treated With Radiotherapy With or Without Cetuximab. J Clin Oncol. 2015;28:JCO625970. doi: 10.1200/JCO.2015.62.5970. [DOI] [PMC free article] [PubMed] [Google Scholar]
- 8.Ang KK, Zhang Q, Rosenthal DI, Nguyen-Tan PF, Sherman EJ, Weber RS, et al. Randomized phase III trial of concurrent accelerated radiation plus cisplatin with or without cetuximab for stage III to IV head and neck carcinoma: RTOG 0522. J Clin Oncol. 2014;32:2940–50. doi: 10.1200/JCO.2013.53.5633. [DOI] [PMC free article] [PubMed] [Google Scholar]
- 9.Bellahcene A, Castronovo V, Ogbureke KU, Fisher LW, Fedarko NS. Small integrin-binding ligand N-linked glycoproteins (SIBLINGs): multifunctional proteins in cancer. Nat Rev Cancer. 2008;8:212–26. doi: 10.1038/nrc2345. [DOI] [PMC free article] [PubMed] [Google Scholar]
- 10.Chong HC, Tan CK, Huang RL, Tan NS. Matricellular proteins: a sticky affair with cancers. J Oncol. 2012;2012:351089. doi: 10.1155/2012/351089. [DOI] [PMC free article] [PubMed] [Google Scholar]
- 11.Mack PC, Redman MW, Chansky K, Williamson SK, Farneth NC, Lara PN, Jr, et al. Lower osteopontin plasma levels are associated with superior outcomes in advanced non-small-cell lung cancer patients receiving platinum-based chemotherapy: SWOG Study S0003. J Clin Oncol. 2008;26:4771–6. doi: 10.1200/JCO.2008.17.0662. [DOI] [PMC free article] [PubMed] [Google Scholar]
- 12.Bramwell VH, Doig GS, Tuck AB, Wilson SM, Tonkin KS, Tomiak A, Perera F, Vandenberg TA, Chambers AF. Serial plasma osteopontin levels have prognostic value in metastatic breast cancer. Clin Cancer Res. 2006;12:3337–43. doi: 10.1158/1078-0432.CCR-05-2354. [DOI] [PubMed] [Google Scholar]
- 13.Vergis R, Corbishley CM, Norman AR, Bartlett J, Jhavar S, Borre M, et al. Intrinsic markers of tumour hypoxia and angiogenesis in localised prostate cancer and outcome of radical treatment: a retrospective analysis of two randomised radiotherapy trials and one surgical cohort study. Lancet Oncol. 2008;9:342–51. doi: 10.1016/S1470-2045(08)70076-7. [DOI] [PubMed] [Google Scholar]
- 14.Rangel J, Nosrati M, Torabian S, Shaikh L, Leong SP, Haqq C, Miller JR, 3rd, Sagebiel RW, Kashani-Sabet M. Osteopontin as a molecular prognostic marker for melanoma. Cancer. 2008;112:144–50. doi: 10.1002/cncr.23147. [DOI] [PubMed] [Google Scholar]
- 15.Petrik D, Lavori PW, Cao H, Zhu Y, Wong P, Christofferson E, et al. Plasma osteopontin is an independent prognostic marker for head and neck cancers. J Clin Oncol. 2006;24:5291–7. doi: 10.1200/JCO.2006.06.8627. [DOI] [PubMed] [Google Scholar]
- 16.Hou X, Wu X, Huang P, Zhan J, Zhou T, Ma Y, et al. Osteopontin is a useful predictor of bone metastasis and survival in patients with locally advanced nasopharyngeal carcinoma. Int J Cancer. 2015;137:1672–8. doi: 10.1002/ijc.29540. [DOI] [PubMed] [Google Scholar]
- 17.Le QT, Chen E, Salim A, Cao H, Kong CS, Whyte R, et al. An evaluation of tumor oxygenation and gene expression in patients with early stage non-small cell lung cancers. Clin Cancer Res. 2006;12:1507–14. doi: 10.1158/1078-0432.CCR-05-2049. [DOI] [PubMed] [Google Scholar]
- 18.Overgaard J, Eriksen JG, Nordsmark M, Alsner J, Horsman MR. Plasma osteopontin, hypoxia, and response to the hypoxia sensitiser nimorazole in radiotherapy of head and neck cancer: results from the DAHANCA 5 randomised double-blind placebo-controlled trial. Lancet Oncol. 2005;6:757–64. doi: 10.1016/S1470-2045(05)70292-8. [DOI] [PubMed] [Google Scholar]
- 19.Polat B, Said HM, Katzer A, Guckenberger M, Mlynski R, Flentje M, Vordermark D. Osteopontin Plasma Levels in Head and Neck Cancer Patients During Radiotherapy. Int J Radiat Oncol Biol Phys. 2010;78:S660. doi: 10.1016/j.ijrobp.2010.07.1537. [DOI] [Google Scholar]
- 20.Lim AM, Rischin D, Fisher R, Cao H, Kwok K, Truong D, et al. Prognostic Significance of Plasma Osteopontin in Patients with Locoregionally Advanced Head and Neck Squamous Cell Carcinoma Treated on TROG 02.02 Phase III Trial. Clin Cancer Res. 2012;18:301–7. doi: 10.1158/1078-0432.CCR-11-2295. [DOI] [PMC free article] [PubMed] [Google Scholar]
- 21.Blasberg JD, Pass HI, Goparaju CM, Flores RM, Lee S, Donington JS. Reduction of elevated plasma osteopontin levels with resection of non-small-cell lung cancer. J Clin Oncol. 2010;28:936–41. doi: 10.1200/JCO.2009.25.5711. [DOI] [PMC free article] [PubMed] [Google Scholar]
- 22.Polat B, Wohlleben G, Katzer A, Djuzenova CS, Technau A, Flentje M. Influence of osteopontin silencing on survival and migration of lung cancer cells. Strahlenther Onkol. 2013;189:62–7. doi: 10.1007/s00066-012-0238-5. [DOI] [PubMed] [Google Scholar]
- 23.Imano M, Okuno K, Itoh T, Satou T, Ishimaru E, Yasuda T, et al. Osteopontin induced by macrophages contribute to metachronous liver metastases in colorectal cancer. Am Surg. 2011;77:1515–20. [PubMed] [Google Scholar]
- 24.Rao G, Wang H, Li B, Huang L, Xue D, Wang X, et al. Reciprocal interactions between tumor-associated macrophages and CD44-positive cancer cells via osteopontin/CD44 promote tumorigenicity in colorectal cancer. Clin Cancer Res. 2013;19:785–97. doi: 10.1158/1078-0432.CCR-12-2788. [DOI] [PubMed] [Google Scholar]
- 25.Park JE, Barbul A. Understanding the role of immune regulation in wound healing. Am J Surg. 2004;187:11S–6. doi: 10.1016/S0002-9610(03)00296-4. [DOI] [PubMed] [Google Scholar]
- 26.Beloosesky Y, Weiss A, Hershkovitz A, Hendel D, Barak V. Serum transforming growth factor beta-1 post hip fracture repair in elderly patients. Cytokine. 2011;54:56–60. doi: 10.1016/j.cyto.2010.12.015. [DOI] [PubMed] [Google Scholar]
- 27.Vieira AE, Repeke CE, Ferreira Junior Sde B, Colavite PM, Biguetti CC, Oliveira RC, et al. Intramembranous bone healing process subsequent to tooth extraction in mice: micro-computed tomography, histomorphometric and molecular characterization. PLoS One. 2015;10:e0128021. doi: 10.1371/journal.pone.0128021. [DOI] [PMC free article] [PubMed] [Google Scholar]
- 28.Weber CE, Li NY, Wai PY, Kuo PC. Epithelial-mesenchymal transition, TGF-beta, and osteopontin in wound healing and tissue remodeling after injury. J Burn Care Res. 2012;33:311–8. doi: 10.1097/BCR.0b013e318240541e. [DOI] [PMC free article] [PubMed] [Google Scholar]
- 29.Weber CE, Kothari AN, Wai PY, Li NY, Driver J, Zapf MA, et al. Osteopontin mediates an MZF1-TGF-beta1-dependent transformation of mesenchymal stem cells into cancer-associated fibroblasts in breast cancer. Oncogene. 2015;34:4821–33. doi: 10.1038/onc.2014.410. [DOI] [PMC free article] [PubMed] [Google Scholar]
- 30.Sun J, Feng A, Chen S, Zhang Y, Xie Q, Yang M, et al. Osteopontin splice variants expressed by breast tumors regulate monocyte activation via MCP-1 and TGF-beta1. Cell Mol Immunol. 2013;10:176–82. doi: 10.1038/cmi.2012.67. [DOI] [PMC free article] [PubMed] [Google Scholar]
- 31.Costea DE, Hills A, Osman AH, Thurlow J, Kalna G, Huang X, et al. Identification of two distinct carcinoma-associated fibroblast subtypes with differential tumor-promoting abilities in oral squamous cell carcinoma. Cancer Res. 2013;73:3888–901. doi: 10.1158/0008-5472.CAN-12-4150. [DOI] [PubMed] [Google Scholar]
- 32.Ikushima H, Miyazono K. TGFbeta signalling: a complex web in cancer progression. Nat Rev Cancer. 2010;10:415–24. doi: 10.1038/nrc2853. [DOI] [PubMed] [Google Scholar]
- 33.Rosenthal E, McCrory A, Talbert M, Young G, Murphy-Ullrich J, Gladson C. Elevated expression of TGF-beta1 in head and neck cancer-associated fibroblasts. Mol Carcinog. 2004;40:116–21. doi: 10.1002/mc.20024. [DOI] [PubMed] [Google Scholar]
- 34.Chang PY, Kuo YB, Wu TL, Liao CT, Sun YC, Yen TC, Chan EC. Association and prognostic value of serum inflammation markers in patients with leukoplakia and oral cavity cancer. Clin Chem Lab Med. 2013;51:1291–300. doi: 10.1515/cclm-2012-0504. [DOI] [PubMed] [Google Scholar]
- 35.Wu CT, Chang YH, Lin WY, Chen WC, Chen MF. TGF Beta1 Expression Correlates with Survival and Tumor Aggressiveness of Prostate Cancer. Ann Surg Oncol. 2015;22(Suppl 3):1587–93. doi: 10.1245/s10434-015-4804-9. [DOI] [PubMed] [Google Scholar]
- 36.Shariat SF, Kattan MW, Traxel E, Andrews B, Zhu K, Wheeler TM, Slawin KM. Association of pre- and postoperative plasma levels of transforming growth factor beta(1) and interleukin 6 and its soluble receptor with prostate cancer progression. Clin Cancer Res. 2004;10:1992–9. doi: 10.1158/1078-0432.CCR-0768-03. [DOI] [PubMed] [Google Scholar]
- 37.Tas F, Karabulut S, Serilmez M, Ciftci R, Duranyildiz D. Clinical significance of serum transforming growth factor-beta 1 (TGF-beta1) levels in patients with epithelial ovarian cancer. Tumour Biol. 2014;35:3611–6. doi: 10.1007/s13277-013-1476-6. [DOI] [PubMed] [Google Scholar]
- 38.Ciftci R, Tas F, Yasasever CT, Aksit E, Karabulut S, Sen F, et al. High serum transforming growth factor beta 1 (TGFB1) level predicts better survival in breast cancer. Tumour Biol. 2014;35:6941–8. doi: 10.1007/s13277-014-1932-y. [DOI] [PubMed] [Google Scholar]
- 39.Bache M, Reddemann R, Said HM, Holzhausen HJ, Taubert H, Becker A, et al. Immunohistochemical detection of osteopontin in advanced head-and-neck cancer: prognostic role and correlation with oxygen electrode measurements, hypoxia-inducible-factor-1alpha-related markers, and hemoglobin levels. Int J Radiat Oncol Biol Phys. 2006;66:1481–7. doi: 10.1016/j.ijrobp.2006.07.1376. [DOI] [PubMed] [Google Scholar]
- 40.Vordermark D, Said HM, Katzer A, Kuhnt T, Hansgen G, Dunst J, Flentje M, Bache M. Plasma osteopontin levels in patients with head and neck cancer and cervix cancer are critically dependent on the choice of ELISA system. BMC Cancer. 2006;6:207. doi: 10.1186/1471-2407-6-207. [DOI] [PMC free article] [PubMed] [Google Scholar]
Associated Data
This section collects any data citations, data availability statements, or supplementary materials included in this article.
Data Availability Statement
The datasets used and/or analysed during the current study are available from the corresponding author on reasonable request.


