

Abstract
Introduction
Approximately 67,000 hip fractures occurred in England, Wales and Northern Ireland in 2014, and annual hospital costs for fracture are around £1.1 billion. We review the potential scope for improving length of stay (LOS).
Methods
Hospital Episode Statistics data on non-elective admissions to 137 hospital trusts between November 2013 and October 2015 with a primary diagnosis of fractured neck of femur were analysed. The primary outcome was superspell LOS, which is the total LOS for all related spells for a single patient during an episode of care. Secondary outcomes were discharge to home, readmission at 28 days and in-hospital mortality.
Results
The mean observed LOS was 22.1±3.8 days (range 12.3-33.7 days). The range for case mix-adjusted expected LOS was 21.5-24.4 days. On average, 6.7±1.5% (range 3.6%-10.9%) of patients died while in hospital, at a relative risk of in-hospital mortality of 28.2-182.9. A mean of 12.3±3.2% (range 3.9% to 23.0%) of patients were readmitted at 28 days, at a relative relative risk of 34.8-203.2.
Conclusions
The wide range of observed LOS in our study is unlikely to be due to the case mix, as the case mix-adjusted range of LOS is less than 3 days, but rather due to local processes and pathways. There is therefore considerable scope for quality and efficiency of care improvements in our hospitals. We propose this could be best achieved if clinicians experienced in enhanced recovery focused on FNOF pathways.
Keywords: Femoral neck fractures, Emergency surgery, Enhanced recovery Fast track, Length of stay
The length of hospital stay (LOS) associated with hip fracture, also known as fractured neck of femur (FNOF), is a major public health issue due to the ageing population. Approximately 67,000 hip fractures were recorded in England, Wales and Northern Ireland in 2014, and annual hospital costs are around £1.1 billion.1,2 The average age of patients with FNOF is over 80 years, 75% are female and many patients have significant comorbidities that can delay surgery and recovery.3 Hip fracture is the most serious consequence of falls among older people, with a mortality rate of 10% at 1 month after the fall, 20% at 4 months and 30% at 1 year. Many of those who recover suffer a loss in mobility and independence.3
Demographic projections indicate that the UK annual incidence of FNOF will rise to 101,000 in 2020,4 with an associated increase in annual expenditure. The majority of this expenditure will be on hospital bed days, with a substantial portion on health and social aftercare.
One indicator, or proxy, of quality of care often used within healthcare is that of LOS, as it is considered an appropriate measure of safety and efficacy. Data from the 2014 National Hip Fracture Database (NHFD) annual report revealed significant variations in length of stay,1 at a mean LOS (both acute and post-acute) in 163 hospitals in England of 19.5±4.9 days (range 8.6–47.9. days). A study based on NHFD data found that hip fracture patients account for at least 1.5 million bed-days per year, which equates to the continuous occupation of 4,106 beds at any one time.5
Despite the introduction of NHFD, National Institute for Health and Care Excellence (NICE) and other best practice guidelines having led to measurable improvements in outcomes, the anticipated rise in patient numbers can only contribute towards an increase in the number of deaths through comorbidities and an increase in costs through bed usage.6
In recent years, the enhanced recovery (also called fast-track, accelerated recovery or rapid recovery) approach to perioperative care, which was developed by Henrik Kehlet,7 has been successfully used in the treatment of patients undergoing a range of different surgical procedures.8 The principles of enhanced recovery include optimising pain relief, reducing the surgical stress response, early mobilisation and empowering the patient to regain independence as quickly as possible post-surgery.
The pathway has been adopted in orthopaedics, and there is strong evidence that its use in hip replacement surgery decreases LOS, with no increases in readmission rates.9 Enhanced recovery protocols have also been shown to be effective in revision total hip replacement,10 in elderly co.horts,11 and in FNOF patients.12,13
However, an audit of hospitals in Denmark,14 where fast-track pathways were introduced in the late 1990s, concluded that, although LOS had been reduced through the introduction of the pathways and improvements were seen in many quality indicators, no single department had implemented the whole package. This resulted in significant variability in the treatment and care of patients, suggesting further potential for improvement.
We review whether there is scope to improve current LOS for FNOF patients within the United Kingdom through service improvement and the introduction of enhanced recovery pathways. Readmission rates at 28 days, in-hospital mortality rate and rates of discharge to home are also examined.
Methods
We interrogated Hospital Episode Statistics (HES) data, which is gathered locally through each hospital’s patient administration or information system, and includes all inpatient and day-case activity delivered by NHS hospitals in England. The dataset has over 300 fields, including age, gender, admission method, 14 diagnosis fields, 12 operation fields, LOS, waiting times, ethnic group and method of discharge (including in-hospital mortality). Over 14 million records are collected annually.
Emergency admissions with a primary diagnosis of FNOF between November 2013 and October 2014 to non-specialist acute hospitals were examined. Data on LOS, readmission rates, discharge to home rate and hospital mortality rates were retrieved using Dr Foster’s Practice and Provider Monitor tool, while their Quality Investigator tool was used to retrieve data on relative risk. It should be noted that the two tools use slightly different variables to adjust for case-mix, as described in Table 1.
Table 1.
Definitions of outcome measures28
| Term | Definition |
|---|---|
| Spell | The total continuous stay of a patient using a hospital bed on premises controlled by a health care provider, during which medical care is the responsibility of one or more consultants, or patient is receiving care under one or more nursing episodes or midwife episodes on a ward. |
| Superspell | Collected term of all the related, or linked, spells for a single patient. It is the time a patient spends within one hospital trust before being discharged. Spells are linked to superspells when:
|
| Superspell LOS | For superspell, it is the number of days between date of admission in first spell and date of admission from last spell in superspell. It includes all patients apart from day cases so will include outliers (patients with long LOS and 0 day LOS). |
| Expected LOS | The England average LOS for inpatient superspells is adjusted for diagnosis/procedures/HRG, subgroup, age, sex, admission type, deprivation quintile and financial year and is applied as a benchmark to each patient. The overall figures for the selected patients is the average of the benchmarks. Benchmarks have been calculated for each of the years up to and including the latest complete year for which there is HES data. The Dr Foster Practice and Provider Monitor tool was used to download the data. |
| Difference in LOS | Difference between observed LOS and expected LOS |
| Discharge destination | This comprises: home, other place, transfer (non-acute), transfer (acute), transfer (internal), (transfer unknown), unknown, or death |
| RR | Ratio of the observed number of outcomes divided by the risk adjusted expected group, multiplied by 100. RR=[n(observed)/n(expected)] x 100 The benchmark figure (NHS England average) is 100. Values greater than 100 represent performance higher than the benchmark. Values lower than 100 represent performance lower than the benchmark The risk adjusted expected group has been adjusted for age, sex, method of admission, socio-economic deprivation, diagnosis CCS subgroup, co-morbidity (Charlson index), source of admission, number of emergency admissions in last 12 months, palliative care, year of discharge, month of admission, interaction between age and Charlson score (please note that this differs from adjustment made for superspell expected LOS as the Dr Foster Quality Investigator tool was used to download data in this instance). |
CCS = Clinical Classification System; HES = Hospital Episode Statistics; HRG = healthcare resource group; ID = identification; LOS = length of stay; RR = relative risk
From these data, we determined the observed and case mix-adjusted expected superspell LOS, and the difference in LOS. Superspell LOS, which accounts for all related spells for a single patient during an episode of care, was examined to take into account the differing practices of trusts in transferring patients from an acute setting to either rehabilitation or home. Secondary outcomes included rates of 28-day readmission, discharge to home and in-hospital mortality.
Following exclusion of trusts with fewer than 60 superspells, data from 137 institutions were analysed (Table 2). Individual trusts were not examined separately, as the analysis focused on variations in LOS and the scope for improvement.
Table 2.
Trusts included in the analysis
| Name of trust |
|---|
| Aintree University Hospital NHS Foundation Trust |
| Airedale NHS Foundation Trust |
| Ashford and St Peter's Hospitals NHS Foundation Trust |
| Barking, Havering and Redbridge University Hospitals NHS Trust |
| Barnsley Hospital NHS Foundation Trust |
| Barts Health NHS Trust |
| Basildon and Thurrock University Hospitals NHS Foundation Trust |
| Bedford Hospital NHS Trust |
| Blackpool Teaching Hospitals NHS Foundation Trust |
| Bolton NHS Foundation Trust |
| Bradford Teaching Hospitals NHS Foundation Trust |
| Brighton and Sussex University Hospitals NHS Trust |
| Buckinghamshire Healthcare NHS Trust |
| Burton Hospitals NHS Foundation Trust |
| Calderdale and Huddersfield NHS Foundation Trust |
| Cambridge University Hospitals NHS Foundation Trust |
| Central Manchester University Hospitals NHS Foundation Trust |
| Chelsea and Westminster Hospital NHS Foundation Trust |
| Chesterfield Royal Hospital NHS Foundation Trust |
| City Hospitals Sunderland NHS Foundation Trust |
| Colchester Hospital University NHS Foundation Trust |
| Countess Of Chester Hospital NHS Foundation Trust |
| County Durham and Darlington NHS Foundation Trust |
| Croydon Health Services NHS Trust |
| Dartford and Gravesham NHS Trust |
| Derby Hospitals NHS Foundation Trust |
| Doncaster and Bassetlaw Hospitals NHS Foundation Trust |
| Dorset County Hospital NHS Foundation Trust |
| East and North Hertfordshire NHS Trust |
| East Cheshire NHS Trust |
| East Kent Hospitals University NHS Foundation Trust |
| East Lancashire Hospitals NHS Trust |
| East Sussex Healthcare NHS Trust |
| Epsom and St Helier University Hospitals NHS Trust |
| Frimley Health NHS Foundation Trust |
| Gateshead Health NHS Foundation Trust |
| George Eliot Hospital NHS Trust |
| Gloucestershire Hospitals NHS Foundation Trust |
| Great Western Hospitals NHS Foundation Trust |
| Guy's and St Thomas' NHS Foundation Trust |
| Hampshire Hospitals NHS Foundation Trust |
| Harrogate and District NHS Foundation Trust |
| Heart Of England NHS Foundation Trust |
| Heatherwood and Wexham Park Hospitals NHS Foundation Trust |
| Hinchingbrooke Health Care NHS Trust |
| Homerton University Hospital NHS Foundation Trust |
| Hull and East Yorkshire Hospitals NHS Trust |
| Imperial College Healthcare NHS Trust |
| Ipswich Hospital NHS Trust |
| Isle Of Wight NHS Trust |
| James Paget University Hospitals NHS Foundation Trust |
| Kettering General Hospital NHS Foundation Trust |
| King's College Hospital NHS Foundation Trust |
| Kingston Hospital NHS Foundation Trust |
| Lancashire Teaching Hospitals NHS Foundation Trust |
| Leeds Teaching Hospitals NHS Trust |
| Lewisham and Greenwich NHS Trust |
| Luton and Dunstable University Hospital NHS Foundation Trust |
| Maidstone and Tunbridge Wells NHS Trust |
| Medway NHS Foundation Trust |
| Mid Cheshire Hospitals NHS Foundation Trust |
| Mid Essex Hospital Services NHS Trust |
| Mid Staffordshire NHS Foundation Trust |
| Mid Yorkshire Hospitals NHS Trust |
| Milton Keynes Hospital NHS Foundation Trust |
| Norfolk and Norwich University Hospitals NHS Foundation Trust |
| North Bristol NHS Trust |
| North Cumbria University Hospitals NHS Trust |
| North Middlesex University Hospital NHS Trust |
| North Tees and Hartlepool NHS Foundation Trust |
| Northampton General Hospital NHS Trust |
| Northern Devon Healthcare NHS Trust |
| Northern Lincolnshire and Goole NHS Foundation Trust |
| Northumbria Healthcare NHS Foundation Trust |
| Nottingham University Hospitals NHS Trust |
| Oxford University Hospitals NHS Trust |
| Pennine Acute Hospitals NHS Trust |
| Peterborough and Stamford Hospitals NHS Foundation Trust |
| Plymouth Hospitals NHS Trust |
| Poole Hospital NHS Foundation Trust |
| Portsmouth Hospitals NHS Trust |
| Royal Berkshire NHS Foundation Trust |
| Royal Cornwall Hospitals NHS Trust |
| Royal Devon and Exeter NHS Foundation Trust |
| Royal Free London NHS Foundation Trust |
| Royal Liverpool and Broadgreen University Hospitals NHS Trust |
| Royal Surrey County Hospital NHS Foundation Trust |
| Royal United Hospital Bath NHS Trust |
| Salford Royal NHS Foundation Trust |
| Salisbury NHS Foundation Trust |
| Sandwell and West Birmingham Hospitals NHS Trust |
| Sheffield Teaching Hospitals NHS Foundation Trust |
| Sherwood Forest Hospitals NHS Foundation Trust |
| Shrewsbury and Telford Hospital NHS Trust |
| South Devon Healthcare NHS Foundation Trust |
| South Tees Hospitals NHS Foundation Trust |
| South Tyneside NHS Foundation Trust |
| South Warwickshire NHS Foundation Trust |
| Southend University Hospital NHS Foundation Trust |
| Southport and Ormskirk Hospital NHS Trust |
| St George's Healthcare NHS Trust |
| St Helens and Knowsley Hospitals NHS Trust |
| Stockport NHS Foundation Trust |
| Surrey and Sussex Healthcare NHS Trust |
| Tameside Hospital NHS Foundation Trust |
| Taunton and Somerset NHS Foundation Trust |
| The Dudley Group NHS Foundation Trust |
| The Hillingdon Hospitals NHS Foundation Trust |
| The Newcastle Upon Tyne Hospitals NHS Foundation Trust |
| The Princess Alexandra Hospital NHS Trust |
| The Queen Elizabeth Hospital, King's Lynn, NHS Foundation Trust |
| The Rotherham NHS Foundation Trust |
| The Royal Wolverhampton NHS Trust |
| The Whittington Hospital NHS Trust |
| United Lincolnshire Hospitals NHS Trust |
| University College London Hospitals NHS Foundation Trust |
| University Hospital Of North Staffordshire NHS Trust |
| University Hospital Of South Manchester NHS Foundation Trust |
| University Hospital Southampton NHS Foundation Trust |
| University Hospitals Birmingham NHS Foundation Trust |
| University Hospitals Bristol NHS Foundation Trust |
| University Hospitals Coventry and Warwickshire NHS Trust |
| University Hospitals Of Leicester NHS Trust |
| University Hospitals Of Morecambe Bay NHS Foundation Trust |
| Walsall Healthcare NHS Trust |
| Warrington and Halton Hospitals NHS Foundation Trust |
| West Hertfordshire Hospitals NHS Trust |
| West Middlesex University Hospital NHS Trust |
| West Suffolk NHS Foundation Trust |
| Western Sussex Hospitals NHS Foundation Trust |
| Weston Area Health NHS Trust |
| Wirral University Teaching Hospital NHS Foundation Trust |
| Worcestershire Acute Hospitals NHS Trust |
| Wrightington, Wigan and Leigh NHS Foundation Trust |
| Wye Valley NHS Trust |
| Yeovil District Hospital NHS Foundation Trust |
| York Teaching Hospital NHS Foundation Trust |
Statistical analysis
The mean and standard deviation, alongside the minimum and maximum values, were determined for all outcomes. Descriptive statistics were calculated using SPSS Statistics Version 19.0 (IBM, Armonk, NY, USA). The relative risk calculation were based on 135 trusts, as data were unavailable for two trusts. As quality of the available data for other discharge outcomes (discharged other than to home, non-acute, acute, internal and unknown transfer, and unknown) was poor, they were not included in the analysis. Only the first 9 months of the 28-day readmission data were assessed as the final 3 months were not available at the time of analysis.
Results
There were 63,011 inpatient superspells across 137 trusts during the study period.
Table 3 shows the observed and case mix-adjusted expected superspell LOS and the difference in LOS, as well as 28-day readmission, discharge to home and in-hospital mortality rates. The mean observed superspell LOS was only 1.3 days less than the mean case-mix expected superspell LOS, at 22.1 days versus 23.4 days. However, there was a wide variation in observed LOS, at 21.4 days (range 12.3–33.7 days) versus 2.9 days (range 21.5–24.4 days) for the case mix-adjusted expected LOS. Figure 1 shows the mean superspell LOS for the 137 trusts; Figure 2 shows the difference between the expected and observed superspell mean LOS.
Table 3.
Mean (SD) and minimum and maximum values for all outcomes
| Trusts (N) | Mean (SD) | Minimum | Maximum | |
|---|---|---|---|---|
| LOS superspells (days) | ||||
| Observed LOS | 137 | 22.1 (3.8) | 12.3 | 33.7 |
| Expected LOS | 137 | 23.4 (0.5) | 21.5 | 24.4 |
| Difference in LOS | 137 | -1.3 (3.8) | -11.9 | 12.1 |
| Discharge outcome % | ||||
| Discharge home (usual place of residence) | 137 | 62.0 (10.9) | 34.4 | 89.6 |
| In-hospital mortality | 100 | 6.7 (1.5) | 3.6 | 10.9 |
| Readmission at 28 days* % | 137 | 12.3 (3.2) | 3.9 | 23.0 |
* Only the first 9 months of data were available for 28-day readmissions.
LOS = length of hospital stay; SD = standard deviation.
Figure 1.
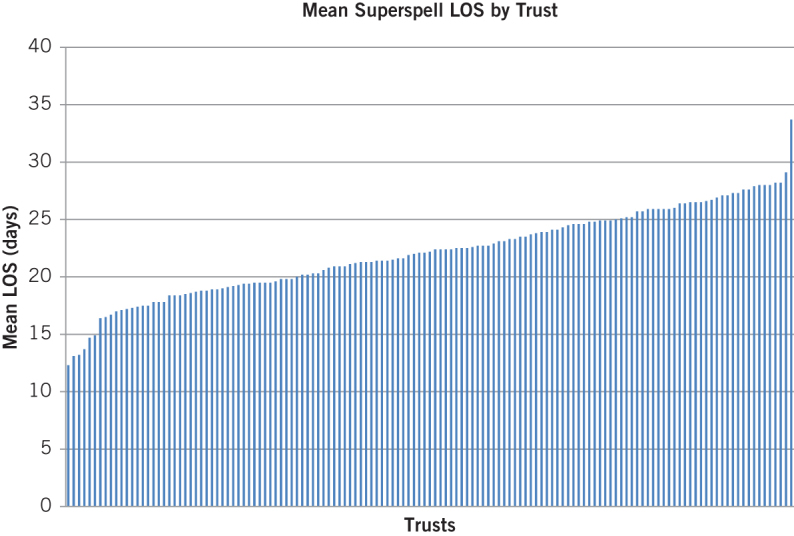
Mean superspell length of hospital stay (LOS) for all 137 trusts, by LOS
Figure 2.

Difference between observed length of hospital stay (LOS) and case mix-adjusted expected LOS
An average of 62.0% of patients (range 34.4%–89.6%) were discharged to home. A mean of 6.7% of patients died while in hospital (range of 3.6%–10.9%). The relative risk of in-hospital mortality ranged from 28.2 to 182.9 (Table 4). An average of 12.3% of patients were readmitted at 28 days (range 3.9%–23.0%). The relative risk of re-admission ranged from 34.8 to 203.2 (Table 1).
Table 4.
Range of relative risk for mortality and readmission at 28 days
| Relative Risk | Trusts (N) | Minimum | Maximum |
|---|---|---|---|
| Mortality | 135 | 28.2* | 182.9** |
| Readmission at 28 days | 135 | 34.8* | 203.2** |
* The relative risk is outside the lower 95% confidence limit.
** The relative risk is outside the upper 95% confidence limit.
Discussion
A long LOS for FNOF patients is not desirable, as they have an increased risk of developing complications and losing their independence.15 Studies show that patients who have early surgery have better mobilisation subsequently, and are therefore more likely to go home independently.13,16 The wide range of observed LOS in our study is not likely to be due to case mix alone, as the range of case mix-adjusted expected LOS was less than 3 days. The factors taken into account by case mix-adjustment are comprehensive and include diagnosis/procedures/healthcare resource group, subgroup, age, sex, admission type, deprivation quintile and financial year. If the difference in LOS between trusts of 21 days is therefore not due to case-mix it is highly likely that the differences will be due to local processes and pathways. This finding is in line with the NHFD annual report,1 which describes and challenges the variations in practice around England, Wales and Northern Ireland, and Egerod et al’s audit,14 which found significant variability in the treatment and care of FNOF patients in Denmark. Our finding also supports a 2014 study by Holt et al,17 in which they found that the inter-hospital variation in outcomes for emergency admissions in England was related within individual providers, suggesting that systemic structural and process factors play a role.
It is therefore likely that the trusts with the shortest LOS have used interventions to organise care more effectively, and have introduced pathway changes that optimise the patient medically and physically pre-, intra- and postoperatively. An integrated multimodal approach is analogous and extremely similar to that of an enhanced recovery pathway. Enhanced recovery interventions adapted for FNOF may include the use of improved analgesia, such as femoral nerve block, improved medical optimisation, reduced time to surgery, early anaesthesiology assessment, a systematic approach to nutrition, fluid and oxygen therapy and urinary retention, geriatrician involvement in the medical management team, and effective discharge planning and liaison with social and community services.13,18–21
The large variability in patients being discharged to their usual place of residence (home) also suggests that there is a wide variation in discharge procedures and in the social and community support available. Hospitals with low rates of discharge to home may benefit from adopting procedures in line with the best-performing trusts. There is also a large variation across trusts in readmission rates at 28 days, the upper range being almost double the mean rate of readmission. The relative risk data again indicate that this variability is not due to the case mix. However, the figures give little insight into the reasons for readmission, and there are calls for further work to disaggregate surgical and medical reasons for readmission to understand more fully whether they could be reduced.22 Previous research suggests that early readmission after FNOF surgery is largely due to medical causes, and is associated with higher mortality rates at 1 year.23
There is a very strong economic argument for adopting enhanced recovery pathways for FNOF patients, as top-performing trusts utilise their resources and capacity better than poorer performers. FNOF patients are reported to occupy 20%–25% of hospital beds and make up half of all hospital days for all fractures.24 By reducing bed occupancy, both financial and resource pressures will be eased.25
While a strength of our study is the use of HES data, a potential weakness is the quality of the data coding. However, systematic reviews have found acceptable coding accuracy rates within HES data, with the quality of data improving in recent years.26,27 It is nevertheless possible that there may be inter-hospital coding variability.18 There may also be inaccuracies in the risk adjustment models used in HES data, although the covariates used have produced regression models with a discriminatory power comparable to those using clinical databases. It is therefore likely that the case mix-adjustment used here reflects a real difference in the quality of care, rather than simply inadequate adjustment.18 A further limitation is that our analysis uses aggregated data. The next step would be to analyse the raw data, and produce regression models to examine the different outcomes. However, this would depend on gaining access to unsuppressed Health and Social Care Information Centre data, and on its validity and accuracy.
Conclusions
FNOF is the most frequent emergency surgical pathway seen in most English hospitals. There is considerable variation in LOS between trusts, with case-mixed adjusted data suggesting that this is due to differences in practice rather than the nature of the patients treated. There is significant scope for considerable improvements in the quality and efficiency of care in our hospitals, and we propose that this could be best achieved if clinicians experienced in enhanced recovery focused on FNOF pathways.
References
- 1.Royal College of Physicians National Hip Fracture Database annual report 2014. London: Royal College of Physicians, 2014. [Google Scholar]
- 2.Leal J, Gray AM, Prieto-Alhambra D et al. Impact of hip fracture on hospital care costs: a population-based study. Osteoporos Int 2016; : 549–558. [DOI] [PMC free article] [PubMed] [Google Scholar]
- 3.NHS Institute for Innovation and Improvement Delivering Quality and Value. Focus on: Fractured Neck of Femur. London: Department of Health, 2006. [Google Scholar]
- 4.British Orthopaedic Association The Care of Patients with Fragility Fracture. London: British Orthopaedic Association, 2007. [Google Scholar]
- 5.Johansen A, Neuberger J, Boulton C et al. Using the National Hip Fracture Database (NHFD) to Profile the Impact of Hip Fracture on the NHS. Presented at: British Geriatrics Society 2014 Spring Meeting; 23-25 April 2014; Manchester. [Google Scholar]
- 6.Uzoigwe CE, Burnand HG, Cheesman CL et al. Early and ultra-early surgery in hip fracture patients improves survival. Injury 2013; : 726–729. [DOI] [PubMed] [Google Scholar]
- 7.Kehlet H, Wilmore DW. Evidence-based surgical care and the evolution of fast-track surgery. Ann Surg 2008; : 189–198. [DOI] [PubMed] [Google Scholar]
- 8.Gustafsson UO, Scott MJ, Schwenk W et al. Guidelines for perioperative care in elective colonic surgery: Enhanced Recovery After Surgery (ERAS(®)) Society recommendations. World J Surg 2013; : 259–284. [DOI] [PubMed] [Google Scholar]
- 9.Husted H. Fast-track hip and knee arthroplasty: clinical and organizational aspects. Acta Orthop Suppl 2012; : 1–39. [DOI] [PubMed] [Google Scholar]
- 10.Winther SB, Foss OA, Wik TS et al. 1-year follow-up of 920 hip and knee arthroplasty patients after implementing fast-track. Acta Orthopaedica 2015; : 78–85. [DOI] [PMC free article] [PubMed] [Google Scholar]
- 11.Starks I, Wainwright TW, Lewis J et al. Older patients have the most to gain from orthopaedic enhanced recovery programmes. Age Ageing 2014; : 642–648. [DOI] [PubMed] [Google Scholar]
- 12.Rasmussen S, Kristensen BB, Foldager S et al. [Accelerated recovery program after hip fracture surgery]. Ugeskr Laeger 2002; : 29–33. [PubMed] [Google Scholar]
- 13.Pedersen SJ, Borgbjerg FM, Schousboe B et al. A comprehensive hip fracture program reduces complication rates and mortality. J Am Geriatr Soc 2008; : 1,831–1,838. [DOI] [PubMed] [Google Scholar]
- 14.Egerod I, Rud K, Specht K et al. Room for improvement in the treatment of hip fractures in Denmark. Dan Med Bull 2010; : A4199. [PubMed] [Google Scholar]
- 15.Creditor MC. Hazards of Hospitalization of the Elderly. Ann Intern Med 1993; : 219–223. [DOI] [PubMed] [Google Scholar]
- 16.Siu AL, Penrod JD, Boockvar KS et al. Early ambulation after hip fracture: effects on function and mortality. Arch Intern Med 2006; : 766–771. [DOI] [PMC free article] [PubMed] [Google Scholar]
- 17.Holt PJ, Sinha S, Ozdemir BA et al. Variations and inter-relationship in outcome from emergency admissions in England: a retrospective analysis of Hospital Episode Statistics from 2005-2010. BMC Health Serv Res 2014; : 270. [DOI] [PMC free article] [PubMed] [Google Scholar]
- 18.Sprowson A, McNamara I, Manktelow A. v) Enhanced recovery pathway in hip and knee arthroplasty: “fast track” rehabilitation. Orthop Trauma 2013; : 296–302. [Google Scholar]
- 19.Al-Maqbali MA. Nursing intervention in discharge planning for elderly patients with hip fractures. International J Orthop Trauma Nurs 2014; : 68–80. [Google Scholar]
- 20.Gupta A. The effectiveness of geriatrician-led comprehensive hip fracture collaborative care in a new acute hip unit based in a general hospital setting in the UK. J R Coll Physicians Edinb 2014; : 20–26. [DOI] [PubMed] [Google Scholar]
- 21.Chesters A, Atkinson P. Fascia iliaca block for pain relief from proximal femoral fracture in the emergency department: a review of the literature. Emerg Med J 2014; : e84–7. [DOI] [PubMed] [Google Scholar]
- 22.Kehlet H. Enhanced Recovery After Surgery (ERAS): good for now, but what about the future. Can J Anaesth 2015; : 99–104. [DOI] [PubMed] [Google Scholar]
- 23.Khan MA, Hossain FS, Dashti Z et al. Causes and predictors of early re-admission after surgery for a fracture of the hip. J Bone Joint Surg Br 2012; : 690–697. [DOI] [PubMed] [Google Scholar]
- 24.Khasraghi FA, Christmas C, Lee EJ et al. Effectiveness of a multidisciplinary team approach to hip fracture management. J Surg Orthop Adv 2005; : 27–31. [PubMed] [Google Scholar]
- 25.Van Herck P, Vanhaecht K, Deneckere S et al. Key interventions and outcomes in joint arthroplasty clinical pathways: a systematic review. J Eval Clin Pract 2010; : 39–49. [DOI] [PubMed] [Google Scholar]
- 26.Campbell SE, Campbell MK, Grimshaw JM et al. A systematic review of discharge coding accuracy. J Public Health Med 2001; : 205–211. [DOI] [PubMed] [Google Scholar]
- 27.Burns EM, Rigby E, Mamidanna R et al. Systematic review of discharge coding accuracy. J Public Health (Oxf) 2012; : 138–148. [DOI] [PMC free article] [PubMed] [Google Scholar]
- 28.Knowledge Base Dr Foster. https://da.drfoster.co.uk/kb/tool_frame.asp (cited June 2015).