Abstract Abstract
Pulmonary arterial hypertension (PAH) is a rare disease characterized by significant vascular remodeling. The obesity epidemic has produced great interest in the relationship between small visceral adipose tissue depots producing localized inflammatory conditions, which may link metabolism, innate immunity, and vascular remodeling. This study used novel micro computed tomography (microCT) three-dimensional modeling to investigate the degree of remodeling of the lung vasculature and differential proteomics to determine small visceral adipose dysfunction in rats with severe PAH. Sprague-Dawley rats were subjected to a subcutaneous injection of vascular endothelial growth factor receptor blocker (Sugen 5416) with subsequent hypoxia exposure for 3 weeks (SU/hyp). At 12 weeks after hypoxia, microCT analysis showed a decrease in the ratio of vascular to total tissue volume within the SU/hyp group (mean ± standard deviation: 0.27 ± 0.066; P = 0.02) with increased vascular separation (0.37 ± 0.062 mm; P = 0.02) when compared with the control (0.34 ± 0.084 and 0.30 ± 0.072 mm). Differential proteomics detected an up-regulation of complement protein 3 (C3; SU/hyp∶control ratio = 2.86) and the adipose tissue–specific fatty acid binding protein-4 (FABP4, 2.66) in the heart adipose of the SU/hyp. Significant remodeling of the lung vasculature validates the efficacy of the SU/hyp rat for modeling human PAH. The upregulation of C3 and FABP4 within the heart adipose implicates small visceral adipose dysfunction. C3 has been associated with vascular stiffness, and FABP4 suppresses peroxisome proliferator–activated receptor, which is a major regulator of adipose function and known to be downregulated in PAH. These findings reveal that small visceral adipose tissue within the SU/hyp model provides mechanistic links for vascular remodeling and adipose dysfunction in the pathophysiology of PAH.
Keywords: pulmonary arterial hypertension, Sugen-hypoxic, microCT, adipose proteomics
Pulmonary arterial hypertension (PAH) is a rare disease characterized by ever-increasing pulmonary vascular resistance caused by significant vascular remodeling within each layer of the vascular wall.1-4 Although the classic indicators of PAH progression are well recognized, the initiating factors involved in the pathogenesis of PAH are not well understood. The structural remodeling of the pulmonary artery vascular wall that occurs in PAH is now considered a vasculopathy,3 and emerging evidence suggests that chronic inflammation plays an important part.5,6 The role of chronic inflammation in cardiovascular disease is well established,7-9 and we have found complement proteins 3 and 4 (C3 and C4) bound to the collagen and elastin of the vascular wall and throughout the surrounding perivascular adipose tissue (PVAT) in mouse models of atherosclerosis.10 Increasing complement deposition was associated with vascular stiffness,11 and this same mechanism involving complement proteins may play a role in the development of vascular remodeling and stiffness associated with the pathogenesis of PAH.
Adipose tissue is a potential source for both complement proteins and factors that are implicated in the pathophysiology of PAH, such as peroxisome proliferator–activated receptor γ (PPARγ).12 With the sustained obesity epidemic, cellular and metabolic links between adipose tissue, the innate immune system, and vascular remodeling are being established.13-15 This may be particularly relevant in PAH given the propensity for higher body mass index in contemporary populations with this disease.16 Increased adiposity due to volumetric expansion leads to the creation of a hypoxic environment, which leads to adipose tissue hypertrophy and an inflammatory response.17 Small visceral adipose depots that surround the coronary arteries and other vasculature (e.g., aorta) are of particular interest given their proximity to the vascular walls and the potential to produce a localized, acute inflammatory environment, which may contribute to vascular remodeling.18-22
We chose to use a rat model of PAH, which utilizes a subcutaneous injection of vascular endothelial growth factor receptor blocker (Sugen 5416) with subsequent exposure to hypoxic conditions (SU/hyp) to study the relationship between small visceral adipose tissue depots and the development of vascular remodeling.23-26 We characterized the three-dimensional (3-D) remodeling of the lung vasculature using micro computed tomography (microCT) and established links between heart adipose dysfunction and the innate immune system using differential adipose tissue proteomics.27
Methods
Animals
All experimental procedures were approved by the institutional animal care and use committee. Adult male Sprague-Dawley rats weighing 180–200 g (n = 11) were subcutaneously injected with Sugen 5416 (20 mg/kg) and subsequently exposed to hypoxic conditions (10% O2) for 3 weeks followed by normoxic conditions (21% O2) for 12 weeks.23 Control rats (n = 11) with no injection or hypoxic exposure were housed for the same length of time.
Ultrasound echocardiographic assessment of right ventricular wall thickness
The rats were lightly anesthetized with isofluroane in 100% O2, and in vivo transthoracic echocardiography of the right ventricular wall using an 11–24 MHz RMV scanhead (RMV 716) interfaced with a VEVO 770 (VisualSonics, Toronto, Canada) was used to obtain M mode images to measure right ventricular (RV) and left ventricular (LV) wall and septum (S) thickness, obtaining ratios for RV/LV or RV/(LV+S).28
Tissue samples
At the end of the ultrasound, blood samples were collected, and rats were administered a sublethal dose of ketamine. The abdominal cavity was opened, the diaphragm was incised to expose the pleural cavity, and the ribs were cut away to access the heart. An incision was made in the right ventricle, and polyethylene tubing (Tygon, 1.78-mm outside diameter) was inserted into the pulmonary artery and ligated. The circulatory system was flushed with 10 mL of heparinized saline using a syringe pump (Harvard Apparatus, PHD 2000). The left pulmonary artery was exposed and ligated. Immediately, the right lung was perfused with 10 mL of radio-opaque silicone rubber polymer (Microfil, MW-122, yellow, Flow-Tech) for contrast enhancement during the microCT analysis at a constant rate of 2 mL per minute. The Microfil was allowed to polymerize for 24 hours at 4°C. Right lungs were then fixed in 10% neutral buffered formalin for a minimum of 48 hours before microCT scanning. The left pulmonary artery was then transected, and a 10-mL syringe was inserted into the left pulmonary artery to perfuse the left lung with optimum cutting temperature freezing medium (Tissue-Tek, NewcomerSupply, Middleton, WI). The lung was transversely sectioned to create a proximal and distal half, cryopreserved by snap freezing in liquid nitrogen, and stored at −80°C.
MicroCT
Each of the 4 lobes of the right lungs was individually imaged with microCT using a Skyscan 1172 (Bruker-Skyscan, Contich, Belgium) system with a 9.97-µm voxel size and the following conditions: 55 kVp, 181 uA, 240-ms exposure, rotation step 0.250 degrees, frame averaging 10, with a 360° angular range. The 3-D volumes of the lungs were reconstructed from the raw files using NRECON (Skyscan Bruker) with a 40% beam-hardening correction.
The imaged lobes were processed and analyzed separately (lobes proximal to distal: superior, middle, inferior, and accessory). Using CTAn software (Bruker-Skyscan), a region of interest tracing the contour of each lung lobe with an exclusion of a uniform 750-µm edge to eliminate edge defects was generated by interpolation of similar user-defined regions of interest on each lobe slice. Individual lobe regions of interest were then processed as separate data sets. The threshold was set at a grayscale value that was 25% lower than the one corresponding to the peak of the perfused pulmonary artery density distribution.
For the postscan analysis of the imaged lung volumes, we used direct 3-D measurements that have been well documented in characterizing bone microarchitecture.27,29 In addition to the commonly used volume fraction, thickness, and spacing measurements, we used another tool—3-D artery lumen diameter maps—that provided the opportunity to study the organization of vasculature in space. Each new data set was processed for 3-D lumen diameter maps using SCANCO software (SCANCO Medical, Brüttisellen, Switzerland), using the same segmentation.
Adipose proteomics
Sample preparation
SU/hyp and control heart adipose samples were washed with phosphate-buffered saline, and the proteins were extracted using two-dimensional (2-D) lysis buffer and cleaned up using GE healthcare 2-D Quant kit and redissolved into 2-D gel rehydration buffer with 50 mM Tris pH8.0. The protein concentrations were evaluated using Bradford method and adjusted to 1 µg/µL. Then 1 µL of Cy2, Cy3, or Cy5 was added to 50 µg of proteins in each sample (Cy2 for mixed standard, Cy3 for control, Cy5 for hypoxia or vice versa for technical reproducibility purposes) and incubated on ice for 30 minutes in the dark. Then 1 µL of 10 mM lysine was used to quench the reaction by incubating on ice for 10 minutes in the dark. Two-dimensional differential gel electrophoresis (DiGE) was performed for individual comparison and technical reproducibility and was mixed in the pool of each group for data statistics.
Isoelectric focusing (IEF) and sodium dodecyl sulfate (SDS) gel
IEF and SDS gel electrophoresis were performed as described elsewhere.30 Briefly, 15 µg of each labeled sample was mixed together and diluted further in rehydration buffer to 450 µL for 24-cm strip pH3-10NL. Then 2% dithiothreitol (DTT), 0.5% IPG buffer, and 0.002% bromophenol blue were added before rehydration at room temperature for 8 hours. Rehydrated strips were loaded on Ettan IPGphor 3 IEF system overnight for 60,000 volt-hours and equilibrated with 1% DTT followed by 2.5% iodoacetamide for 15 minutes each and separated in 13.5% SDS gel.
Image acquisition and data analysis
The gels were scanned using a Typhoon 9400 scanner. The pictures were edited using ImageQuant TL 7.0 software, and differential in-gel analysis and biological variation analysis of the 2-D DiGE results were performed using DeCyder 2-D 7.0 Software.
Protein identification by mass spectrometry
Protein identification was performed as described elsewhere.31 Briefly, protein spots of interest from 2-D gel were excised, reduced by DTT, and alkylated with iodoacetamide, then digested with trypsin and desalted with C18 ZipTips (Millipore). Both mass spectrometry and tandem mass spectrometry analyses of the digested peptides were performed on a MALDI-TOF/TOF tandem MS (Bruker UltrafleXtreme MALDI TOF/TOF mass spectrometer, Bruker Daltonics, Billerica, MA). The database search and analysis were performed using FlexAnalysis and BioTools software (Bruker Daltonics) against other Mammalia (other than primate and rodents) in the Swiss-Prot protein database using a local Mascot search engine.
Western blotting
For Western blotting detection, proteins were extracted from heart adipose using lysis buffer, and the protein concentrations were evaluated using Bradford method and adjusting protein concentration to 1 µg/µL. Twenty micrograms of protein from each individual were separated by 15% SDS–polyacrylamide gel electrophoresis and transferred onto nitrocellulose membrane. The membranes were blocked with 5% milk and probed with anti-C3 antibody (1∶2,000) and anti-FABP4 antibody (1∶3,000; Abcam, Cambridge, MA) and visualized with enhanced chemiluminescent substrate (PerkinElmer, Waltham, MA). Actin (Santa Cruz, CA) was used as loading control.
Comparative lung histology and immunofluorescence (IF) analysis
Using a cryostat (Leica CM3050, Nussloch, Germany), serial sections of the left lung were cut at −22°C and mounted on Superfrost Plus glass slides (VWR, 48311-703, West Chester, PA) and stored at −20°C until use. Slide preparation was performed as described elsewhere.10
Within the lung serial sections, Masson trichrome, Verhoeff Van Gieson, and Oil Red O (ORO; Newcomer Supply, Middleton, WI) were used to identify collagen and elastin along with lipid-laden tissue, respectively. Monoclonal C3 and C4 mouse antirat primary antibodies (Santa Cruz) and isotype control immunoglobulin G (IgG) 1 (BD Pharmingen) were used with fluorochrome-conjugated donkey antimouse secondary antibody Alexa Fluor 555 (Abcam) for IF analysis. Monoclonal FABP4 rabbit antirat primary antibody (Abcam) and isotype control IgG (Abcam) were used with goat antirabbit Alexa Fluor 555 (Invitrogen).
Statistical analysis
Normality was assessed using the Shapiro-Wilk test. Parametric covariates were expressed as mean and standard deviation, whereas nonparametric covariates were expressed as median and interquartile range (IQR; 25th–75th percentile). All between-group (SU/hyp vs. control) quantitative microCT parameters and US measures done in triplicate were assessed using a repeated-measures analysis of variance (Stata/IC 12.1, StatCorp, College Station, TX).
Results
Right ventricle hypertrophy within the SU/hyp
The right ventricular wall thickness of the SU/hyp (median [IQR]: 2.30 mm [1.9–2.9 mm]) was significantly greater when compared with the control group (1.24 mm [1.1–1.4 mm], P = 0.01), and the RV/LV ratio was significantly greater in the SU/hyp (0.880 [0.61–1.1]) when compared with the control group (0.405 [0.37–0.42], P = 0.011), both of which findings are indicative of the right ventricle hypertrophy that occurs in response to significant PAH.
MicroCT analysis of the lung vasculature shows inferior vasculature network within SU/hyp
We could visually determine the lung vasculature filling with Microfil during the perfusion of the contrast agent. We were able to verify a perfusion of the vasculature with Microfil by visually evaluating successive slices, finding vascular continuity down to 40 µm of each lung lobe (superior, middle, inferior, and accessory lobes) through postscan analysis (Fig. 1A, 1B).
Figure 1.
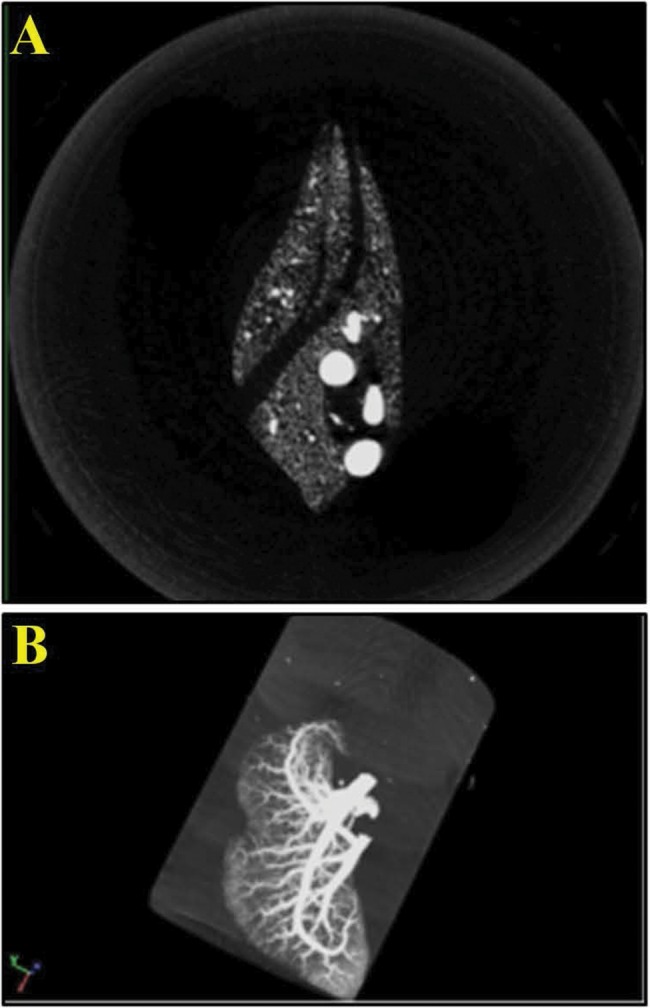
Micro computed tomography postscan analysis. A, Cross-section optimally thresholded. B, Maximum intensity projection of lung lobe, revealing complete perfusion of Microfil into the vasculature.
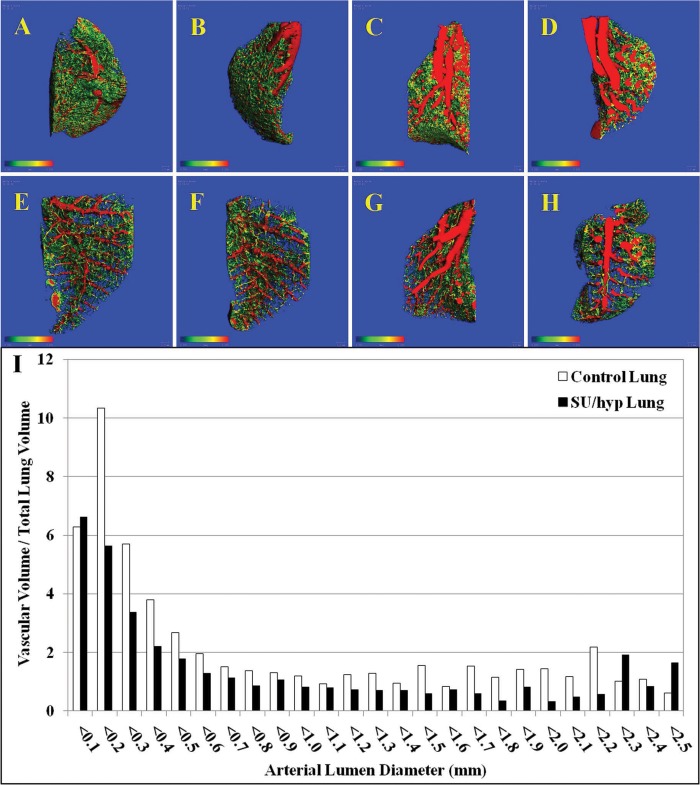
Topographic and quantitative analysis for artery lumen diameters less than 0.200 mm was used to capture the small-diameter vasculature, whereas the blue field captures the vascular separation (Fig. 2A–2H). Qualitatively, the control lungs appear to have greater vascular density with many more small-gauged blood vessels when compared with the SU/hyp lungs.
Figure 2.
Three-dimensional lumen diameter maps of individual right lung lobes. A–D, Control superior, middle, inferior, and accessory lobes, respectively; E–H, SU/hyp superior, middle, inferior, and accessory lobes, respectively. I, Ratio of the total lung vascular volume to total lung volume for control and SU/hyp lungs as a function of arterial lumen diameter (scale bar range: 0.000–0.200 mm). SU/hyp: rat model of pulmonary arterial hypertension using a subcutaneous injection of vascular endothelial growth factor receptor blocker (Sugen 5416) with subsequent exposure to hypoxic conditions.
From the created 3-D lumen diameter maps, we obtained whole right lung values for the ratio of vascular volume to tissue volume (vascular density), connectivity density, vascular number, vascular lumen diameter, vascular separation, and the ratio of vascular surface area to vascular volume (Table 1). The vascular density was significantly greater in the control lung when compared with the SU/hyp lung (P = 0.02), whereas the separation between vessels was significantly less in the control lung when compared with the SU/hyp lung (P = 0.02), which is also evident on the 3-D maps (Fig. 2A–2H; Table 1). This is readily seen when evaluating the histogram, reflecting the ratio of lung vascular volume to total lung volume as a function of arterial lumen diameter. Increased small-diameter vascular volumes are more prevalent within control lungs, whereas there is an increase in large-diameter vascular volumes within the SU/hyp lungs, which is indicative of small-diameter vessel pruning (Fig. 2I).
Table 1.
Comparison of microCT three-dimensional morphometry parameter values from the right lungs of control and SU/hyp animals
| Covariate | Control | SU/hyp | P |
|---|---|---|---|
| Vascular volume/tissue volume | 0.34 (0.084) | 0.27 (0.066) | 0.02 |
| Connectivity density | 25 (17–48) | 27 (17–42) | 0.9 |
| Vascular number (arteries/mm) | 2.7 (2.4–3.0) | 2.6 (2.3–2.8) | 0.08 |
| Vascular luminal diameter (mm) | 0.49 (0.13) | 0.47 (0.13) | 0.32 |
| Vascular separation (mm) | 0.30 (0.072) | 0.37 (0.062) | 0.02 |
| Vascular surface area/vascular volume (mm2/mm3) | 12.8 (12–14) | 14.6 (13–16) | 0.07 |
Data are given as normality-dependent mean (± standard deviation) or median value (25th–75th percentile). Vascular volume/tissue volume indicates the relative volume of vasculature in lung. Connectivity density indicates the branching of vasculature, with a higher number signifying more vascular branching. Vascular number indicates the number of blood vessels that are not discontinued at any point. Vascular lumen diameter indicates blood vessel lumen diameter. Vascular separation indicates the distance between the centers of adjacent blood vessels. Vascular surface area/vascular volume indicates the relative surface area of the blood vessels related to total vascular volume. microCT: micro computed tomography; SU/hyp: rat model of pulmonary arterial hypertension using a subcutaneous injection of vascular endothelial growth factor receptor blocker (Sugen 5416) with subsequent exposure to hypoxic conditions.
The vascular number represents the number of distinct and continuous blood vessel structures within the 3-D lung volume, with a higher number reflecting limited vascular pruning. The results show a trend for a higher vascular number in the control lungs (P = 0.08). Additionally, a trend was detected for a greater ratio of vascular surface area to volume in the SU/hyp group versus the control group (P = 0.07), which would be indicative of large vessel diameters.
Differential heart adipose proteomics show an upregulation of C3 and FABP4 in the SU/hyp group
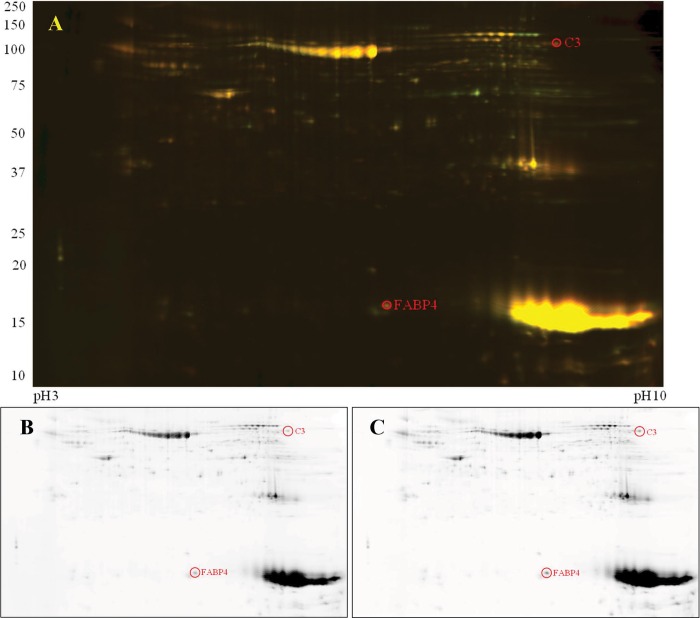
The heart adipose samples of both the SU/hyp and control groups were analyzed using differential in-gel analysis of the 2-D DiGE, through which we were able to identify 1,865 different proteins. Of those proteins, using a threshold factor of 2.0 (signal 2 times greater or less than) to determine statistically significant differences in protein expression, 1,844 (98.9%) were not significantly up- or downregulated. However, we were able to detect 16 (0.9% of the total protein number tested) significantly downregulated proteins and 5 (0.3%) significantly upregulated proteins (Fig. 3A).
Figure 3.
Two-dimensional differential gel electrophoresis of complement protein 3 (C3) and fatty acid binding protein-4 (FABP4) found in heart adipose tissue. A, Colocalized control (Cy3) versus SU/hyp (Cy5). B, Control only. C, SU/hyp only. SU/hyp: rat model of pulmonary arterial hypertension using a subcutaneous injection of vascular endothelial growth factor receptor blocker (Sugen 5416) with subsequent exposure to hypoxic conditions.
We spot picked the proteins that were significantly different (21 protein spots) and, using mass spectroscopy, were able to positively identify 2 proteins that related to our hypothesis regarding the involvement of the innate immune system (complement protein C3) and adipose dysfunction (FABP4). The heart adipose protein signals were upregulated in the SU/hyp for both C3 (SU/hyp∶control = 2.86) and FABP4 (SU/hyp∶control = 2.66), which can be qualitatively discerned in Figure 3B and 3C.
Western blot comparison confirms upregulation of C3 and FABP4 in heart adipose tissue in SU/hyp
The upregulation of proteins C3 and FABP4 were confirmed using a Western blot comparison of control and SU/hyp heart adipose tissue (Fig. 4). There is evidence of C3 in the adipose tissue of both the control and SU/hyp heart adipose tissue; however, there is a stronger signal within the SU/hyp animals (P = 0.02). Additionally, there is very little to no FABP4 found in the control heart adipose, but the signal is upregulated in the SU/hyp heart adipose (P = 0.006).
Figure 4.
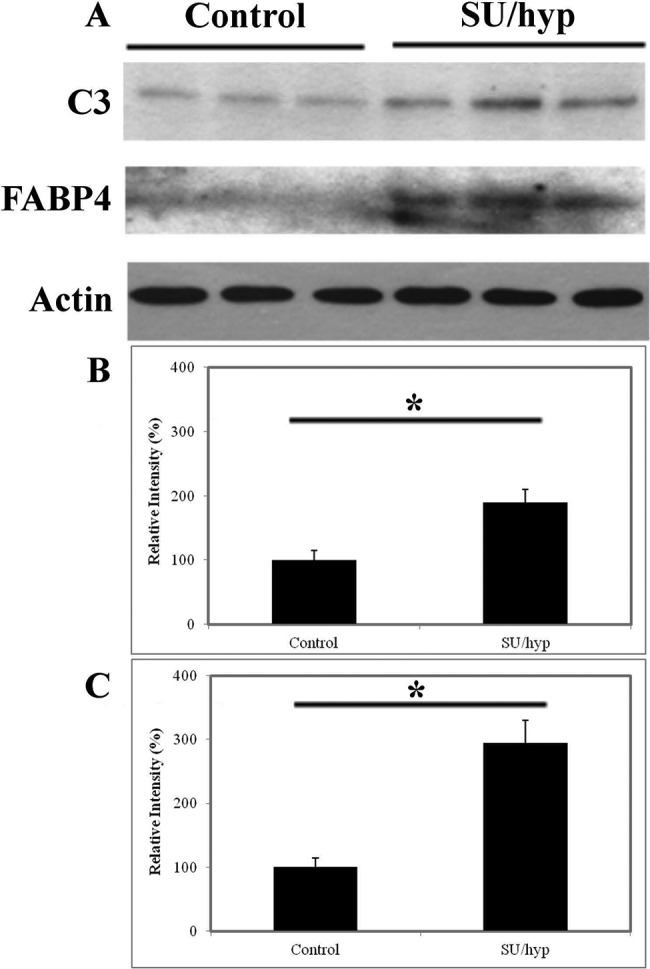
Western blot of heart adipose tissue. A, Complement protein 3 (C3) and fatty acid-binding protein-4 (FABP4) in control (n = 3) versus SU/hyp (n = 3). Percentage of total protein from Western blot for C3 (B; P = 0.02) and FABP4 (C; P = 0.006). Actin was used as loading control. SU/hyp: rat model of pulmonary arterial hypertension using a subcutaneous injection of vascular endothelial growth factor receptor blocker (Sugen 5416) with subsequent exposure to hypoxic conditions. Asterisk indicates a statistically significant difference.
Comparative lung histological and IF analysis reveals colocalization of lipid-laden cells and C3/C4 along with extensive FABP4 deposition
An intense lipid staining in close proximity to the lung vasculature was observed in both control and SU/hyp lungs using ORO-stained lung sections (Fig. 5). The ORO pattern for both groups was localized around the lung vasculature and asymmetric, which suggests the existence of lipid-laden cells within the lung and shows their irregular accumulation in proximity to the lung vasculature.
Figure 5.
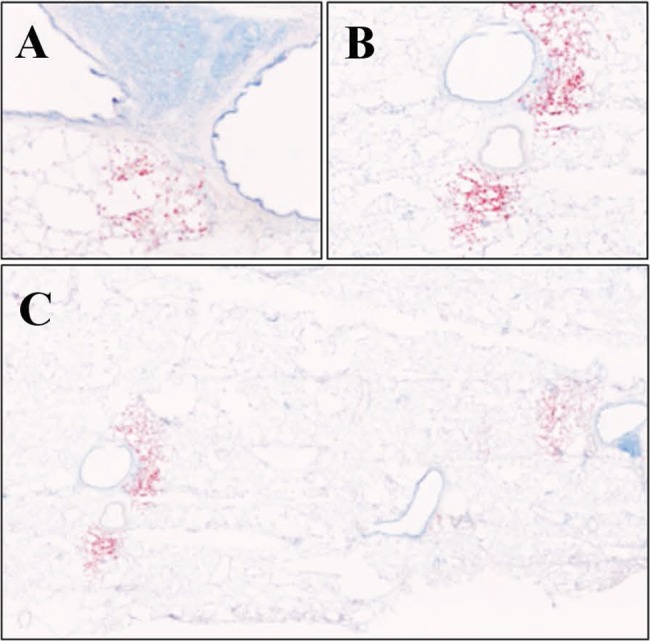
Lipid staining using Oil Red O of left lung in control lung (A; original magnification ×10) and SU/hyp lung at original magnification ×10 (B) and stitched ×10 (C). SU/hyp: rat model of pulmonary arterial hypertension using a subcutaneous injection of vascular endothelial growth factor receptor blocker (Sugen 5416) with subsequent exposure to hypoxic conditions.
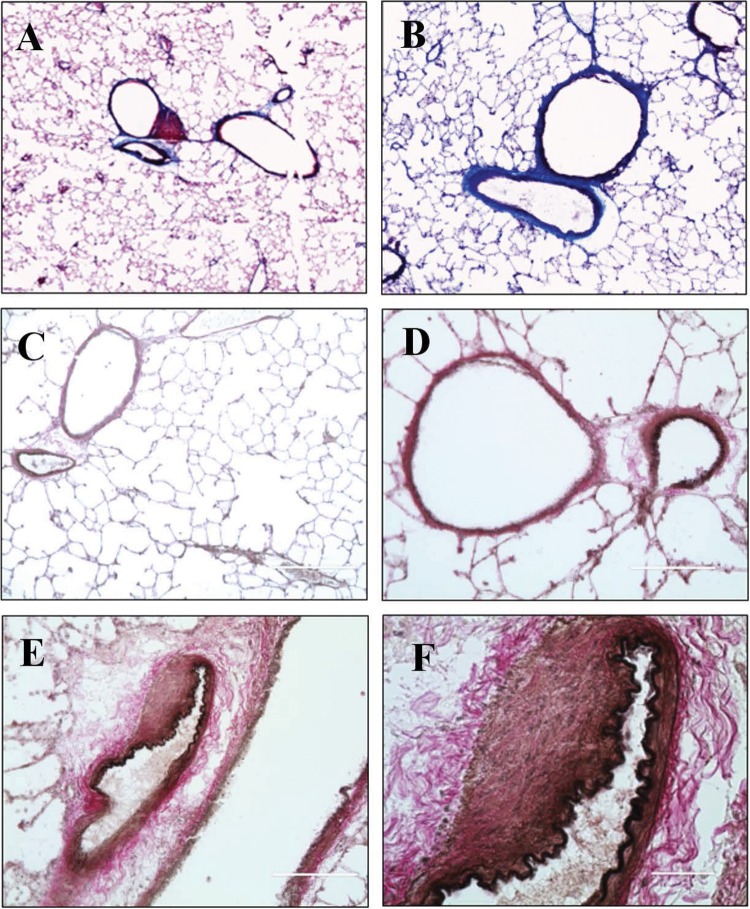
The collagen deposition and elastin content of the lung and lung vasculature were assessed using Masson trichrome and Verhoeff Van Gieson staining. Collagen was only detected in the control lung within the well-defined walls of the lung vasculature. The elastin of the thin vascular walls within the control lung was well delineated (Fig. 6A, 6C, 6D). In contrast, the SU/hyp lung had extensive collagen deposition within the lung (Fig. 6B) and ambiguous vascular wall boundaries with loosely arranged collagen and much separated elastin (Fig. 6B, 6E, 6F).
Figure 6.
Staining left lung tissue for evidence of vascular remodeling using Masson trichrome. A, Control lung, original magnification ×10. B, SU/hyp lung, original magnification ×10; collagen, cytoplasm. Staining with Verhoeff Van Gieson in control lung, original magnification ×10 (C) and ×20 (D), and in SU/hyp lung, original magnification ×20 (E) and ×60 (F); collagen, elastin. SU/hyp: rat model of pulmonary arterial hypertension using a subcutaneous injection of vascular endothelial growth factor receptor blocker (Sugen 5416) with subsequent exposure to hypoxic conditions.
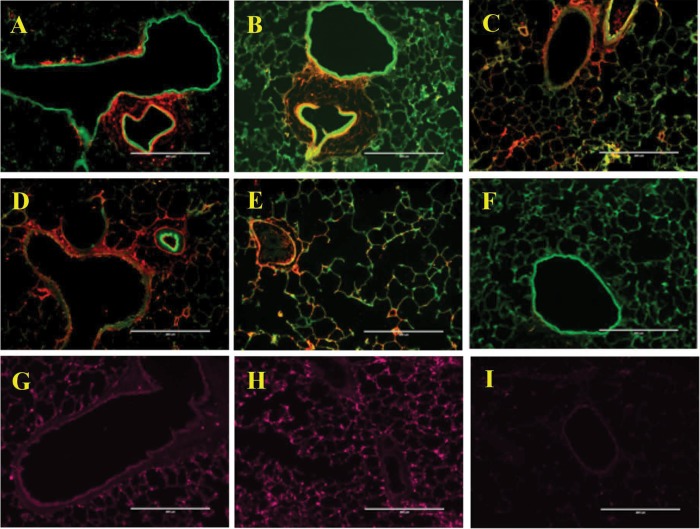
Complement C3 and C4 were detected in both the control and SU/hyp lung tissue using IF (Fig. 7A–7F). Both C3 and C4 were localized, surrounding lung vasculature, in the SU/hyp lungs (Fig. 7A–7C), whereas in the control lungs the complement was more diffuse (Fig. 7D, 7E). Additionally, IF was also used to detect FABP4 within the lung tissue and was found diffusely throughout both the SU/hyp and control lung tissue (Fig. 7G–7I).
Figure 7.
Immunofluorescence labeling of left lung tissue for evidence of complement protein 3 (C3), complement protein 4 (C4), and fatty acid binding protein-4 (FABP4). SU/hyp lung tissue labeled for C3 (A, B), C4 (C), and FABP4 (G). Control lung tissue labeled for C3 (D), C4 (E), and FABP4 (H). F, C3 and C4 immunoglobulin G (IgG) 1 isotype control; I, FABP IgG isotype control. C3/C4: red; autofluorescence: green; FABP4: purple. A, C–I, original magnification ×10; B, original magnification ×20.
Discussion
The results of this study are twofold. First, as reflected in the microCT lung characterization data, the SU/hyp rat model develops significant lung vascular remodeling, reminiscent of the vascular pruning described for the human lung affected by PAH.23,32,33 Second, the upregulation of C3 and FABP4 within the heart adipose implicates small visceral adipose dysfunction related to inflammation in the pathophysiology of this experimental animal model of PAH. The significance of this finding is high, considering that we had no a priori knowledge of the upregulated proteins in the heart adipose, and it readily supports our earlier work regarding complement and adipose dysfunction in cardiovascular disease and autoimmune diseases.10,11,34
The SU/hyp experimental model of PAH is recognized to be more representative of the human progression of PAH when compared with other experimental models, in part because of the development of humanlike plexiform lesions within the lung vasculature.23 MicroCT has previously been used both in vivo and ex vivo in the analysis of animal models of PAH;35-37 however, we are the first to use it for a quantitative evaluation of the lung vascular microarchitetcture, including the very-late-stage experimental SU/hyp rat model of PAH.
The microCT analysis was able to resolve small-diameter vasculature and detect a significant decrease in the vascular density and a respective significant increase in vascular separation when comparing the control lungs with the SU/hyp lungs. Additionally, we were able to determine that there was an overall loss of small-diameter blood vessels in the SU/hyp lungs, which supports the small-diameter vascular pruning process that is present in clinical PAH, marked by a loss of vascular density, an increased distance between vessels, and an increase in surface area of the vessels relative to their volume due to a decrease in small-diameter vessels. This quantitative and qualitative microCT analysis supports the efficacy of the model for mimicking PAH.
The innate immune system, and in particular the complement cascade, are becoming increasingly linked with the various systems, including the cardiovascular and metabolic systems. Previous findings have shown a potential pathological role of complement proteins when bound to vascular wall ultrastructure, resulting in increased vascular stiffness in both humans and animal models.10,11,38 At the same time, the absence of certain complement proteins may be beneficial to humans in the context of vascular stiffness and in the case of a mouse model of PAH.39,40 Using chronic hypoxia to induce pulmonary hypertension, Bauer et al.40 found that vascular remodeling in peripheral arterioles was attenuated in the C3 double knock-out mouse strain (C3−/−) when compared with normoxic or hypoxic wild-type mice. We found complement protein C3 upregulated in the heart adipose tissue of the SU/hyp, indicative of an inflammatory response, which may also target the vascular wall structural proteins.
PPARγ, which is known to be downregulated in PAH, is a major regulator of adipocyte differentiation and adipogenesis and promotes lipid efflux.41-46 A hypoxic adipose tissue environment is created by the rapid expansion of adipose tissue or hypertrophy and is exacerbated by a decrease in angiogenesis, ultimately leading to adipose fibrosis and a decrease in PPARγ levels. In hypoxic regimens attempting to mimic PAH, PPARγ expression and activity are attenuated through several pathways (ERK1/2, p65, and Nox4 dependent).47 Another potential mechanism for PPARγ down-regulation is inherent in adipose dysfunction and related to FABP4.
FABP4 is highly expressed in adipocytes and macrophages, acts as a fatty acids chaperone, and has been associated with insulin resistance, but it is also induced by PPARγ.48-52 Garin-Shkolnik et al.52 hypothesized that the necessary but opposing actions of these two proteins may be due to excessive lipid accumulation increasing FABP4, which then compromises PPARγ activities. We found FABP4 upregulated in our SU/hyp heart adipose tissue, which may be due to the combination of hypoxic conditions created in our model and a downregulation of PPARγ indicative of adipose dysfunction. Disruption of the FAB4-PPARγ axis within small visceral adipose depots due to hypoxic conditions created from excessive lipid accumulation may exacerbate inflammation. Not only is there a lack of fascial boundary between the heart adipose and the coronary arteries, but there is also no separation between the heart adipose and the heart muscle tissue. Heart adipose dysfunction may not only locally affect the vascular remodeling of coronary arteries or have a paracrine effect on the lung vasculature but may also diminish ventricular function.53 Additional experiments evaluating the small visceral adipose depots in various vascular beds, including adipose surrounding the pulmonary artery, will aid in determining a localized versus a systemic inflammatory contribution to vascular remodeling and the progression of PAH.
Within the actual lung tissue, we found lipid-laden cells surrounding the lung vasculature in both the SU/hyp and control lungs colocalized with positive labeling for complement proteins C3 and C4. This is consistent with our earlier findings of C3 and C4 throughout the aorta PVAT in our mouse model of athero-lesion formation and suggests that the small lipid-laden cells may be a source of C3 and C4.10 The relatively small areas of lipid-laden positive cells surrounding the vasculature within the lung tissue need further characterization.54,55 We also detected extensive FABP4 labeling throughout both SU/hyp and control lung tissue not colocalized with the lipid-laden cells. FABP4 can also be produced by macrophages, which are readily abundant in both healthy lung tissue (alveolar spaces) and severe PAH–associated lung tissue (pulmonary lesions).56,57 These IF findings within the control and SU/hyp lung tissue suggest that there is an acceptable amount of inflammation necessary for lung tissue homeostasis, just as we have seen with heart adipose.10
Conclusions
We have shown supportive evidence of the extensive lung vasculature remodeling found in the very-late-stage SU/hyp rat model of PAH using quantitative microCT analysis. We have supported the hypothesis of small visceral adipose depots potentially contributing to the pathogenesis of PAH by implicating innate immune system complement proteins and adipose-specific FABP4 influence over PPARγ.
Source of Support: Actelion Pharmaceuticals, Entelligence Young Investigator Award.
Conflict of Interest: None declared.
References
- 1.Tuder RM, Abman SH, Braun T, Capron F, Stevens T, Thistlethwaite PA, Haworth SG. Development and pathology of pulmonary hypertension. J Am Coll Cardiol 2009;54(1 suppl):S3–S9. [DOI] [PubMed]
- 2.Rabinovitch M. Pathobiology of pulmonary hypertension. Annu Rev Pathol 2007;2:369–399. [DOI] [PubMed]
- 3.Chang SY, Chen YW, Zhao XP, et al. Catalase prevents maternal diabetes-induced perinatal programming via the Nrf2-HO-1 defense system. Diabetes 2012;61:2565–2574. [DOI] [PMC free article] [PubMed]
- 4.Hassoun HT, Lie ML, Grigoryev DN, Liu M, Tuder RM, Rabb H. Kidney ischemia-reperfusion injury induces caspase-dependent pulmonary apoptosis. Am J Physiol Ren Physiol 2009;297(1):F125–F137. [DOI] [PMC free article] [PubMed]
- 5.Mehraein-Ghomi F, Lee E, Church DR, Thompson TA, Basu HS, Wilding G. JunD mediates androgen-induced oxidative stress in androgen dependent LNCaP human prostate cancer cells. Prostate 2008;68(9):924–934. [DOI] [PubMed]
- 6.Hassoun PM, Mouthon L, Barbera JA, Eddahibi S, Flores SC, Grimminger F, Jones PL, et al. Inflammation, growth factors, and pulmonary vascular remodeling. J Am Coll Cardiol 2009;54(1 suppl):S10–S19. [DOI] [PubMed]
- 7.Ross R. Atherosclerosis: an inflammatory disease. N Engl J Med 1999;340(2):115–126. [DOI] [PubMed]
- 8.Amarasekera SS, van Dalen J, Thompson TJ, Osman M. Pulmonary embolism after acromioplasty and rotator cuff repair. J Shoulder Elbow Surg 2008;17(5):e13–e14. [DOI] [PubMed]
- 9.Hansson GK, Jonasson L, Seifert PS, Stemme S. Immune mechanisms in atherosclerosis. Arteriosclerosis 1989;9(5):567–578. [DOI] [PubMed]
- 10.Shields KJ, Stolz D, Watkins SC, Ahearn JM. Complement proteins C3 and C4 bind to collagen and elastin in the vascular wall: a potential role in vascular stiffness and atherosclerosis. Clin Transl Sci 2011;4(3):146–152. [DOI] [PMC free article] [PubMed]
- 11.Santelices LC, Rutman SJ, Prantil-Baun R, Vorp DA, Ahearn JM. Relative contributions of age and atherosclerosis to vascular stiffness. Clin Transl Sci 2008;1(1):62–66. [DOI] [PMC free article] [PubMed]
- 12.Hamblin M, Chang L, Fan Y, Zhang J, Chen YE. PPARs and the cardiovascular system. Antioxid Redox Signal 2009;11(6):1415–1452. [DOI] [PMC free article] [PubMed]
- 13.Phieler J, Chung KJ, Chatzigeorgiou A, Klotzsche-von Ameln A, Garcia-Martin R, Sprott D, Moisidou M, et al. The complement anaphylatoxin C5a receptor contributes to obese adipose tissue inflammation and insulin resistance. J Immunol 2013;191(8):4367–4374. [DOI] [PMC free article] [PubMed]
- 14.Villacorta L, Chang L. The role of perivascular adipose tissue in vasoconstriction, arterial stiffness, and aneurysm. Horm Mol Biol Clin Investig 2015;21(2):137–147. [DOI] [PMC free article] [PubMed]
- 15.Jia G, Aroor AR, DeMarco VG, Martinez-Lemus LA, Meininger GA, Sowers JR. Vascular stiffness in insulin resistance and obesity. Front Physiol 2015;6:231. [DOI] [PMC free article] [PubMed]
- 16.Frost AE, Badesch DB, Barst RJ, Benza RL, Elliott CG, Farber HW, Krichman A, et al. The changing picture of patients with pulmonary arterial hypertension in the United States: how REVEAL differs from historic and non-US contemporary registries. Chest 2011;139(1):128–137. [DOI] [PubMed]
- 17.Trayhurn P. Endocrine and signalling role of adipose tissue: new perspectives on fat. Acta Physiol Scand 2005;184(4):285–293. [DOI] [PubMed]
- 18.Kaushik M, Reddy YM. Distinction of “fat around the heart.” J Am Coll Cardiol 2011;58(15):1640; author reply 1640–1641. [DOI] [PubMed]
- 19.Iacobellis G, Assael F, Ribando MC, Zappaterreno A, Alessi G, Di Mario U, Leonetti F. Epicardial fat from echocardiography: a new method for visceral adipose tissue prediction. Obes Res 2003;11(2):304–310. [DOI] [PubMed]
- 20.Iacobellis G, Bianco AC. Epicardial adipose tissue: emerging physiological, pathophysiological and clinical features. Trends Endocrinol Metab 2011;22:450–457. [DOI] [PMC free article] [PubMed]
- 21.Rosito GA, Massaro JM, Hoffmann U, Ruberg FL, Mahabadi AA, Vasan RS, O'Donnell CJ, Fox CS. Pericardial fat, visceral abdominal fat, cardiovascular disease risk factors, and vascular calcification in a community-based sample: the Framingham heart study. Circulation 2008;117(5):605–613. [DOI] [PubMed]
- 22.Baker AR, Silva NF, Quinn DW, Harte AL, Pagano D, Bonser RS, Kumar S, McTernan PG. Human epicardial adipose tissue expresses a pathogenic profile of adipocytokines in patients with cardiovascular disease. Cardiovasc Diabetol 2006;5:1. [DOI] [PMC free article] [PubMed]
- 23.Abe K, Toba M, Alzoubi A, Ito M, Fagan KA, Cool CD, Voelkel NF, McMurtry IF, Oka M. Formation of plexiform lesions in experimental severe pulmonary arterial hypertension. Circulation 2010;121(25):2747–2754. [DOI] [PubMed]
- 24.Pisetsky DS, Ullal AJ, Gauley J, Ning TC. Microparticles as mediators and biomarkers of rheumatic disease. Rheumatology (Oxford) 2012;51:1737–1746. [DOI] [PMC free article] [PubMed]
- 25.Yang G, Timme TL, Naruishi K, Fujita T, Fattah el MA, Cao G, Rajagopalan K, Troung LD, Thompson TC. Mice with cav-1 gene disruption have benign stromal lesions and compromised epithelial differentiation. Exp Mol Pathol 2008;84(2):131–140. [DOI] [PubMed]
- 26.Ramirez PJ, Vickers SM, Ono HA, Davydova J, Takayama K, Thompson TC, Curiel DT, Bland KI, Yamamoto M. Optimization of conditionally replicative adenovirus for pancreatic cancer and its evaluation in an orthotopic murine xenograft model. Am J Surg 2008;195(4):481–490. [DOI] [PubMed]
- 27.Zagorchev L, Oses P, Zhuang ZW, Moodie K, Mulligan-Kehoe MJ, Simons M, Couffinhal T. Micro computed tomography for vascular exploration. J Angiogenes Res 2010;2:7. [DOI] [PMC free article] [PubMed]
- 28.Coatney RW. Ultrasound imaging: principles and applications in rodent research. ILAR J 2001;42(3):233–247. [DOI] [PubMed]
- 29.Bouxsein ML, Boyd SK, Christiansen BA, Guldberg RE, Jepsen KJ, Muller R. Guidelines for assessment of bone microstructure in rodents using micro-computed tomography. J Bone Miner Res 2010;25(7):1468–1486. [DOI] [PubMed]
- 30.Wu C, Wang Z, Zourelias L, Thakker H, Passineau MJ. IL-17 sequestration via salivary gland gene therapy in a mouse model of Sjogren’s syndrome suppresses disease-associated expression of the putative autoantigen Klk1b22. Arthritis Res Ther 2015;17:198. [DOI] [PMC free article] [PubMed]
- 31.Chen CL, Chung T, Wu CC, Ng KF, Yu JS, Tsai CH, Chang YS, Liang Y, Tsui KH, Chen YT. Comparative tissue proteomics of microdissected specimens reveals novel candidate biomarkers of bladder cancer. Mol Cell Proteomics 2015;14(9):2466–2478. [DOI] [PMC free article] [PubMed]
- 32.Rabinovitch M, Chesler N, Molthen RC. Point:counterpoint: chronic hypoxia-induced pulmonary hypertension does/does not lead to loss of pulmonary vasculature. J Appl Physiol (1985) 2007;103(4):1449–1451. [DOI] [PubMed]
- 33.Michelakis ED, Wilkins MR, Rabinovitch M. Emerging concepts and translational priorities in pulmonary arterial hypertension. Circulation 2008;118(14):1486–1495. [DOI] [PubMed]
- 34.Shields KJ, Barinas-Mitchell E, Gingo MR, et al. Perivascular adipose tissue of the descending thoracic aorta is associated with systemic lupus erythematosus and vascular calcification in women. Atherosclerosis 2013;231(1):129–135. [DOI] [PMC free article] [PubMed]
- 35.Shofer S, Badea C, Auerbach S, Schwartz DA, Johnson GA. A micro-computed tomography-based method for the measurement of pulmonary compliance in healthy and bleomycin-exposed mice. Exp Lung Res 2007;33:169–183. [DOI] [PMC free article] [PubMed]
- 36.Downey CM, Singla AK, Villemaire ML, Buie HR, Boyd SK, Jirik FR. Quantitative ex-vivo micro-computed tomographic imaging of blood vessels and necrotic regions within tumors. PLoS ONE 2012;7(7):e41685. [DOI] [PMC free article] [PubMed]
- 37.Vitali SH, Hansmann G, Rose C, Fernandez-Gonzalez A, Scheid A, Mitsialis SA, Kourembanas S. The Sugen 5416/hypoxia mouse model of pulmonary hypertension revisited: long-term follow-up. Pulm Circ 2014;4(4):619–629. [DOI] [PMC free article] [PubMed]
- 38.Selzer F, Sutton-Tyrrell K, Fitzgerald SG, Tracy RP, Kuller LH, Manzi S. Vascular stiffness in women with systemic lupus erythematosus. Hypertension 2001;37:1075–1082. [DOI] [PubMed]
- 39.Knoll F, Zitt E, Intemann D, Lhotta K. Juvenile elastic arteries after 28 years of renal replacement therapy in a patient with complete complement C4 deficiency. BMC Nephrol 2012;13:161. [DOI] [PMC free article] [PubMed]
- 40.Bauer EM, Zheng H, Comhair S, Erzurum S, Billiar TR, Bauer PM. Complement C3 deficiency attenuates chronic hypoxia-induced pulmonary hypertension in mice. PLoS ONE 2011;6(12):e28578. [DOI] [PMC free article] [PubMed]
- 41.Buechler C, Krautbauer S, Eisinger K. Adipose tissue fibrosis. World J Diabetes 2015;6(4):548–553. [DOI] [PMC free article] [PubMed]
- 42.Michailidou Z, Turban S, Miller E, Zou X, Schrader J, Ratcliffe PJ, Hadoke PW, et al. Increased angiogenesis protects against adipose hypoxia and fibrosis in metabolic disease-resistant 11beta-hydroxysteroid dehydrogenase type 1 (HSD1)–deficient mice. J Biol Chem 2012;287(6):4188–4197. [DOI] [PMC free article] [PubMed]
- 43.Rabinovitch M. PPARgamma and the pathobiology of pulmonary arterial hypertension. Adv Exp Med Biol 2010;661:447–458. [DOI] [PubMed]
- 44.Tontonoz P, Hu E, Spiegelman BM. Stimulation of adipogenesis in fibroblasts by PPAR gamma 2, a lipid-activated transcription factor. Cell 1994;79(7):1147–1156. [DOI] [PubMed]
- 45.Tontonoz P, Spiegelman BM. Fat and beyond: the diverse biology of PPARgamma. Annu Rev Biochem 2008;77:289–312. [DOI] [PubMed]
- 46.Chawla A, Boisvert WA, Lee CH, Laffitte BA, Barak Y, Joseph SB, Liao D, et al. A PPAR gamma-LXR-ABCA1 pathway in macrophages is involved in cholesterol efflux and atherogenesis. Mol Cell 2001;7(1):161–171. [DOI] [PubMed]
- 47.Lu X, Bijli KM, Ramirez A, Murphy TC, Kleinhenz J, Hart CM. Hypoxia downregulates PPARgamma via an ERK1/2-NF-kappaB-Nox4-dependent mechanism in human pulmonary artery smooth muscle cells. Free Radic Biol Med 2013;63:151–160. [DOI] [PMC free article] [PubMed]
- 48.Furuhashi M, Hotamisligil GS. Fatty acid-binding proteins: role in metabolic diseases and potential as drug targets. Nat Rev Drug Discov 2008;7(6):489–503. [DOI] [PMC free article] [PubMed]
- 49.Maeda K, Cao H, Kono K, et al. Adipocyte/macrophage fatty acid binding proteins control integrated metabolic responses in obesity and diabetes. Cell Metab 2005;1(2):107–119. [DOI] [PubMed]
- 50.Makowski L, Brittingham KC, Reynolds JM, Suttles J, Hotamisligil GS. The fatty acid-binding protein, aP2, coordinates macrophage cholesterol trafficking and inflammatory activity. Macrophage expression of aP2 impacts peroxisome proliferator–activated receptor gamma and IkappaB kinase activities. J Biol Chem 2005;280(13):12888–12895. [DOI] [PMC free article] [PubMed]
- 51.Furuhashi M, Fucho R, Gorgun CZ, Tuncman G, Cao H, Hotamisligil GS. Adipocyte/macrophage fatty acid-binding proteins contribute to metabolic deterioration through actions in both macrophages and adipocytes in mice. J Clin Invest 2008;118(7):2640–2650. [DOI] [PMC free article] [PubMed]
- 52.Garin-Shkolnik T, Rudich A, Hotamisligil GS, Rubinstein M. FABP4 attenuates PPARgamma and adipogenesis and is inversely correlated with PPARgamma in adipose tissues. Diabetes 2014;63(3):900–911. [DOI] [PubMed]
- 53.Wenger DS, Kawut SM, Ding J, Bluemke DA, Hough CL, Kronmal RA, Lima JA, Leary PJ. Pericardial fat and right ventricular morphology: the Multi-Ethnic Study of Atherosclerosis–Right Ventricle Study (MESA-RV). PLoS ONE 2016;11(6):e0157654. [DOI] [PMC free article] [PubMed]
- 54.Gibeon D, Zhu J, Sogbesan A, Banya W, Rossios C, Saito J, Rocha JP, et al. Lipid-laden bronchoalveolar macrophages in asthma and chronic cough. Respir Med 2014;108(1):71–77. [DOI] [PubMed]
- 55.Liu S, Parameswaran H, Young SM, Varisco BM. JNK suppresses pulmonary fibroblast elastogenesis during alveolar development. Respir Res 2014;15:34. [DOI] [PMC free article] [PubMed]
- 56.Furuhashi M, Fuseya T, Murata M, Hoshina K, Ishimura S, Mita T, Watanabe Y, et al. Local production of fatty acid-binding protein 4 in epicardial/perivascular fat and macrophages is linked to coronary atherosclerosis. Arterioscler Thromb Vasc Biol 2016;36(5):825–834. [DOI] [PubMed]
- 57.Gerasimovskaya E, Kratzer A, Sidiakova A, Salys J, Zamora M, Taraseviciene-Stewart L. Interplay of macrophages and T cells in the lung vasculature. Am J Physiol Lung Cell Mol Physiol 2012;302(10):L1014–L1022. [DOI] [PMC free article] [PubMed]


