

Abstract
The mechanisms driving pathological beta‐amyloid (Aβ) generation in late‐onset Alzheimer's disease (AD) are unclear. Two late‐onset AD risk factors, Bin1 and CD2AP, are regulators of endocytic trafficking, but it is unclear how their endocytic function regulates Aβ generation in neurons. We identify a novel neuron‐specific polarisation of Aβ generation controlled by Bin1 and CD2AP. We discover that Bin1 and CD2AP control Aβ generation in axonal and dendritic early endosomes, respectively. Both Bin1 loss of function and CD2AP loss of function raise Aβ generation by increasing APP and BACE1 convergence in early endosomes, however via distinct sorting events. When Bin1 levels are reduced, BACE1 is trapped in tubules of early endosomes and fails to recycle in axons. When CD2AP levels are reduced, APP is trapped at the limiting membrane of early endosomes and fails to be sorted for degradation in dendrites. Hence, Bin1 and CD2AP keep APP and BACE1 apart in early endosomes by distinct mechanisms in axon and dendrites. Individuals carrying variants of either factor would slowly accumulate Aβ in neurons increasing the risk for late‐onset AD.
Keywords: Alzheimer, endosomes, neuron, genetic risk factors
Subject Categories: Membrane & Intracellular Transport, Molecular Biology of Disease, Neuroscience
Introduction
Beta‐amyloid (Aβ), the Alzheimer's disease's (AD) established primary trigger 1, is produced normally by neurons. The amyloid precursor protein (APP) undergoes sequential cleavages by the rate limiting β‐secretase (BACE1) and γ‐secretase originating mainly Aβ40 and Aβ42 2, 3. Aβ42 is more hydrophobic, aggregates faster and the most synaptotoxic 4. In familial forms of AD, Aβ excessive generation and/or higher ratio of Aβ42 are sufficient for neurodegeneration. However, in the most frequent late‐onset forms of AD, the transition to pathological generation of Aβ remains poorly understood at a cellular and molecular level. Once generated, Aβ is secreted to the extracellular space or accumulates within endosomes 3, 5, 6. Endocytosis of APP and BACE1 to early endosomes, also named sorting endosomes, is required for the processing of APP generating Aβ 7, 8, 9, 10, 11. The neuronal trafficking of APP and BACE1 is largely segregated keeping to a minimum normal Aβ generation 10, 12, 13, 14. During early endosome maturation, APP is sorted for degradation in the lysosome 15, 16, while BACE1 recycles back to the plasma membrane 12, 16, 17. Consequently, the deregulation of APP and BACE1 segregation at early endosomes may boost Aβ generation 3. Yet the mechanisms underlying APP and BACE1 segregation at endosomes are unknown.
Genetic studies of late‐onset AD found variants in sortilin‐related receptor 1 (SORL1), phosphatidylinositol binding clathrin assembly protein (PICALM), bridging integrator 1 (BIN1), and CD2‐associated protein (CD2AP), known as endocytic regulators 18, 19, 20, 21, 22, 23, 24, 25, associated with increased risk for AD 26, 27, 28, 29, 30. Sorl1 and PICALM have been shown to be reduced in the AD brain 31, 32, 33. Loss of function of Sorl1 and PICALM potentiates Aβ production and decreases Aβ clearance, respectively 32, 34. Bin1 and CD2AP expression in AD patients has begun to be analysed 35, 36, 37, 38, 39, 40. Bin1 has mainly two isoforms in the brain, a longer and neuronal specific and a shorter and ubiquitous. The expression of the neuronal isoform has been found decreased in AD 36, 41. However, Bin1 and CD2AP expression in patients carrying BIN1 and CD2AP variants is unknown. Importantly, Bin1 variants were associated with poorer memory performance 42. Bin1 lower expression correlates with earlier AD onset 38. Bin1 knockdown impact on Aβ accumulation is not clear since increased Aβ secretion was observed in HeLa cells overexpressing APP with a familial AD mutation 43 but not in wild‐type neuronal‐like cells 36. CD2AP susceptibility loci were described to correlate with neuritic plaque burden in AD patients 44. Reduced CD2AP levels increased Aβ intracellularly but not extracellularly in neuronal‐like cells overexpressing APP without detectable changes on amyloid load in a familial AD mouse model 45. Yet how Bin1 and CD2AP modulate Aβ generation is unknown.
To investigate how Bin1 and CD2AP impact Aβ generation in late‐onset AD, we used a knockdown approach in otherwise normal neurons. By analysing endogenous intracellular Aβ accumulation with a sensitive assay, by following the kinetics of APP and BACE1 endocytic trafficking, and by directly visualising early endosomal sorting events important for Aβ generation using fast live imaging or super‐resolution techniques, we made the following mechanistic discoveries relevant for the AD field and more broadly to cell biology: Bin1 and CD2AP polarise the normal endogenous Aβ generation by specifically controlling BACE1 sorting for recycling in axons, and by specifically controlling APP sorting for degradation in dendrites, respectively. Mechanistically, we found Bin1 to be required for BACE1 exit from early endosomes by cutting off BACE1 tubules; and CD2AP to be required for an efficient sorting of APP away from processing at the early endosomal membrane by translocating APP to the lumen during multivesicular body biogenesis. Their loss of function potentiates Aβ accumulation and may thus contribute to the development of late‐onset AD. We identify the mechanisms implicated in a novel neuron‐specific polarisation of the amyloidogenic pathway regulated by two AD risk factors.
Results
Downregulation of Bin1 and CD2AP increases polarised endogenous Aβ generation
To determine whether Bin1 and CD2AP impact endogenous Aβ, we first established a semi‐quantitative assay for intracellular endogenous Aβ based on Aβ42 immunofluorescence 46, 47 (Fig EV1). Next, we efficiently downregulated Bin1 and CD2AP in wild‐type primary cortical neurons (neurons) using established siRNAs (Fig EV2A) 20, 48, 49, 50. Bin1 and CD2AP depletion increased intracellular endogenous Aβ42 in neuronal cell bodies (Fig 1A and D). However, when we analysed the levels of Aβ42 in neuronal dendrites and axons, morphologically identified based on soluble GFP expression or AnkG (axon marker), we unexpectedly found that downregulation of Bin1 resulted in a more pronounced increase in Aβ42 in axons than in dendrites and cell bodies (Fig 1A, C and D). In contrast, downregulation of CD2AP led to an increase in Aβ42 in dendrites, but not in axons (Fig 1A–D). We rescued the increase in Aβ42 by re‐expressing CD2AP and neuronal Bin1 but not ubiquitous Bin1 confirming the specificity of the siRNA (Fig EV2B and C).
Figure EV1. Validation of intracellular endogenous Aβ42 semi‐quantitative assay.
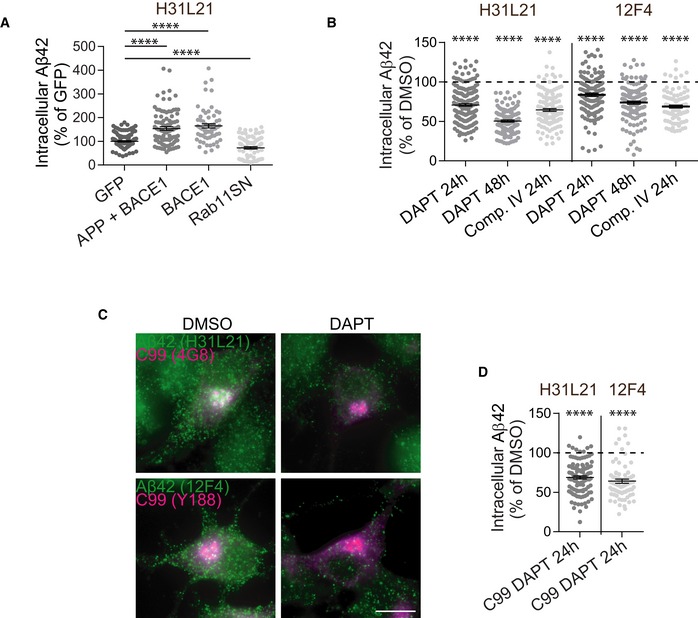
- Intracellular endogenous Aβ42 changes positively induced by overexpressing APP‐RFP and BACE1‐GFP or BACE1‐GFP alone; or negatively induced by overexpressing Rab11SN, a dominant‐negative mutant of Rab11 89 in N2a cells immunolabelled with anti‐Aβ42 (clone H31L21). Single‐cell semi‐quantitative analysis of Aβ42 immunofluorescence normalised to Aβ42 fluorescence intensity in GFP‐transfected cells (n = 3–5, N GFP = 133, N APP + BACE1 = 98, N BACE1 = 65, N Rab11SN = 101; ****P < 0.0001 vs. GFP, Mann–Whitney test, mean ± SEM).
- Intracellular endogenous Aβ42 changes upon the indicated treatment with inhibitors of Aβ generation, DAPT that blocks γ‐secretase 90, or compound IV that blocks BACE1 91, or their vehicle DMSO in N2a cells immunolabelled with anti‐Aβ42 (clones H31L21 or 12F4). Single‐cell semi‐quantitative analysis of Aβ42 immunofluorescence normalised to Aβ42 fluorescence intensity in cells treated with DMSO (n = 2–3, H31L21: N DMSO 24 h = 195, N DMSO 48 h = 145, N DAPT 24 h = 178, N DAPT 48 h = 128, N Comp. IV = 141, 12F4: N DMSO 24 h = 243, N DMSO 48 h = 138, N DAPT 24 h = 139, N DAPT 48 h = 128, N Comp. IV = 97; ****P < 0.0001 vs. DMSO, t‐test, mean ± SEM).
- Intracellular endogenous Aβ42 (green) and C99 (magenta) in N2a cells expressing C99 treated with DAPT or its vehicle DMSO, immunolabelled with anti‐Aβ42 (clones H31L21 or 12F4 as indicated) and with anti‐C‐terminal APP (Y188 or 4G8), analysed by epifluorescence microscopy. Scale bar, 10 μm.
- Intracellular endogenous Aβ42 changes upon expression of C99 and treatment with DAPT or its vehicle DMSO in N2a cells immunolabelled with anti‐Aβ42 (clones H31L21 or 12F4). Single‐cell semi‐quantitative analysis of Aβ42 immunofluorescence normalised to Aβ42 fluorescence intensity in cells treated with DMSO (n = 3, H31L21: N C99 + DMSO = 70, N C99 + DAPT = 116, 12F4: N C99 + DMSO = 84, N C99 + DAPT = 80; ****P < 0.0001 vs. C99 + DMSO, t‐test, mean ± SEM).
Figure EV2. CD2AP and Bin1 knockdown efficiency, intracellular Aβ and APP‐CTFs levels upon DAPT treatment.
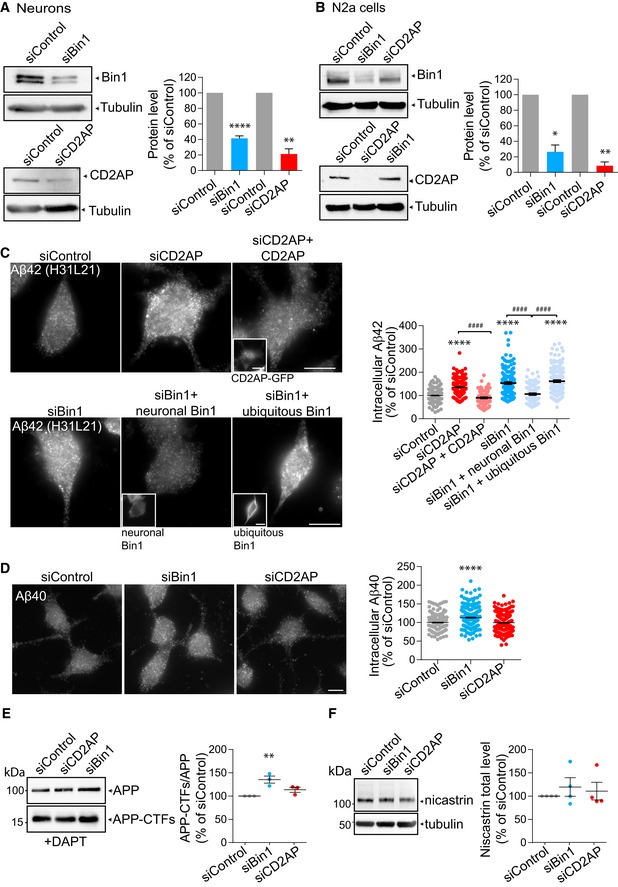
- Bin1 and CD2AP knockdown efficiency in siBin1‐, siCD2AP‐ and siControl‐treated neurons by Western blot analysis with anti‐Bin1, anti‐CD2AP and anti‐tubulin as a loading control. The quantification of Bin1 and CD2AP levels normalised to tubulin levels is shown on the right (n siBin1 = 5, ****P < 0.0001, t‐test, mean ± SEM; n siCD2AP = 3, **P = 0.075, t‐test, mean ± SEM).
- Bin1 and CD2AP knockdown efficiency in siBin1‐, siCD2AP‐ and siControl‐treated N2a cells by Western blot analysis with anti‐Bin1, anti‐CD2AP and anti‐tubulin as a loading control. Quantification of Bin1 and CD2AP levels normalised to tubulin levels is shown on the right (n siBin1 = 3; *P = 0.0137, t‐test, mean ± SEM; n siCD2AP = 3; **P = 0.0028, t‐test, mean ± SEM).
- Intracellular endogenous Aβ42 immunolabelled with anti‐Aβ42 (clone H31L21) in N2a cells treated with siBin1, siCD2AP or siControl alone or upon expression of the siRNA‐resistant plasmids: CD2AP‐GFP, neuronal Bin1 or ubiquitous Bin1 (right insets), analysed by epifluorescence microscopy. Scale bars, 10 μm. The quantification of Aβ42 intensity per cell is shown on the right (n = 3, N siControl = 197, N siCD2AP = 208, N siCD2AP + CD2AP‐GFP = 170, N siBin1 = 186, N siBin1 + neuronal Bin1 = 117, N siBin1 + ubiquitous Bin1 = 203; ****P < 0.0001 siCD2AP vs. siControl, siBin1 vs. siControl and siBin1 + ubiquitous Bin1 vs. siControl, #### P < 0.0001 siCD2AP + CD2AP‐GFP vs. siCD2AP and siBin1 vs. siBin1 + neuronal Bin1 and siBin1 + ubiquitous Bin1 vs. siBin1 + neuronal Bin1, one‐way ANOVA with Tukey's test; mean ± SEM).
- Intracellular endogenous Aβ40 in N2a cells treated with siBin1, siCD2AP or siControl, immunolabelled with anti‐Aβ40, analysed by epifluorescence microscopy. Scale bar, 10 μm. The quantification of Aβ40 intensity per cell is shown on the right (n = 3, N siControl = 268, N siBin1 = 234, N siCD2AP = 257; ****P < 0.0001 siBin1 vs. siControl, t‐test, mean ± SEM).
- Endogenous APP and APP C‐terminal fragments (APP‐CTFs) levels by Western blot analysis with anti‐APP antibody (Y188) of siBin1‐, siCD2AP‐ or siControl‐treated neurons upon DAPT treatment. The graph on the right shows the quantification of APP‐CTFs normalised to APP (n = 4; **P = 0.0057 siBin1 vs. siControl, t‐test, mean ± SEM).
- Endogenous nicastrin levels by Western blot analysis with anti‐nicastrin antibody (PA1‐758) and tubulin as a loading control in siBin1‐, siCD2AP‐ or siControl‐treated neurons. The quantification of nicastrin levels normalised to tubulin levels is shown on the right (n = 3, mean ± SEM).
Figure 1. Downregulation of Bin1 and CD2AP increases polarised endogenous Aβ generation.

-
AIntracellular endogenous Aβ42 (green), Ankyrin‐G (AnkG; magenta) and GFP (blue) in siBin1‐, siCD2AP‐ and siControl‐treated primary cortical neurons (neurons) expressing GFP immunolabelled at 9 DIV with anti‐Aβ42 (clone 12F4) and anti‐AnkG, analysed by spinning‐disc confocal microscopy. The white rectangles indicate the dendrites (Dd) and axons (Ax) magnified below showing Aβ42 in axons and dendrites outlined based on AnkG (magenta) and GFP (blue), respectively. Scale bars, 10 μm.
-
B, CAβ42 line profiles in dendrites (Dd; B) and axons (Ax; C) of siControl (grey line), siBin1 (blue line) and siCD2AP (red line) neurons shown in (A).
-
DQuantification of Aβ42 (12F4) intensity in cell body (CB), dendrite (Dd) and axon (Ax) (n = 5, N CB = 44–53, N Dd = 90–120, N Ax = 60–74; ****P CB < 0.0001 siBin1 vs. siControl, ***P CB < 0.001 siCD2AP vs. siControl, ****P Dd < 0.0001 siBin1 vs. siControl, ****P Dd < 0.0001 siCD2AP vs. siControl, ****P Ax < 0.0001 siBin1 vs. siControl, t‐test, mean ± SEM).
-
EQuantification of extracellular endogenous Aβ40, Aβ42 and of Aβ42/Aβ40 ratio by ELISA analysis of conditioned media of 9 DIV siBin1, siCD2AP or siControl neurons (n = 6; *P Aβ40 = 0.0270 siBin1 vs. siControl, *P Aβ42/40 = 0.0378 siBin1 vs. siControl, *P Aβ42/40 = 0.0463 siCD2AP vs. siControl, t‐test, mean ± SEM).
-
FEndogenous APP and APP‐CTFs levels by Western blot with anti‐APP antibody (Y188) of siBin1‐, siCD2AP‐ or siControl‐treated neurons at 9 DIV.
-
GQuantification of APP and APP‐CTFs levels normalised to APP (n = 4; *P APP = 0.0355 siBin1 vs. siControl, ***P APP‐CTFs/APP < 0.001 siBin1 vs. siControl, ****P APP‐CTFs/APP < 0.0001 siCD2AP vs. siControl, t‐test, mean ± SEM).
Source data are available online for this figure.
Analysis of extracellular endogenous Aβ evidenced a small increase in the ratio of Aβ42/Aβ40 both in Bin1‐ and CD2AP‐depleted neurons likely due to the significant decrease in Aβ40 secretion (Fig 1E). This decrease in extracellular Aβ40 was paralleled by a significant increase in intracellular Aβ40 when Bin1 but not CD2AP was depleted (Fig EV2D).
Could the rise in Aβ42 by downregulation of Bin1 and CD2AP be due to increased Aβ generation by APP processing? To answer this question, we analysed APP processing into its C‐terminal fragments (APP‐CTFs). APP‐CTFs increased when Bin1 was depleted and decreased when CD2AP was depleted without major change in APP (Fig 1F and G), indicating altered APP processing. Bin1 depletion likely raises APP‐CTFs by increasing BACE1 processing of APP, the rate limiting step to generate Aβ. CD2AP depletion likely decreases APP‐CTFs by increasing APP processing since inhibiting γ‐secretase with DAPT treatment of CD2AP‐depleted neurons restored the levels of APP‐CTFs to that of control neurons (Fig EV2E). We ruled out that these results could be explained by an increase in γ‐secretase levels, since levels of nicastrin, a subunit of γ‐secretase, were unaltered (Fig EV2F). Together, our results indicate that loss of function of Bin1 and CD2AP increases polarised Aβ generation in axons and dendrites, respectively.
Downregulation of Bin1 and CD2AP impacts on APP and BACE1 endocytic trafficking
Bin1 and CD2AP can associate with the endocytic machinery 51 and localise to early endosomes in non‐neuronal cells 20, 23. Bin1 has been described to control endocytosis, recycling and more recently the degradative pathway 21, 22, 23, 52. CD2AP functions in the degradative pathway 20. Thus, we investigated if the endocytic trafficking of APP was altered upon Bin1 and CD2AP knockdown by pulse/chase assays using an antibody against N‐terminal APP (22C11) 53, 54 (Fig 2A) in N2a cells transiently expressing human wild‐type APP C‐terminally tagged with RFP. 22C11 surface labelling (Fig EV3A) and endocytosis (10‐min pulse; Fig 2B and C) in Bin1‐ and CD2AP‐depleted cells were similar to control cells. This indicates that neither Bin1 nor CD2AP knockdown significantly alter cell surface APP or its endocytosis. After a 60‐min chase, however, we observed a 40% loss in 22C11 labelling in control and Bin1‐depleted cells, consistent with APP degradation in the lysosome (Figs 2D and E, and EV3C and D) 55, 56. In contrast, in CD2AP‐depleted cells, we did not observe a similar loss in 22C11 after the same chase period (Fig 2D and E), indicating that CD2AP knockdown delays APP degradation. Importantly, we rescued the defect in APP degradation by re‐expressing siRNA‐resistant CD2AP in CD2AP‐depleted cells (Fig EV3E). These results indicate that CD2AP is specifically required for efficient APP degradation. Overall, these results suggest that CD2AP, but not Bin1, controls APP endocytic trafficking.
Figure 2. Downregulation of Bin1 and CD2AP impacts on APP and BACE1 endocytic trafficking.
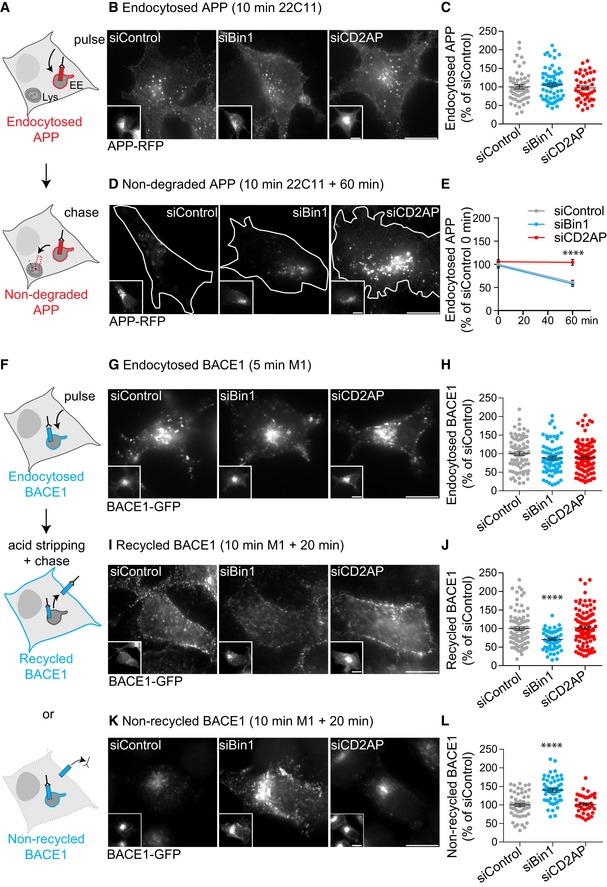
- Scheme illustrating APP endocytosis trafficking assayed in N2a cells transiently expressing APP‐RFP using a pulse/chase assay with anti‐N‐terminal APP (22C11). A 10‐min pulse to assay APP endocytosis (B) followed by a 60‐min chase to assay the degradation of endocytosed APP (D).
- Endocytosed APP detected after a 10‐min pulse with 22C11 and APP‐RFP (insets), analysed by epifluorescence microscopy. Scale bars, 10 μm.
- The amount of endocytosed APP fluorescence at 10 min was quantified and normalised to APP‐RFP fluorescence (n = 3, N siControl = 56, N siBin1 = 70, N siCD2AP = 42; mean ± SEM).
- Non‐degraded APP detected after 10‐min pulse and 60‐min chase with 22C11 and APP‐RFP (insets), analysed by epifluorescence microscopy. Cells are outlined in white. Scale bars, 10 μm.
- APP degradation was assessed by the decrease in the amount of endocytosed APP fluorescence at 60 min relative to time 0 (10 min pulse) in siControl cells normalised to APP‐RFP fluorescence (n 60 min = 3, N siControl = 68, N siBin1 = 43, N siCD2AP = 64; ****P APP60 min < 0.0001, t‐test, mean ± SEM).
- Scheme illustrating BACE1 endocytic trafficking assayed in N2a cells transiently expressing BACE1‐GFP N‐terminally tagged with FLAG using a pulse–chase assay with anti‐FLAG antibody (M1). A 5‐min pulse to assay BACE1 endocytosis (G), a 10‐min pulse and 20‐min chase to assay BACE1 recycling to the plasma membrane (I) and the pool of endocytosed BACE1 that did not recycle (K).
- Endocytosed BACE1 detected upon 5‐min pulse with M1 and BACE1‐GFP (insets), analysed by epifluorescence microscopy. Scale bars, 10 μm.
- The amount of endocytosed BACE1 per cell was quantified as percentage of siControl normalised to BACE1‐GFP (n = 3, N siControl = 86, N siBin1 = 72, N siCD2AP = 113; mean ± SEM).
- Recycled BACE1 detected at the plasma membrane of non‐permeabilised cells with M1, upon a 10‐min pulse, acid stripping and 20‐min chase, and BACE1‐GFP (insets), analysed by epifluorescence microscopy. Scale bars, 10 μm.
- The amount of recycled BACE1 was quantified as in (H) (n = 3, N siControl = 94, N siBin1 = 58, N siCD2AP = 109; ****P < 0.0001 siBin1 vs. siControl, t‐test, mean ± SEM).
- Non‐recycled BACE1 detected in acid‐stripped permeabilised cells pulse‐chased as in (I) with M1 and BACE1‐GFP (insets), analysed by epifluorescence microscopy. Scale bars, 10 μm.
- The amount of non‐recycled BACE1 was quantified as in (H) (n = 3, N siControl = 61, N siBin1 = 51; ****P < 0.0001 siBin1 vs. siControl, t‐test; n = 2, N siCD2AP = 37; mean ± SEM).
Figure EV3. APP trafficking assays upon CD2AP and Bin1 depletion.
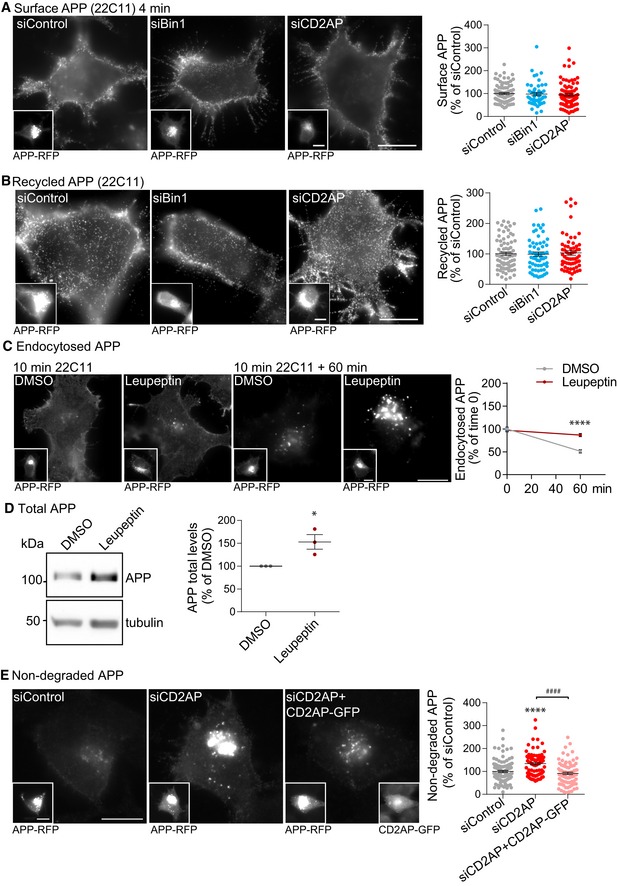
- Surface APP detected after a 4‐min pulse with anti‐N‐terminal APP (22C11) and immunofluorescence of non‐permeabilised N2a cells expressing APP‐RFP (insets), analysed by epifluorescence microscopy. Scale bars, 10 μm. The graph on the right shows the amount of cell surface APP fluorescence per cell quantified and normalised to APP‐RFP fluorescence (n = 4, N siControl = 91, N siBin1 = 49, N siCD2AP = 85; mean ± SEM).
- Recycled APP detected with 22C11 at the plasma membrane of non‐permeabilised cells expressing APP‐RFP (insets), upon a 10‐min pulse with 22C11, membrane acid stripping and 20‐min chase, analysed by epifluorescence microscopy. Scale bars, 10 μm. The graph on the right shows the amount of recycled APP fluorescence per cell quantified and normalised to APP‐RFP fluorescence (n = 4, N siControl = 75, N siBin1 = 61, N siCD2AP = 63; mean ± SEM).
- Endocytosed APP detected with 22C11 upon 10‐min pulse (left panels) and a 60‐min chase (right panels) in DMSO‐ or leupeptin‐treated N2a cells expressing APP‐RFP (insets), analysed by epifluorescence microscopy. Scale bars, 10 μm. The graph on the right shows APP degradation assessed by the decrease in the amount of endocytosed APP fluorescence at 60 min relative to time 0 (10‐min pulse) in DMSO‐treated cells normalised to APP‐RFP fluorescence (n = 3, N DMSO 10 min = 111, N DMSO 60 min = 109, N Leu 10 min = 118, N Leu 60 min = 99, ****P 60 min < 0.0001, t‐test, mean ± SEM).
- APP levels by Western blot with anti‐APP (Y188) of DMSO‐ or leupeptin‐treated neurons at 11–12DIV. Quantification of APP levels normalised to tubulin levels is shown on the right (n = 3, *P = 0.0296 leupeptin vs. DMSO, t‐test, mean ± SEM).
- Non‐degraded APP detected with 22C11 (10‐min pulse and 60‐min chase) in N2a cells expressing APP‐RFP (left insets) treated with siCD2AP, siControl alone or upon expression of siRNA‐resistant CD2AP‐GFP (right insets), analysed by epifluorescence microscopy. Scale bars, 10 μm. The amount of endocytosed APP fluorescence per cell quantified and normalised to APP‐RFP fluorescence is shown on the right (n = 3, N siControl = 109, N siCD2AP = 82, N siCD2AP + CD2AP‐GFP = 83; ****P < 0.0001 siCD2AP vs. siControl, #### P < 0.0001 siCD2AP+CD2AP‐GFP vs. siCD2AP, one‐way ANOVA with Tukey's test, mean ± SEM).
We next tested if Bin1 could instead impact BACE1 endocytic trafficking. To analyse BACE1 endocytosis, we introduced a FLAG tag at the N‐terminus of BACE1‐GFP that has a localisation similar to endogenous BACE1 57. Upon transient expression of FLAG‐BACE1‐GFP in N2a cells, we performed pulse/chase assays using an antibody against FLAG (M1) (Fig 2F). M1 surface labelling (Fig EV4A) and endocytosis (5‐min pulse; Fig 2G and H) were unaltered in cells depleted for Bin1 or CD2AP, indicating that neither Bin1 nor CD2AP knockdown alters cell surface BACE1 or its endocytosis. To measure BACE1 recycling back to the plasma membrane, we acid‐stripped non‐endocytosed M1 (Fig EV4B) and further chased endocytosed M1 for 20 min. Recycled M1 was then detected at the surface of non‐permeabilised cells (Fig 2I). We observed a reduction in the amount of recycled M1 at the surface of Bin1‐depleted cells as compared to CD2AP‐depleted and control cells (Fig 2I and J). These results indicate that Bin1 knockdown affects recycling of BACE1 but importantly not of APP (Fig EV3B).
Figure EV4. BACE1 trafficking assays upon CD2AP and Bin1 depletion.
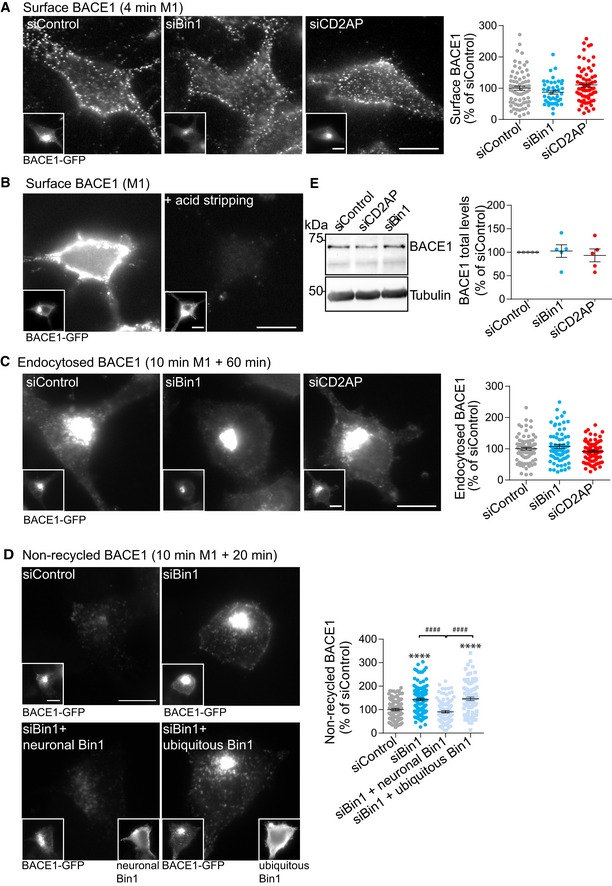
- Surface BACE1 detected after a 4‐min pulse with anti‐FLAG (M1) and immunofluorescence of non‐permeabilised cells expressing BACE1‐GFP (insets), analysed by epifluorescence microscopy. Scale bars, 10 μm. The graph on the right shows the amount of cell surface BACE1 fluorescence per cell quantified and normalised to BACE1‐GFP fluorescence (n = 4, N siControl = 70, N siBin1 = 43, N siCD2AP = 68; mean ± SEM).
- Surface BACE1 detected as in (A) before and after acid stripping, analysed by epifluorescence microscopy. Scale bars, 10 μm.
- Endocytosed BACE1 detected with M1 (10‐min pulse and 60‐min chase) and BACE1‐GFP (insets), analysed by epifluorescence microscopy. Scale bars, 10 μm. The graph on the right shows the amount of endocytosed BACE1 fluorescence per cell quantified and normalised to BACE1‐GFP fluorescence (n = 4, N siControl = 82, N siBin1 = 72, N siCD2AP = 76; mean ± SEM).
- Non‐recycled BACE1 detected with M1 (10‐min pulse, acid stripping and 20‐min chase) in acid‐stripped permeabilised N2a cells expressing BACE1‐GFP (left insets) treated with siBin1 or siControl alone or upon expression of neuronal Bin1 or ubiquitous Bin1 (right insets), analysed by epifluorescence microscopy. Scale bars, 10 μm. The graph on the right shows the amount of recycled BACE1 fluorescence per cell quantified and normalised to BACE1‐GFP fluorescence (n = 3, N siControl = 95, N siBin1 = 120, N siBin1 + neuronal Bin1 = 99, N siBin1 + ubiquitous Bin1 = 89; ****P < 0.0001 siBin1 vs. siControl and siBin1 + ubiquitous Bin1 vs. siControl, #### P < 0.0001 siBin1 vs. siBin1 + neuronal Bin1 and siBin1 + ubiquitous Bin1 vs. siBin1 + neuronal Bin1, one‐way ANOVA with Tukey's test; mean ± SEM).
- Endogenous BACE1 levels by Western blot analysis with anti‐BACE1 antibody and tubulin as a loading control in siBin1‐, siCD2AP‐ or siControl‐treated neurons. Quantification of BACE1 levels normalised to tubulin levels is shown on the right (n = 5, mean ± SEM).
The defective recycling of BACE1 observed in Bin1‐depleted cells could be explained by intracellular retention and/or increased degradation of BACE1. However, we did not find increased BACE1 degradation after a 60‐min chase (Fig EV4C), suggesting that BACE1 degradation is not altered. In contrast, we detected an increase in the amount of intracellular non‐recycled M1 in acid stripped and permeabilised Bin1‐depleted cells (Fig 2K and L). We concluded that defective BACE1 recycling upon Bin1 depletion was primarily due to its intracellular retention. Importantly, we rescued BACE1 recycling to control levels in Bin1‐depleted N2a cells by expressing siRNA‐resistant neuronal Bin1 (Fig EV4D), directly supporting a role for neuronal Bin1 in BACE1 recycling.
Overall, these results indicate that lack of CD2AP inhibits the endocytic trafficking of APP for its degradation in lysosomes. On the other hand, lack of Bin1 inhibits the endocytic recycling of BACE1 to the plasma membrane. Despite affecting different trafficking steps, the downregulation of CD2AP and Bin1 results in intracellular accumulation of APP and BACE1, respectively.
CD2AP‐dependent APP degradation and Bin1‐dependent BACE1 recycling are polarised in neurons
Mature neurons, differently from N2a cells, possess polarised trafficking of proteins in axons and dendrites, which is essential for proper neuronal function 58. We found Bin1 and CD2AP to have a specific distribution in neurons: Bin1 localised more to axons 59 than CD2AP, which localised preferentially to dendrites (Fig EV5A–C). Could CD2AP‐dependent APP degradation and Bin1‐dependent BACE1 recycling be differentially regulated in axons and dendrites to justify the polarisation of Aβ generation?
Figure EV5. CD2AP and Bin1 localisation, BACE1 and APP endocytosis and early endosomes alterations upon knockdown of Bin1 and CD2AP .
-
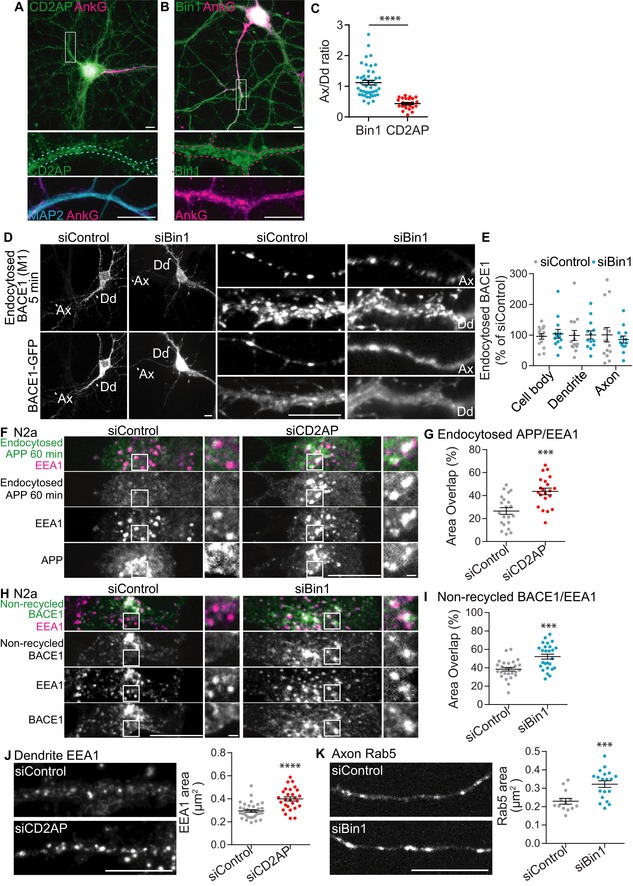
ACD2AP localisation in neurons immunolabelled at 21 DIV with anti‐CD2AP (green), anti‐AnkG (magenta) and anti‐MAP2 (blue) to identify dendrites (shown in magnified dendrites), analysed by epifluorescence microscopy. The white rectangle indicates the magnified dendrite shown in the bottom panels. Scale bars, 10 μm.
-
BBin1 localisation in neurons immunolabelled at 21 DIV with anti‐Bin1 (green) and anti‐AnkG (magenta) to identify axons, analysed by epifluorescence microscopy. The white rectangle indicates the magnified axon shown in the lower panels. Scale bars, 10 μm.
-
CThe axon/dendrite ratio of Bin1 and CD2AP calculated to quantify polarisation is shown (N CD2AP = 23, N Bin1 = 25; ****P < 0.0001, t‐test; mean ± SEM).
-
D–EBACE1 endocytosis detected with M1 in siBin1‐ and siControl‐treated neurons expressing BACE1‐GFP N‐terminally tagged with FLAG, analysed by epifluorescence microscopy. (D) Endocytosed BACE1 (top panels) detected with M1 (5‐min pulse) and BACE1‐GFP (bottom panels). Arrowheads identify axons (Ax) and dendrites (Dd) magnified on the right. Scale bars, 10 μm. (E) The amount of endocytosed BACE1 per cell body, dendrite and axons was normalised to BACE1‐GFP fluorescence in the cell body and quantified as percentage of siControl (n = 3, N siControl = 14, N siBin1 = 14; mean ± SEM).
-
FEndocytosed APP (green) detected with 22C11 (60‐min chase) in EEA1‐positive early endosomes (magenta) in siCD2AP‐ and siControl‐treated N2a cells expressing APP‐RFP, analysed by spinning‐disc confocal microscopy. Scale bar, 10 μm. The white squares are magnified on the right. Scale bar, 1 μm.
-
GThe quantification of colocalisation between endocytosed APP and EEA1 is shown (n = 3, N siControl = 21, N siCD2AP = 21; ***P < 0.001, t‐test, mean ± SEM).
-
HNon‐recycled BACE1 (green) detected with M1 (15‐min pulse, acid stripping and 20‐min chase) in EEA1‐positive early endosomes (magenta) in siControl‐ and siBin1‐treated N2a cells expressing BACE1‐GFP, analysed by spinning‐disc confocal microscopy. Scale bar, 10 μm. The white squares indicate EEA1‐positive endosomes magnified on the right. Scale bar, 1 μm.
-
IQuantification of colocalisation between non‐recycled BACE1 and EEA1 is shown (n = 3, N siControl = 26, N siBin1 = 26; ***P < 0.001, t‐test, mean ± SEM).
-
JEarly endosomes immunolabelled with anti‐EEA1 in siCD2AP‐ and siControl‐treated neurons analysed by epifluorescence microscopy. Scale bars, 10 μm. The quantification of the average area of EEA1‐positive early endosomes in dendrites is shown on the right (n = 4, N siControl = 34, N siCD2AP = 28; ****P < 0.0001, t‐test, mean ± SEM).
-
KRab5‐positive early endosomes detected in siBin1‐ and siControl‐treated neurons expressing Rab5‐GFP, analysed by spinning‐disc confocal microscopy. Scale bars, 10 μm. The quantification of the average area of Rab5‐positive early endosomes in axons is shown on the right (n = 3, N siControl = 14, N siBin1 = 19; ***P < 0.001, t‐test, mean ± SEM).
First, we assayed APP endocytosis with anti‐APP (22C11) in axons and dendrites of neurons treated with siRNA and expressing APP‐RFP as in N2a cells. Following a 10‐min pulse, we detected internalised 22C11 as vesicular puncta throughout neurons in both control and CD2AP‐depleted neurons (Fig 3A and B), consistent with CD2AP‐independent APP endocytosis in axons and dendrites. After a 60‐min chase, 22C11 was virtually undetected in control neurons (Fig 3C), consistent with APP degradation. In contrast, upon CD2AP depletion, 22C11 puncta were detected in dendrites but not in axons (Fig 3C). Quantification showed a threefold increase in 22C11 in CD2AP‐depleted dendrites as compared to control dendrites (Fig 3D). The cell body of CD2AP‐depleted neurons showed less 22C11 than dendrites (Fig 3D). These results indicate that CD2AP depletion mainly affects APP levels in dendrites suggestive of impaired APP degradation locally or due to reduced delivery to lysosomes in the cell body.
Figure 3. CD2AP depletion impairs APP degradation in dendrites.
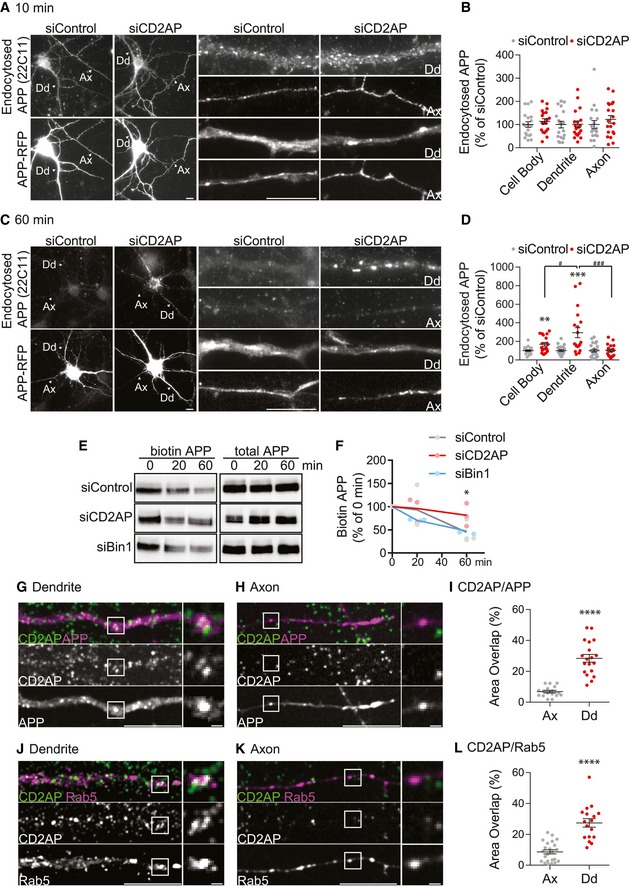
-
A–DAPP endocytic trafficking followed in neurons expressing APP‐RFP treated with siCD2AP or siControl using a pulse–chase assay with 22C11, analysed by epifluorescence microscopy. (A) Endocytosed APP detected with 22C11 (10‐min pulse; top panels) and APP‐RFP (bottom panels). Arrowheads identify axons (Ax) and dendrites (Dd) magnified on the right. Scale bars, 10 μm. (B) The amount of endocytosed APP (10 min) in cell body, dendrites and axons normalised to APP‐RFP expression in the cell body quantified as percentage of siControl (n = 3, N siControl = 19, N siCD2AP = 20; mean ± SEM). (C) Endocytosed APP detected with 22C11 (10‐min pulse, 60‐min chase; top panels) and APP‐RFP (bottom panels). Arrowheads identify axons (Ax) and dendrites (Dd) magnified on the right. Scale bars, 10 μm. (D) The amount of endocytosed APP (60‐min chase) was quantified as in (B) (n = 3, N siControl = 23, N siCD2AP = 19; **P CB = 0.001 siCD2AP vs. siControl, ***P Dd = 0.0004 siCD2AP vs. siControl, t‐test; # P = 0.0347 dendrite vs. cell body, ### P = 0.0008 dendrite vs. axon, one‐way ANOVA with Tukey's multiple comparisons test; mean ± SEM).
-
EDegradation of surface biotinylated APP (biotin APP) (time 0) chased for 20 and 60 min in neurons treated with siCD2AP, siBin1 or siControl. Biotin APP and total APP were detected with anti‐APP (Y188) by Western blot.
-
FQuantification of biotinylated APP normalised to levels at time 0 (n = 3–4, *P 60 min = 0.0198, t‐test; replicates and mean).
-
G, HCD2AP (green) and APP (magenta) localisation in dendrites (G) and axons (H) of neurons expressing APP‐RFP immunolabelled at 11 DIV with anti‐CD2AP, analysed by spinning‐disc confocal microscopy. Scale bars, 10 μm. The white squares are magnified on the right. Scale bars, 1 μm.
-
IQuantification of colocalisation between CD2AP and APP in axons and dendrites (n = 3–4, N Dd = 19, N Ax = 17; ****P < 0.0001, t‐test, mean ± SEM).
-
J, KCD2AP (green) and Rab5 (magenta) localisation in dendrites (J) and axons (K) of neurons expressing Rab5‐GFP analysed as in (G, H). Scale bars, 10 μm. The white squares are magnified on the right. Scale bars, 1 μm.
-
LQuantification of colocalisation between CD2AP‐ and Rab5‐positive endosomes in dendrites (Dd) and axons (Ax) (n = 3, N Dd = 17, N Ax = 23, ****P < 0.0001, t‐test, mean ± SEM).
Source data are available online for this figure.
Membrane APP degradation was further assayed by chasing biotinylated surface proteins for 20 and 60 min, detecting and measuring biotinylated APP at each time point. The levels of biotinylated APP at 60 min relative to time 0 were higher in CD2AP‐depleted neurons than in control neurons, and unaffected in Bin1‐depleted neurons (Fig 3E and F). These results suggest that CD2AP depletion without significantly affecting total APP levels at steady state (Fig 1F) delays specifically the degradation of membrane APP at dendrites.
Next, we asked whether CD2AP associates with early endosomes and with APP in neurons. Strikingly, CD2AP showed a twofold greater overlap with APP vesicles and with Rab5, a marker of early endosomes, in dendrites than in axons (Fig 3G–L). These results indicate that CD2AP could be associated with APP in dendritic early endosomes.
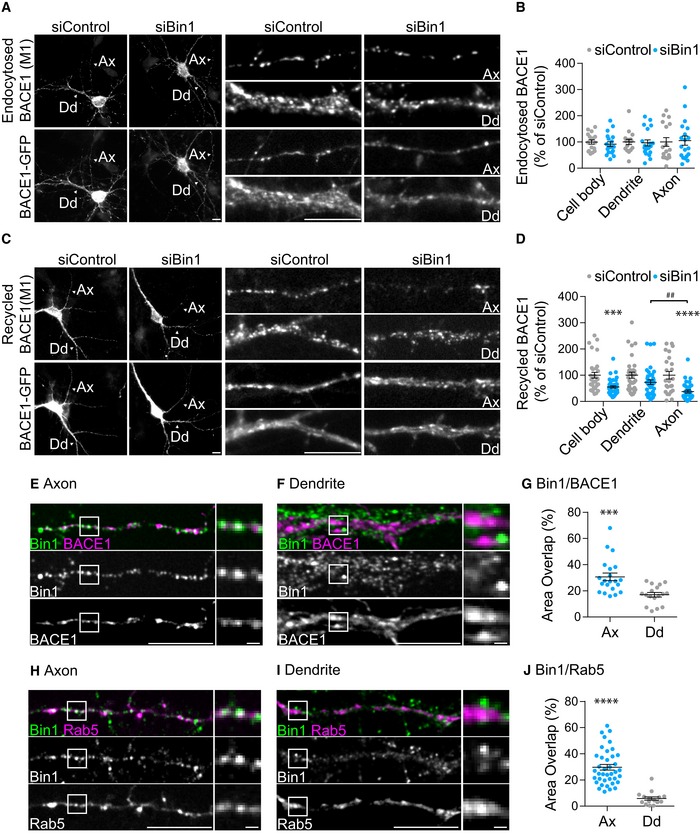
Second, BACE1 endocytosis was assayed using anti‐FLAG (M1) in axons and dendrites of neurons treated with siRNA and expressing FLAG‐BACE1‐GFP as in N2a cells. We detected endocytosed M1 (5‐min pulse) as vesicular puncta throughout neurons in both control and Bin1‐depleted neurons (Fig EV5D and E) consistent with Bin1‐independent BACE1 endocytosis. M1 was then pulsed for 15 min, without significant differences between Bin1‐depleted and control neurons (Fig 4A and B), and chased (20 min) to allow for BACE1 recycling to the plasma membrane. M1 was detected at the plasma membrane of axons and dendrites of control neurons (Fig 4C), indicating BACE1 recycling. In contrast, upon Bin1 depletion, we could detect less M1 at the plasma membrane of axons but not of dendrites (Fig 4C). Quantitative measurements evidenced a major reduction in recycled M1 levels at the axonal surface compared to a minor reduction in dendrites and cell bodies of Bin1‐depleted neurons as compared to control neurons (Fig 4D). We ruled out that these results could be explained by a decrease in BACE1 total levels (Fig EV4E). Together, these results indicate a specific defect in BACE1 recycling in axons when Bin1 is depleted.
Figure 4. Bin1 depletion reduces BACE1 recycling in axons.
-
A–DBACE1 endocytic trafficking followed in siBin1‐ and siControl‐treated neurons expressing BACE1‐GFP N‐terminally tagged with FLAG using a pulse/chase assay with M1, an anti‐FLAG antibody, analysed by epifluorescence microscopy. (A) Endocytosed BACE1 detected with M1 (15‐min pulse; top panels) and BACE1‐GFP (bottom panels). Arrowheads identify axons (Ax) and dendrites (Dd) magnified on the right. Scale bars, 10 μm. (B) The amount of endocytosed BACE1 per cell body, dendrite and axons was normalised to BACE1‐GFP expression in the cell body and quantified as percentage of siControl (n = 3, N siControl = 17, N siBin1 = 19, mean ± SEM). (C) Recycled BACE1 detected with M1 (15‐min pulse, acid stripping and 20‐min chase; top panels) at the plasma membrane of non‐permeabilised neurons and BACE1‐GFP (bottom panels). Arrowheads identify axons (Ax) and dendrites (Dd) magnified on the right. Scale bars, 10 μm. (D) The amount of recycled BACE1 analysed as in (B) (n = 4, N siControl = 31, N siBin1 = 38, ***P CB = 0.0002 and ****P Ax < 0.0001 siBin1 vs. siControl, t‐test; ## P = 0.0014 axon vs. dendrite, one‐way ANOVA with Tukey's multiple comparisons test; mean ± SEM).
-
E, FBin1 (green) and BACE1 (magenta) localisation in axons (E) and dendrites (F) of neurons expressing BACE1‐GFP immunolabelled at 11 DIV with anti‐Bin1, and analysed by spinning‐disc confocal microscopy. Scale bars, 10 μm. The white squares are magnified on the right. Scale bars, 1 μm.
-
GQuantification of colocalisation between Bin1 and BACE1 in axons and dendrites (n = 3, N Dd = 17, N Ax = 21; ***P = 0.0006 axon vs. dendrite, t‐test; mean ± SEM).
-
H, IBin1 (green) and Rab5 (magenta) localisation in axons (H) and dendrites (I) of neurons expressing Rab5‐GFP analysed as in (E, F). Scale bars, 10 μm. The white squares are magnified on the right. Scale bars, 1 μm.
-
JQuantification of colocalisation between Bin1‐ and Rab5‐positive endosomes in axons (Ax) and dendrites (Dd) (n = 3, N Ax = 39, N Dd = 16, ****P < 0.0001, t‐test, mean ± SEM).
Next, we asked whether Bin1 associates with early endosomes and with BACE1 in neurons. Strikingly, Bin1 showed a twofold greater overlap with BACE1 vesicles and with Rab5‐positive early endosomes in axons than in dendrites (Fig 4E–J). These results indicate that Bin1 could be associated with BACE1 in axonal early endosomes.
Together, our results show that loss of function of Bin1 and CD2AP contributes to the build‐up of Aβ by controlling different steps of the endocytic trafficking of BACE1 and APP, respectively. In neurons, this occurs in distinct compartments likely due to the polarised association between Bin1 and early endosomes in axons, and between CD2AP and early endosomes in dendrites.
The encounter of APP and BACE1 increases in early endosomes when CD2AP and Bin1 are depleted
Next, we investigated if the intracellular accumulation of APP and BACE1 observed upon depletion of CD2AP and Bin1, respectively, occurred in early endosomes, the site of Aβ generation.
The endocytosed APP that accumulated in CD2AP‐depleted dendrites (60 min; Fig 3C) was found to overlap 2.8‐fold more with EEA1, a marker of dendritic early endosomes, compared to control dendrites (Fig 5A and B). Similarly, endocytosed APP (60 min) accumulated in non‐polarised EEA1‐positive early endosomes in CD2AP‐depleted N2a cells (Fig EV5F and G). We confirmed that APP endocytosis (10 min) and APP initial delivery to EEA1‐positive early endosomes were not impaired in CD2AP‐depleted dendrites (Appendix Fig S1A). These results indicate that depletion of CD2AP inhibits APP sorting for degradation leading to APP accumulation in dendritic early endosomes consistent with an inhibition of delivery of APP to lysosomes.
Figure 5. CD2AP and Bin1 depletion increase the encounter of APP and BACE1 in neuronal early endosomes.
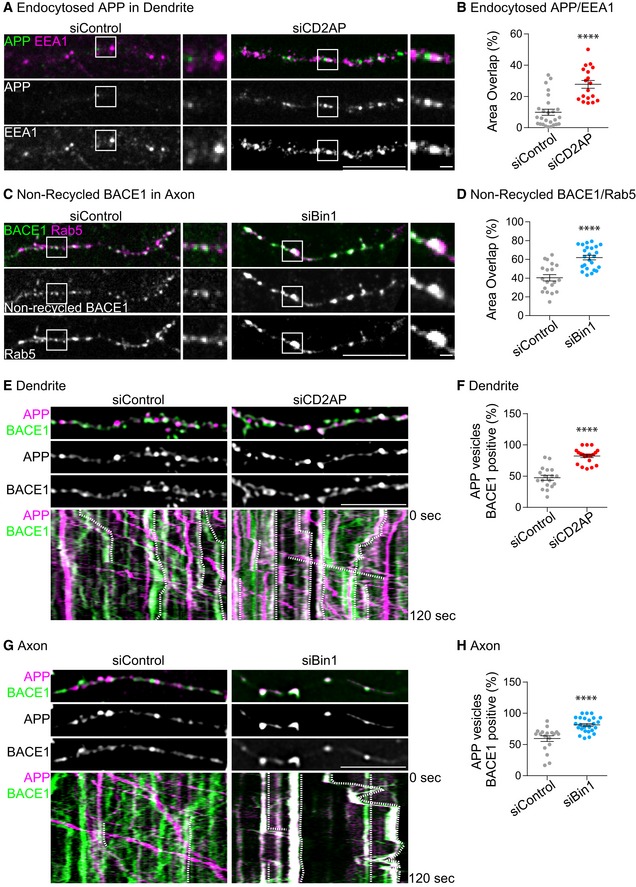
- Endocytosed APP (green) detected with 22C11 (10‐min pulse and 60‐min chase) in EEA1‐positive early endosomes (magenta) in dendrites of siCD2AP‐ and siControl‐treated neurons expressing APP‐RFP, analysed by spinning‐disc confocal microscopy. Scale bar, 10 μm. The white squares indicate an EEA1‐positive endosome magnified on the right. Scale bar, 1 μm.
- Quantification of colocalisation between endocytosed APP and EEA1 in dendrites (n = 3, N siControl = 26 N siCD2AP = 18; ****P < 0.0001, t‐test; mean ± SEM).
- Non‐recycled BACE1 (green) detected with M1 (15‐min pulse, acid stripping and 20‐min chase) in Rab5‐positive early endosomes (magenta) in axons of siControl‐ and siBin1‐treated neurons expressing Rab5‐mCherry and BACE1‐GFP, analysed by spinning‐disc confocal microscopy. Scale bar, 10 μm. White squares indicate a Rab5‐positive endosome magnified on the right. Scale bar, 1 μm.
- Quantification of colocalisation between non‐recycled BACE1 and Rab5 in axons (n = 3, N siControl = 19, N siBin1 = 24; ****P < 0.0001, t‐test; mean ± SEM).
- APP (magenta) and BACE1 (green) colocalisation in dendrites of siCD2AP‐ and siControl‐treated neurons expressing APP‐RFP and BACE1‐GFP upon DAPT treatment, recorded by time‐lapse spinning‐disc confocal microscopy for 120 s (1 fps) (see Movie EV1). APP and BACE1 in dendrites at 0 s are shown and during 120 s in kymographs (bottom panels). Dotted white lines in kymographs highlight APP vesicles positive for BACE1. Scale bar, 10 μm.
- Quantification of the colocalisation between APP and BACE1 in dendrites (n = 3, N siControl = 18, N siCD2AP = 21; ****P < 0.0001, t‐test; mean ± SEM).
- APP (magenta) and BACE1 (green) colocalisation in axons of siBin1‐ and siControl‐treated neurons expressing APP‐RFP and BACE1‐GFP upon DAPT treatment, recorded by time‐lapse spinning‐disc confocal microscopy for 120 s (1 fps) (see Movie EV2). APP and BACE1 in axons at 0 s are shown and during 120 s in kymographs (bottom panels). Dotted white lines in kymographs highlight APP vesicles positive for BACE1. Scale bar, 10 μm.
- Quantification of the colocalisation between APP and BACE1 in axons (n = 4, N siControl = 17, N siBin1 = 27; ****P < 0.0001, t‐test; mean ± SEM).
The endocytosed BACE1 that did not recycle in Bin1‐depleted axons (Fig 4C) and accumulated intracellularly (Fig 2K) was found to overlap 1.5‐fold more in Rab5‐positive early endosomes compared to control axons (Fig 5C and D). In N2a cells, non‐recycled BACE1 (20 min; Fig 2K) also accumulated in non‐polarised EEA1‐positive early endosomes without Bin1 (Fig EV5H and I). These results indicate that depletion of Bin1 inhibits BACE1 recycling to the plasma membrane leading to BACE1 accumulation in axonal early endosomes.
Interestingly, we observed that early endosomes were larger when CD2AP or Bin1 were depleted (Fig EV5J and K), consistent with cargo accumulation due to impaired trafficking through the endocytic pathway.
Our results suggest that the increased Aβ generation observed could result from APP accumulation at dendritic endosomes when CD2AP is depleted or from BACE1 accumulation at axonal early endosomes when Bin1 is depleted. Therefore, we next investigated BACE1 and APP colocalisation by live imaging of BACE1‐GFP and APP‐RFP that allows for the detection of APP and APP‐CTFs when neurons are treated with DAPT to inhibit cleavage and loss of the C‐terminal RFP. We found little APP and BACE1 colocalisation in dendrites and axons of DAPT‐treated control neurons (Movies EV1 and EV2; Fig 5E–H) 13. Importantly, we observed an increase in APP and BACE1 colocalisation in CD2AP‐depleted dendrites (Movie EV1 and Fig 5E and F) and in Bin1‐depleted axons (Movie EV2 and Fig 5G and H).
Together, these results support that the downregulation of CD2AP traps APP at dendritic early endosomes that contain BACE1 while downregulation of Bin1 traps BACE1 at axonal early endosomes that contain APP.
The retention of APP or BACE1 at early endosomes caused by downregulation of CD2AP or Bin1, respectively, is thus sufficient to increase the encounter of BACE1 with APP augmenting Aβ generation.
Lack of Bin1 inhibits tubule scission for BACE1 exit from early endosomes
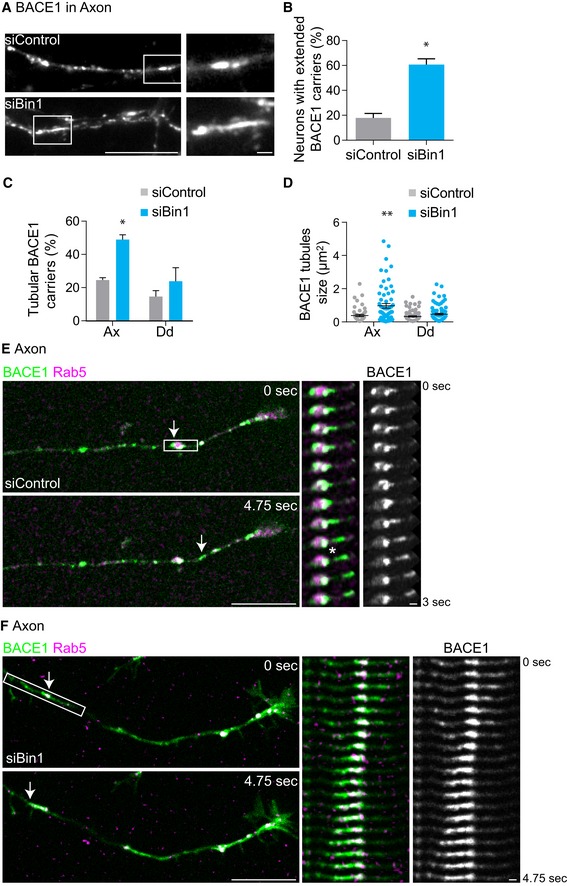
How is BACE1 recycling controlled by Bin1? When Bin1 is depleted, BACE1 accumulates in early endosomes (Fig 5C) suggesting that the exit of BACE1 from early endosomes for recycling is impaired. Exit from early endosomes for recycling implicates the formation of tubular carriers that upon scission bring cargo to the plasma membrane 60. Bin1 contains a Bin–Amphiphysin–Rvs (BAR) domain able to tubulate membranes 21. We thus asked if Bin1 controls the formation of tubular carriers required for BACE1 exit from early endosomes. We analysed the presence of extended and enlarged BACE1 carriers in control and Bin1‐depleted neurons (Fig 6A). Unexpectedly, we found that Bin1 depletion increased by threefold the fraction of neurons displaying BACE1 extended carriers when compared to control neurons (Fig 6B). To better characterise the shape of BACE1 carriers, we analysed the circularity and length of each carrier individually in axons and in dendrites. The number and length of BACE1 tubular carriers (circularity < 0.5) increased predominantly in Bin1‐depleted axons (Fig 6C and D).
Figure 6. Bin1 depletion inhibits tubule scission for BACE1 exit from early endosomes.
-
ABACE1 carriers in axons of siBin1‐ or siControl‐treated neurons expressing BACE1‐GFP, analysed by epifluorescence microscopy. Scale bar, 10 μm. White rectangles indicate a BACE1‐positive carrier magnified on the right. Scale bar, 1 μm.
-
BQuantification of the percentage of siBin1‐ or siControl‐treated neurons displaying extended BACE1 carriers (as shown in A); (n = 3, N siControl = 67 cells, N siBin1 = 68 cells; *P = 0.0199, t‐test, mean ± SEM).
-
CQuantification of circularity of individual BACE1 carriers in axons and in dendrites of siBin1‐ or siControl‐treated neurons. The percentage of BACE1 tubules (defined by circularity < 0.5; n = 2, N Ax = 116 and N Dd = 134 of siControl carriers, N Ax = 71 and N Dd = 134 of siBin1 carriers; *P = 0.0105 siBin1‐axons compared to siControl‐axons, t‐test, mean ± SEM).
-
DQuantification of average size (μm2) of individual BACE1 carriers in axons and in dendrites of siBin1‐ or siControl‐treated neurons (n = 2, N Ax = 116 and N Dd = 134 siControl, N Ax = 71 and N Dd = 134 siBin1; **P = 0.0019, Mann–Whitney test, mean ± SEM).
-
E, FBACE1 (green) exit in tubular carriers from Rab5‐positive early endosomes (magenta) in axons of siBin1 (F)‐ and siControl (E)‐treated neurons expressing BACE1‐GFP and Rab5‐mCherry using time‐lapse spinning‐disc confocal microscopy (4 fps) (see Movie EV3). BACE1 and Rab5 are shown in axons at 0 s and 4.75 s. Scale bars, 10 μm. White rectangles indicate the region used in kymographs shown on the right. Arrows and kymographs (covering 3 or 4.75 s) of merged BACE1 and Rab5 or BACE1 alone indicate in (E) a BACE1 punctum that exits in a tubular carrier from a Rab5‐positive early endosome (asterisk) and in (F) a BACE1 tubule that emanates from a Rab5‐positive early endosome. Scale bars, 1 μm.
To confirm this finding, we directly visualised the formation of BACE1 tubular carriers and their exit from early endosomes using fast spinning‐disc confocal live imaging (4 fps). In control axons, we could observe BACE1‐GFP tubule formation and exit upon scission from Rab5‐positive early endosomes (Fig 6E and Movie EV3). In axons depleted for Bin1, we could observe the formation of BACE1‐GFP tubules from Rab5‐positive early endosomes, in contrast to scission events that were not clearly observed (Fig 6F and Movie EV3). Instead, when Bin1 is depleted, BACE1 tubules remained stably associated with early endosomes (Fig 6F). Thus, Bin1 likely controls the scission but not the formation of BACE1 tubules in axons.
These results show that BACE1 tubule exit from axonal early endosomes is inhibited by depletion of Bin1 explaining the defect in BACE1 recycling to the axonal plasma membrane, its accumulation in axonal early endosomes and the increase in Aβ generation.
CD2AP depletion stalls APP at the limiting membrane of early endosomes
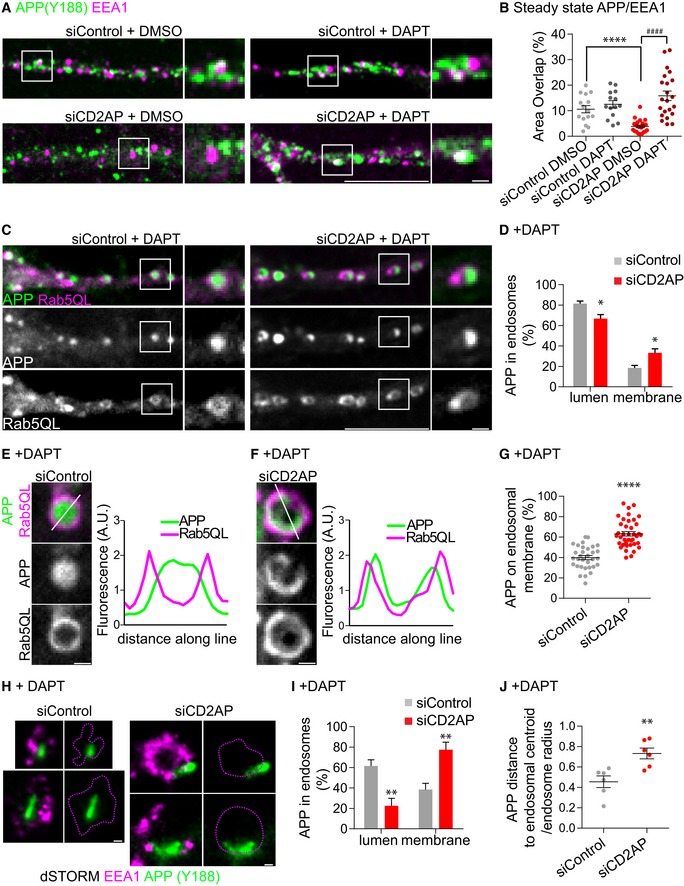
Since we observed an accumulation of endocytosed APP at early endosomes and increased Aβ generation, we assessed the impact of depletion of CD2AP on endogenous APP processing in early endosomes at steady state. APP presence at EEA1‐positive early endosomes was reduced in CD2AP‐depleted dendrites compared to control dendrites (Fig 7A and B). Importantly, DAPT treatment led to a fourfold increase in APP in early endosomes of CD2AP‐depleted dendrites compared to DMSO treatment (Fig 7A and B). DAPT treatment of control dendrites had no significant effect (Fig 7A and B). This reduction in APP from early endosomes when CD2AP is depleted and its rescue by DAPT treatment is consistent with CD2AP controlling the processing of endogenous APP at early endosomes.
Figure 7. CD2AP depletion stalls APP at the limiting membrane of early endosomes.
-
AAPP detected with anti‐APP (Y188, green) at early endosomes (anti‐EEA1, magenta) in dendrites of siCD2AP‐ and siControl‐treated neurons with or without DAPT treatment, analysed by spinning‐disc confocal microscopy. Scale bar, 10 μm. White squares are magnified on the right panels. Scale bar, 1 μm.
-
BQuantification of colocalisation between APP‐ and EEA1‐positive dendritic endosomes (n = 3, N siControl DMSO = 15, N siControl DAPT = 14; N siCD2AP DMSO = 21, N siCD2AP DAPT = 22; ****P < 0.0001 siCD2AP DMSO vs. siControl DMSO, #### P < 0.0001 siCD2AP DAPT vs. siCD2AP DMSO, t‐test, mean ± SEM).
-
CAPP (green) distribution within enlarged Rab5QL‐GFP endosomes (magenta) in dendrites of siCD2AP‐ or siControl‐treated neurons expressing APP‐RFP and Rab5QL‐GFP upon DAPT treatment, analysed by spinning‐disc confocal microscopy. Scale bar, 10 μm. White squares indicate a Rab5QL‐positive endosome magnified on the right. Scale bar, 1 μm.
-
DQualitative analysis of APP distribution between the lumen and the membrane of Rab5QL‐endosomes (n = 4, N siControl = 45 (774 endosomes), N siCD2AP = 52 (888 endosomes); *P = 0.0368 siCD2AP vs. siControl, t‐test, mean ± SEM).
-
E, FAPP (green) distribution within enlarged Rab5QL‐GFP endosomes (magenta) in cell bodies of siCD2AP (F)‐ or siControl (E)‐treated neurons expressing APP‐RFP, upon DAPT treatment, analysed by spinning‐disc confocal microscopy. APP (green) and Rab5QL (magenta) line intensity profiles along the endosome (see inset line) are shown on the right. Scale bars, 1 μm.
-
GQuantification of the amount of APP fluorescence at the limiting endosomal membrane normalised to total APP fluorescence per endosome (n = 3, N siControl = 32 endosomes (11 cells), N siCD2AP = 39 endosomes (15 cells); ****P < 0.0001, t‐test, mean ± SEM).
-
HAPP detected with anti‐APP (Y188, green) at early endosomes (anti‐EEA1, magenta) in dendrites of siCD2AP‐ and siControl‐treated neurons upon DAPT treatment, analysed by super‐resolution dSTORM imaging. Scale bars, 200 nm.
-
IQualitative analysis of super‐resolved APP distribution between the lumen and the membrane of EEA1‐positive endosomes of siCD2AP‐ or siControl‐treated neurons upon DAPT treatment (n = 3, N siControl = 35, N siCD2AP = 57, **P = 0.0012, Mann–Whitney test, mean ± SEM).
-
JQuantification of the distance of APP puncta present in EEA1‐positive early endosomes to its centroid over the endosome radius. The closer the ratio is to 1, the closer APP is to the endosomal membrane (i.e. distance equals radius) (n = 3, N siControl = 6, N siCD2AP = 6; **P = 0.0051, t‐test, mean ± SEM).
How is APP processing controlled by CD2AP at early endosomes? APP retention at early endosomes limiting membrane favours APP processing 8, 10, 16, 61. CD2AP is a scaffolding molecule implicated in multivesicular body (MVB) biogenesis. CD2AP could function in MVB biogenesis by sorting cargo to the inner luminal vesicles (ILVs) that start forming at early endosomes to originate MVBs. Thus, CD2AP depletion could increase APP processing by inhibiting APP sorting away from the endosomal limiting membrane.
To test this, we evaluated upon DAPT treatment the distribution of APP within Rab5QL‐enlarged endosomes, which allow for the distinction between the limiting membrane and the lumen, containing ILVs 62. As reported, APP localised to the lumen of enlarged control‐Rab5QL endosomes treated with DAPT (Fig 7C) 16. In contrast, following CD2AP depletion, APP localised to the limiting membrane in a higher fraction of Rab5QL endosomes of dendrites (Fig 7C,D and G). This was more easily visualised in line intensity profiles of larger Rab5QL endosomes (Fig 7E and F).
To determine whether this increase in APP at the limiting membrane of Rab5QL‐endosomes also occurred in non‐enlarged dendritic early endosomes, we used super‐resolution dSTORM microscopy. Super‐resolved endosomes evidenced an increase in the fraction of endosomes with APP at the limiting membrane (Fig 7H and I). Accordingly, the distance of endosomal APP cluster to the centroid of non‐enlarged early endosomes increased in CD2AP‐depleted dendrites when compared to controls (Fig 7J), further supporting and strengthening our previous results in enlarged endosomes.
These results strongly suggest that the sorting of APP and/or APP‐CTFs away from the limiting membrane into ILVs during MVB biogenesis is impaired when CD2AP is downregulated, precluding APP degradation in lysosomes. The consequent accumulation of APP at the limiting membrane of dendritic early endosomes favours the sorting for processing and the generation of Aβ.
Discussion
Aβ generation by neurons is controlled by the convergence of APP and BACE1 at endosomes (Fig 8A) 12, 13, 16, 17, 63.
Figure 8. Model for the polarised role of Bin1 and CD2AP in Aβ endocytic generation in neurons.
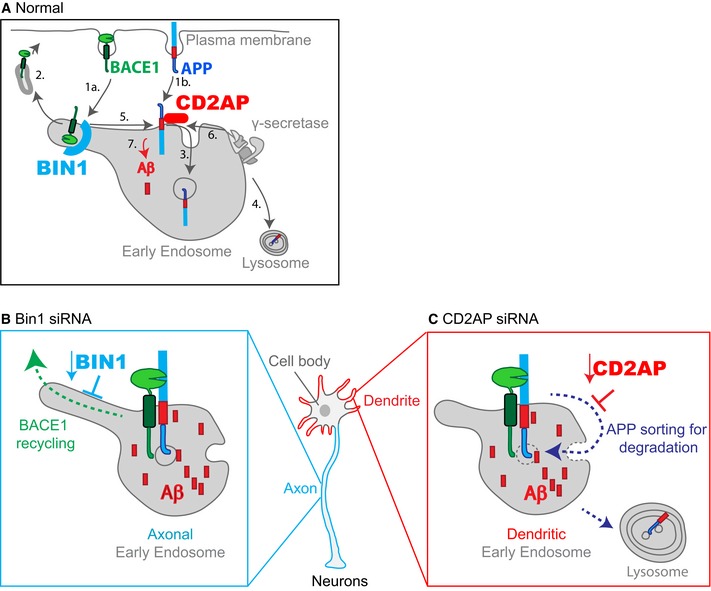
- Normal APP and BACE1 endocytic trafficking diverge at early endosomes restricting Aβ generation. (1a) BACE1 endocytosis. (1b) APP endocytosis. (2) BACE1 recycling to the plasma membrane. (3) APP sorting to intraluminal vesicles. (4) APP delivery to the lysosome for degradation. (5) BACE1 cleavage of APP. (6) γ‐secretase cleavage of APP‐CTF (not represented). (7) Aβ generation.
- In Bin1‐depleted neurons, BACE1 accumulates in early endosomes raising Aβ generation in axons due to inhibition of local BACE1 recycling. Inhibition of recycling likely results from inefficient scission and exit of tubular BACE1 carriers from axonal early endosomes to which Bin1 preferentially associates.
- In CD2AP‐depleted neurons, APP accumulates in early endosomes raising Aβ generation in dendrites due to inhibition of local APP degradation. Inhibition of degradation likely results from impaired sorting of APP in dendritic early endosomes to which CD2AP preferentially associates. Inhibition of APP sorting away from the endosomal limiting membrane favours local APP processing.
Here we show that the depletion of Bin1 and CD2AP, two regulators of the endocytic pathway and putative risk factors for late‐onset AD, increases and polarises the generation of Aβ in neurons. The depletion of Bin1 enhances the encounter of APP with BACE1 in axons, whereas the depletion of CD2AP enhances their encounter in dendrites. This results in Aβ accumulation mostly in axons without Bin1 and mostly in dendrites without CD2AP. This polarisation of Aβ generation to axons or to dendrites will probably impact Aβ toxicity locally and thus differentially affect the onset or progression of AD in the patients carrying Bin1 and CD2AP risk.
Intracellular Aβ
Intracellular Aβ42 increased the most upon loss of function of Bin1 and CD2AP. The more pronounced effect on intracellular Aβ suggests that Bin1 and CD2AP main target is the intracellular control of Aβ production. A specific increase in the intracellular pool of Aβ has not been described yet for late‐onset AD. However, in familial AD, mutations in PS2 increase the ratio of Aβ42/Aβ40 mostly intracellularly 64. Together with previous published work 4, 65, these findings support the contribution of intracellular Aβ to AD development. It will be important in the future to examine the contribution of other AD risk factors to the intracellular pool of Aβ.
Polarised Aβ generation
The polarised generation of Aβ that we describe is due to a polarised association of Bin1 with axonal early endosomes and of CD2AP with dendritic early endosomes. Why do Bin1 and CD2AP show this polarisation in neurons despite functioning in a common early endosome in non‐polarised cells is unclear. In neurons, distinct populations of early endosomes exist. Axonal and dendritic early endosomes differentially associate endosomal regulators, such as the ubiquitously expressed EEA1 only present in dendritic early endosomes despite being recruited by Rab5, present in all early endosomes 58. Axonal endosomes could be involved in generating synaptic vesicles, whereas dendritic early endosomes could have a more “housekeeping” role 66. Similar, but less profound, polarisation of early endosomes is also found in polarised epithelial cells 67. We now implicate the regulation of axonal and dendritic endosomes in the polarisation of Aβ generation.
In the future, it will be important to determine the relative impact of a higher axonal vs dendritic Aβ pool to the earliest pathophysiological alterations of the disease.
Bin1 and CD2AP control the endocytic generation of Aβ
Loss of function of Bin1 and CD2AP increases APP and BACE1 convergence at early endosomes. Different mechanisms are used by Bin1 and CD2AP to control APP and BACE1 levels at early endosomes.
Bin1 controls BACE1 recycling from early endosomes specifically in axons. Our direct visualisation of the inhibition of BACE1 recycling from early endosomes upon Bin1 depletion is consistent with Bin1 controlling transferrin recycling in non‐neuronal cells 21. Another cargo of the recycling pathway could be Aβ40 thus explaining its reduced secretion. However, some cargo specificity exists in vivo since we found the recycling of APP unaltered when Bin1 is depleted. Bin1 has also been described to have a role in endocytosis and degradation 23, 51, 68. In neuronal cells, endocytosis of BACE1 or APP was not altered by Bin1 depletion, suggesting that the neuronal isoform of Bin1 is not required for endocytosis. We found BACE1 cellular levels unaltered by Bin1 knockdown suggesting that an extended Bin1 deletion is required for the reduction in BACE1 degradation 52. Importantly, we found a requirement for neuronal Bin1 and not for ubiquitous Bin1 in BACE1 recycling indicating a neuronal specific function of Bin1. The major difference of neuronal Bin1 is the presence of a brain‐specific clathrin‐binding domain (CLAP) 69. Clathrin light chains have been described to function at early endosomes as hot spots for recycling 70, 71. Thus, neuronal Bin1 by binding to clathrin could recruit BACE1 to recycling hot spots at early endosomes. We found Bin1 to be likely required for scission of BACE1 tubules emanating from early endosomes. Thus, Bin1 capacity to make tubules does not seem necessary for the formation of BACE1 tubular recycling carriers. Instead, Bin1 binding to the early endosome membrane could induce the necessary curvature for scission dependent on dynamin or EHD1, a dynamin‐like protein 21, 51, 72, 73, 74. In turn, we propose that in late‐onset AD patients with variants in BIN1, there is a loss of function of Bin1 leading to BACE1 accumulation in axonal early endosomes increasing its encounter with APP favouring processing and Aβ generation mainly in axons (Fig 8B).
We found that CD2AP controls APP degradation specifically at early endosomes in dendrites. APP sorting to ILVs during MVB formation is required for its degradation 15. CD2AP had previously been found to control degradation of toxins and receptors and its deficiency to correlate with reduced number of MVBs 18, 20, 75. Our results suggest that it is by facilitating MVB formation that CD2AP controls lysosomal degradation of endocytosed cargo such as APP. In addition, CD2AP function in ILVs formation could also control Aβ40 secretion by impacting the release of ILVs as exosomes. The colocalisation we found between CD2AP and APP and the super‐resolution imaging of endosomes suggest that CD2AP function to sort APP at the endosomal membrane for translocation to the endosomal lumen. CD2AP is a regulator of actin dynamics 19, 76. Actin is implicated in clustering of receptors 77, which initiates sorting into MVBs. Sequentially ubiquitination of APP and CD2AP 16, 78 and/or CD2AP interaction with members of the MVB machinery, endosomal sorting complexes required for transport‐1 (ESCRT‐1) and Alix 79, could recruit the ESCRT machinery for ILVs formation. Mechanistically, further research is required to determine how CD2AP could contribute to MVB formation. In turn, we propose that in late‐onset AD patients with variants in CD2AP, there is a loss of function of CD2AP leading to APP accumulation at the endosomal membrane precluding its degradation and promoting APP encounter with BACE1 and increasing Aβ generation (Fig 8C).
Bin1 and CD2AP as AD risk factors
Our data suggest that loss of function of Bin1 and CD2AP would be sufficient to increase Aβ levels over time in patients carrying Bin1 or CD2AP variants thus increasing the risk of developing the ageing‐associated late‐onset AD. Interestingly, we found loss of function of CD2AP or Bin1 to recapitulate the early endosome enlargement that occurs early on in AD 80. In the future, because AD is often multifactorial, it will be necessary to determine whether variants of Bin1 and CD2AP alone can trigger AD or whether they require the presence of comorbidities or other associated genetic risk factors. As important will be to determine the impact of AD variants of BIN1 and CD2AP on their expression and/or function. Interestingly, rare AD‐associated coding mutations were found in Bin1 (K385R) and CD2AP (K633R) and predicted to be deleterious 81 requiring further confirmation and functional analysis. Nevertheless, our findings on Bin1 and CD2AP add to previous work on the other AD genetic risk factors Sorl1 and PICALM, establishing the dysfunction of the endocytic pathway as an early event and likely causal of AD.
We uncover the mechanisms by which CD2AP and Bin1 segregate APP and BACE1 at early endosomes of healthy neurons and whereby their loss of function may contribute to late‐onset AD. APP and BACE1 segregation at early endosomes is maybe the last step of cellular control of the amyloidogenic encounter after APP and BACE1 initial segregation at the exit from the TGN 13 and during endocytosis from the plasma membrane 10. Together, these local regulatory mechanisms of intracellular trafficking keep APP and BACE1 apart to keep Aβ generation low. Importantly, we identify a polarisation of APP and BACE1 convergence and Aβ generation at early endosomes specific to axons and dendrites.
Materials and Methods
Cell cultures and transfections
Primary neuronal cultures were prepared as previously reported 82 from cortices and hippocampi of embryonic day 16 (E16) wild‐type females and males BALB/c mice (Instituto Gulbenkian Ciência and CEDOC). Briefly, E16 brains were dissociated by trypsinisation and trituration in DMEM with 10% foetal bovine serum (Heat‐Inactivated FBS, Life Technologies). Dissociated neurons were cultured on poly‐D‐lysine (Sigma‐Aldrich)‐coated plates (1 × 10⁵ cells/cm2) and glass coverslips (5 × 10⁴ cells/cm2) and maintained in Neurobasal medium supplemented with B27, GlutaMAX and penicillin/streptomycin (all from Life Technologies) at 37°C in 5% CO2.
Neuroblastoma Neuro2a (N2a) cells (ATCC CCL‐131) were a gift from Zsolt Lenkei (ESPCI‐ParisTech). Cells were grown in DMEM‐GlutaMAX (Life Technologies) with 10% FBS (Sigma‐Aldrich) at 37°C in 5% CO2. For expression of cDNA, N2a cells and primary neurons (8 DIV) were transiently transfected with 0.5–1 μg of cDNA with Lipofectamine 2000 (Life Technologies). Cells were analysed after 24 h of treatment. Only mycoplasma‐free cells were used.
For small interfering RNA (siRNA) treatment, N2a cells or primary neurons (DIV6) were transiently transfected with 10 nM specific siRNA with Lipofectamine RNAiMax (Life Technologies). Cells were analysed after 72 h of treatment. When indicated, cDNA was transfected after 48 h of siRNA treatment and cells were analysed after 24 h.
When indicated, γ‐secretase was inhibited by overnight or 48 h of treatment with 250 nM DAPT (Calbiochem), BACE1 was inhibited by overnight treatment with 10 μM compound IV (Calbiochem) 10, or DMSO (solvent) was used as control.
For assessing endogenous Bin1 and CD2AP distribution (Fig EV5), neurons were analysed at 21 DIV.
For assessing APP lysosomal degradation (Fig EV3D), 11–12DIV neurons were treated for 1 h with 200 μM leupeptin hemisulfate (Calbiochem), an inhibitor of lysosomal hydrolases 83.
For live cell imaging, primary neurons were grown on glass‐bottom dishes. Prior imaging, the medium was exchanged for 37°C pre‐warmed imaging medium (120 mM NaCl, 3 mM KCl, 2 mM CaCl2, 2 mM MgCl2, 10 mM glucose, 10 mM HEPES) supplemented with 1X B27.
All experiments were carried out in at least three independent sets of culture. Only samples judged of insufficient technical quality were excluded.
cDNA and siRNA
We used the following DNA plasmids encoding: BACE1‐GFP was a gift from S. Miserey‐Lenkei (Institut Curie); APP‐RFP was a gift from S. Kins (University of Kaiserslautern); Rab5‐GFP, Rab5‐mCherry and Rab5QL‐GFP plasmids were a gift from M. Arpin (Institut Curie); CD2AP‐GFP was a gift from M. Cormont (University of Nice); neuronal Bin1‐myc (iso1) and ubiquitous Bin1‐myc (iso9) constructs from C. Leprince (University of Toulouse); C99 construct 84 was a gift from V. Morais (IMM, Lisbon); FLAG‐BACE1‐GFP was generated by site‐directed mutagenesis (NZYtech) of BACE1‐GFP with a FLAG epitope being introduced after the pro‐peptide cleavage site of BACE1 (primers 5′GCTGCGGCTGCCCCGGGACTACAAAGACGATGACGACAAGGAGACCGACGAAGAGC3′ and 5′GCTCTTCGTCGGTCTCCTTGTCGTCATCGTCTTTGTAGTCCCGGGGCAGCCGCAGC3′). Neuronal and ubiquitous Bin1 resistant to siBin1 were generated by site‐directed mutagenesis of neuronal Bin1‐myc (iso1) and ubiquitous Bin1‐myc (iso9) with five silent mutations introduced in the siRNA target sequence (primers: 5′CCGGCTGCAGAAGGACCTCCGGACGTACCTTGCTTCTGTTAAAGCG3′ and 5′CGCTTTAACAGAAGCAAGGTACGTCCGGAGGTCCTTCTGCAGCCGG3′. All plasmids were verified by sequencing.
We used the following siRNA oligonucleotides: as siControl a non‐targeting control siRNA (GeneCust); for knockdown of Bin1, siBin1 (Life Technologies) 48; for knockdown of CD2AP, siCD2AP (Santa Cruz) 20.
Antibodies
The following antibodies were used: anti‐Ankyrin‐G pAb (P‐20, Santa Cruz, cat sc‐31778, 1:100); anti‐APP mAb (22C11, Millipore, cat MAB348, 1:100); anti‐APP mAb (4G8, Covance, cat SIG‐39220, 1:350); anti‐APP (Y188, GeneTex, cat GTX61201, 1:200; 1:1,000); anti‐Aβ42 mAb (12F4, Millipore, cat 05‐831‐l, 1:50); anti‐Aβ42 mAb (H31L21, Invitrogen, cat 700254, 1:200); anti‐Aβ40 pAb (Millipore, cat AB5074P, 1:100); anti‐BACE1 pAb (Thermo Scientific, cat PA1‐757, 1:850); anti‐Bin1 mAb (99D, Millipore, cat 05‐449, IF 1:100, WB 1:1,000); anti‐CD2AP pAb (Santa Cruz, cat sc‐9137, IF 1:100, WB 1:1,000, IP 1:350); anti‐EEA1 pAb (N‐19, Abcam, cat sc‐6415, 1:50); anti‐FLAG (M1) mAb (Sigma, cat F3040, 1:300); anti‐MAP2 mAb (Sigma, M4403, 1:500); anti‐Myc pAb (1:500) 85; anti‐nicastrin pAb (Thermo Scientific, cat PA1‐758, 1:500); anti‐tubulin mAb (Tu‐20, Millipore, cat MAB1637, 1:10,000).
Immunofluorescence labelling
N2a cells were fixed with 4% paraformaldehyde for 10 min and neurons with 4% paraformaldehyde/4% sucrose for 20 min 5, 86. Cells were permeabilised with 0.1% saponin for 1 h before antibody incubation using standard procedure. For surface labelling, cells were incubated with secondary antibodies prior to permeabilisation. Coverslips were then mounted using FluoroMount (Southern Biotech).
Image acquisition
Epifluorescence microscopy was carried out on an upright microscope Z2 (Carl Zeiss) equipped a 60× NA‐1.4 oil immersion objective and an AxioCam MRm CCD camera (Carl Zeiss) or on an upright microscope DMRA2 (Leica) equipped with a 100× NA‐1.4 oil immersion objective and a CoolSnap HQ camera (Photometrics). Spinning‐disc confocal microscopy was performed with a Revolution xD (Andor) spinning‐disc system coupled to an Eclipse Ti‐E microscope (Nikon). Time‐lapse imaging was performed on a Revolution xD (Andor) confocal spinning‐disc system coupled to an Eclipse Ti‐E microscope (Nikon). During imaging, temperature was maintained at 37°C using a temperature‐controlled stage. Neurons expressing exogenous protein similarly to endogenous were selected for imaging. For direct comparison, samples were imaged in parallel and using identical acquisition parameters.
Super‐resolution microscopy
dSTORM was performed as previously described 87. Briefly, upon treatment neurons were fixed and immunolabelled as described above except that upon incubation (1 h) with donkey Alexa647 anti‐goat antibody (Molecular Probes), a second fixation was performed with 4% paraformaldehyde for 5 min. This procedure was repeated with a second secondary antibody, goat FLIP anti‐rabbit (Abberior). Tetraspeck beads (100‐nm diameter; Invitrogen) were added and samples mounted with dSTORM buffer (160 μl of PBS; 20 μl of MEA: 77 mg of cysteamine in 1 ml of 360 mM HCl; 20 μl of 40% glucose; 2 μl of oxygen scavenger: 14 mg of glucose oxidase, 200 μl of 10 mM Tris (pH 8), 50 nM of NaCl, 50 μl of catalase at 20 mg/ml) in a convex microscopy slide up to two hours prior imaging. Neurons were selected using low‐intensity illumination by epifluorescence microscopy with a Nikon 100× NA‐1.45 objective and a Hamamatsu Flash 4 camera. After TIRF illumination was switched on, and a dSTORM image stream acquisition was performed for the 647 channel (635‐nm laser excitation at 300 W/cm2, 662–690 nm emission) and then for the FLIP channel (561 nm laser excitation at 250 W/cm2, 589–625 nm emission), each composed of 10,000–20,000 images acquired at 20‐ms exposure time. Imaging parameters were set using μManager. Image reconstructions were performed using the ThunderSTORM ImageJ plugin (NIH) 88. When necessary, images were aligned based on the beads detected and drift was automatically corrected using ThunderSTORM autocorrelation option.
Trafficking assays
For APP degradation (Fig 3E), biotinylation of surface APP was performed as previously described 82. Briefly, following treatment, neurons were incubated on ice with 0.5 mg/ml Sulfo‐NHS‐LC‐Biotin (Pierce) for 30 min. Cells were rinsed and lysates were prepared (0 min) or chased for 20 and 60 min at 37°C. Biotinylated proteins were immunoprecipitated with NeutrAvidin agarose beads (Pierce) and after washing separated by SDS–PAGE. Quantitative immunoblotting was performed using anti‐APP (Y188) antibody in biotinylated proteins and total proteins.
For APP endocytosis (Fig 2A), cells expressing APP‐RFP were starved in serum‐free medium (30 min), incubated with anti‐APP (22C11) in complete medium with 10 mM HEPES for 10 min (pulse) (Figs 2B, 3A, and EV3C), washed and chased for 60 min (Figs 2D, 3C, and EV3C and E). Upon 10 or 60 min endocytosis, cells were fixed and immunolabelled or co‐labelled for EEA1 (Fig 5A and Appendix Fig S1A).
For BACE1 endocytosis (Fig 2F), cells expressing FLAG‐BACE1‐GFP were starved in serum‐free medium (30 min), incubated with anti‐FLAG (M1) for 5 min (Figs 2G and EV5D), 15 min (Fig 4A) or chased for 60 min (Fig EV4C).
For BACE1 and APP recycling, N2a cells pulsed with M1 or 22C11 for 10 min and neurons pulsed with M1 for 15 min were acid stripped (0.5 M NaCl, 0.2 M acetic acid; 4 s) and quickly rinsed in PBS before recycling for 20 min at 37°C. Cells were either fixed and recycled proteins were immunolabelled at the plasma membrane before permeabilisation (Figs 2I, 4C, and EV3B) or a second acid stripping was performed before fixation and non‐recycled proteins were immunolabelled upon permeabilisation (Figs 2K, 5C, EV4D, and Appendix Fig S1B).
For surface labelling (Figs EV3A and EV4A and B), antibodies were pulsed for 4 min at 37°C. After fixation, surface‐bound proteins were immunodetected on non‐permeabilised cells.
Quantitative analyses
Image analyses were carried out using ImageJ (https://imagej.nih.gov/ij/) or Fiji (https://fiji.sc/).
For the quantification of intracellular Aβ42 and Aβ40 levels: in N2a cells (Figs EV1 and EV2C and D), a region based on the cell boundary was outlined; in neurons (Fig 1A), several regions were outlined, cell body, ~20‐μm segments in dendrites and in axons using “polygon selection” tool based on GFP signal and on neuronal morphology. The average fluorescence of Aβ42 or Aβ40 in each region and of a background region was quantified with “Measure” function. Upon background fluorescence subtraction, the average fluorescence per region was calculated as percentage of the indicated control.
For the quantification of APP and BACE1 endocytosis, recycling, degradation and surface levels (Figs 2, 3A and C, 4A and C, EV3, and EV4), the fluorescence of anti‐APP (22C11) and anti‐FLAG (M1) was quantified as described above. In addition, the average fluorescence intensities of APP‐RFP or BACE1‐GFP were quantified in the same region. For N2a cells, the 22C11 or M1 average fluorescence was normalised per single cell to APP‐RFP or BACE1‐GFP fluorescence, respectively; for neurons, the average fluorescence of 22C11 or M1 in cell body, dendrites and axons was normalised to APP‐RFP or BACE1‐GFP fluorescence, respectively, in the cell body. The normalised values were calculated as percentage of the indicated control.
For line profile analyses (Figs 1B and C, and 7E and F), the fluorescence intensity profile was measured with the “Plot profile” function along a 1 pixel‐wide line drawn along the indicated region using the “segmented line” tool.
For quantification of colocalisation (Figs 3I and L, 4G and J, 5B and D, 7B, EV5G and I, and Appendix Fig S1), the area overlap was calculated as the percentage of overlapping pixels between puncta of the indicated proteins, segmented by threshold, in a ~20‐μm segment outlined in neurites. Overlapping pixels were obtained by creating and transferring selections based on the puncta of one of the indicated proteins (“Create selection” tool) onto the second marker using the “Restore selection” tool.
For the quantification of APP and BACE1 dynamic colocalisation (Fig 5E and G), the number of APP vesicles positive for BACE1 were counted by analysis of the movies kymographs. Kymographs were generated by time projections, using Z‐project, of images obtained using “reslice” of axonal or dendritic segments defined using “Polygon selection”. Time‐lapse movies were enhanced by identical post‐processing using “Bandpass filter”, “Unsharp mask” and photobleaching correction by histogram matching using “Bleach correction”.
For the quantification of BACE1 tubules (Fig 6A), the percentage of neurons displaying extended BACE1 carriers was determined by visual inspection. For the quantification of the number and length of BACE1 tubules (Fig 6C and D), the circularity of each BACE1 carrier, segmented based on threshold, was quantified in ~20‐μm segments of axons and dendrites and considered to be a tubule when the circularity was inferior to 0.5 using “Analyse particles”. The length of each tubule was also quantified.
For the quantification of the number of endosomes with APP in the lumen or at the endosomal membrane (Fig 7C and H), counting was done by visual inspection.
For quantification of APP on endosomal membrane (Fig 7G): first, Rab5QL endosomes were outlined using “Polygon selection”, and a selection created. Endosome selection was transferred onto APP, and its fluorescence was measured. Second, the endosomal membrane was segmented based on Rab5QL fluorescence and a region was created. The endosomal membrane region was transferred onto APP, and thresholded fluorescence was measured. The percentage of APP fluorescence located on the endosomal membrane was then determined.
For quantification of APP puncta distance to endosomal centroid over the endosomal radius (Fig 7J), the EEA1‐positive endosomes and APP were delineated using “Oval selection”, the centroids determined using “Measure” and the distance between the two centroids calculated. The radius of the endosome was determined as r = (A/π)1/2. For the measurement of endosomes area (Fig EV5J and K), EEA1 or Rab5 fluorescence was thresholded in ~20‐μm dendritic or axonal segments and the average area was determined using “Analyse particles”.
Most quantifications were made using automatic tools on randomly acquired images. In the few instances that we quantified data based on visual inspection, complementary automatic quantifications were performed.
Enzyme‐linked immunosorbent assays
Secreted murine endogenous Aβ1‐40 and Aβ1‐42 were measured from the medium collected with protease inhibitor cocktail (PIC) after siRNA treatment of neurons using enzyme‐linked immunosorbent assay (ELISA) kits specific for murine Aβ40 and Aβ42 (Invitrogen). Each sample was measured in duplicate using an InfiniTE 1000 microplate reader (Tecan). For each sample, values were normalised for protein concentration measured using the DC protein assay (Bio‐Rad).
Immunoblotting
Cell lysates were prepared using modified RIPA buffer (50 mM Tris–HCl pH 7.4, 1% NP‐40, 0.25% sodium deoxycholate, 150 mM NaCl, 1 mM EGTA, 0.1% SDS, with PIC). Proteins separated by 7.5, 10 or 15% Tris‐glycine SDS–PAGE were transferred to nitrocellulose membranes and processed for immunoblotting using ECL Prime kit (GE Healthcare). Images of immunoblots were captured using ChemiDoc (Bio‐Rad) within the linear range and quantified by densitometry using the “Analyse gels” function in ImageJ.
Statistics
Sample size was determined based on pilot studies. Statistical significance for at least three independent experiments was determined on normal data (D'Agostino‐Pearson omnibus normality test) by two‐tailed Student's t‐test and for multiple comparisons one‐way ANOVA with Tukey's test using GraphPad Prism 6. Statistical significance for nonparametric data was tested by Mann–Whitney test.
Ethics statement
All experimental procedures were performed according to EU recommendations and approved by: Instituto Gulbenkian de Ciência Animal Care and Ethical Committee; the NMS‐UNL ethical committee (07/2013/CEFCM) and the national DGAV (0421/000/000/2013).
Author contributions
FU and CGA conceived the project, wrote the manuscript, generated and analysed most of the data; TB performed most of the Western blots and helped FU with the ELISA; LS performed the biotinylation experiments; RG performed the APP processing experiments; CF characterised the CD2AP siRNA treatment; NM helped generate and analyse the dSTORM data.
Conflict of interest
The authors declare that they have no conflict of interest.
Supporting information
Appendix
Expanded View Figures PDF
Movie EV1
Movie EV2
Movie EV3
Source Data for Expanded View
Review Process File
Source Data for Figure 1
Source Data for Figure 3
Acknowledgements
We thank for the gift of plasmids Dr. S. Miserey‐Lenkei (Institut Curie); Dr. S. Kins (University of Kaiserslautern); Dr. M. Arpin (Institut Curie); Dr. M. Cormont (Univ. Nice); Dr. C. Leprince (University of Toulouse); Dr. V. Morais (IMM, Lisbon). We thank T. Marques, D. Fernandes and A. Pliassova for their technical assistance with Aβ measurements in N2a cells. We thank Dr. I. Martinsson for his technical expertise. We thank Dr. M. Rebelo (IGC Animal Facility) and Dr. S. Marques (CEDOC Animal Facility). We thank Dr. N. Pimpão (IGC) and Dr. T. Pereira (CEDOC) for their expertise in microscopy. We thank Dr. E. Gomes for Bin1 siRNA, for helpful discussions and for critical reading of the manuscript. We thank Dr. A. Gontijo, Prof. G. K. Gouras and Dr. T. Maia for critical reading of the manuscript. This work has been supported by: Marie Curie Integration Grant (334366 TrafficInAD FP7‐PEOPLE‐2012‐CIG; Marie Curie Actions, EC); iNOVA4Health—UID/Multi/04462/2013, a program financially supported by Fundação para a Ciência e Tecnologia (FCT)/Ministério da Educação e Ciência, through national funds and co‐funded by FEDER under the PT2020 Partnership Agreement; Pest‐OE/EQB/LA0004/2013‐2014). The dSTORM microscopy was supported by RECI/BEX‐BCM/0083/2012 to NM (IGC). CGA is Investigator FCT (IF/00998/2012, FCT). FU has been the recipient of an FRM postdoctoral fellowship (SPE20130326599) and a FCT post‐doctoral fellowship (SFRH/BPD/94186/2013).
EMBO Reports (2017) 18: 102–122
References
- 1. Mucke L, Selkoe DJ (2012) Neurotoxicity of amyloid β‐protein: synaptic and network dysfunction. Cold Spring Harb Perspect Med 2: a006338 [DOI] [PMC free article] [PubMed] [Google Scholar]
- 2. Kaether C, Haass C, Steiner H (2006) Assembly, trafficking and function of gamma‐secretase. Neurodegener Dis 3: 275–283 [DOI] [PubMed] [Google Scholar]
- 3. Rajendran L, Annaert W (2012) Membrane trafficking pathways in Alzheimer's disease. Traffic 13: 759–770 [DOI] [PubMed] [Google Scholar]
- 4. Peric A, Annaert W (2015) Early etiology of Alzheimer's disease: tipping the balance toward autophagy or endosomal dysfunction? Acta Neuropathol (Berl) 129: 363–381 [DOI] [PMC free article] [PubMed] [Google Scholar]
- 5. Almeida CG, Takahashi RH, Gouras GK (2006) β‐Amyloid accumulation impairs multivesicular body sorting by inhibiting the ubiquitin‐proteasome system. J Neurosci 26: 4277–4288 [DOI] [PMC free article] [PubMed] [Google Scholar]
- 6. Takahashi RH, Milner TA, Li F, Nam EE, Edgar MA, Yamaguchi H, Beal MF, Xu H, Greengard P, Gouras GK (2002) Intraneuronal Alzheimer abeta42 accumulates in multivesicular bodies and is associated with synaptic pathology. Am J Pathol 161: 1869–1879 [DOI] [PMC free article] [PubMed] [Google Scholar]
- 7. Cirrito JR, Kang J‐E, Lee J, Stewart FR, Verges DK, Silverio LM, Bu G, Mennerick S, Holtzman DM (2008) Endocytosis is required for synaptic activity‐dependent release of amyloid‐beta in vivo. Neuron 58: 42–51 [DOI] [PMC free article] [PubMed] [Google Scholar]
- 8. Rajendran L, Schneider A, Schlechtingen G, Weidlich S, Ries J, Braxmeier T, Schwille P, Schulz JB, Schroeder C, Simons M et al (2008) Efficient inhibition of the Alzheimer's disease beta‐secretase by membrane targeting. Science 320: 520–523 [DOI] [PubMed] [Google Scholar]
- 9. Zou L, Wang Z, Shen L, Bao GB, Wang T, Kang JH, Pei G (2007) Receptor tyrosine kinases positively regulate BACE activity and Amyloid‐β production through enhancing BACE internalization. Cell Res 17: 389–401 [DOI] [PubMed] [Google Scholar]
- 10. Sannerud R, Declerck I, Peric A, Raemaekers T, Menendez G, Zhou L, Veerle B, Coen K, Munck S, De Strooper B et al (2011) ADP ribosylation factor 6 (ARF6) controls amyloid precursor protein (APP) processing by mediating the endosomal sorting of BACE1. Proc Natl Acad Sci 108: E559–E568 [DOI] [PMC free article] [PubMed] [Google Scholar]
- 11. Grbovic OM, Mathews PM, Jiang Y, Schmidt SD, Dinakar R, Summers‐Terio NB, Ceresa BP, Nixon RA, Cataldo AM (2003) Rab5‐stimulated up‐regulation of the endocytic pathway increases intracellular beta‐cleaved amyloid precursor protein carboxyl‐terminal fragment levels and Abeta production. J Biol Chem 278: 31261–31268 [DOI] [PubMed] [Google Scholar]
- 12. Chia PZC, Toh WH, Sharples R, Gasnereau I, Hill AF, Gleeson PA (2013) Intracellular itinerary of internalised β‐Secretase, BACE1, and its potential impact on β‐Amyloid peptide biogenesis. Traffic 14: 997–1013 [DOI] [PubMed] [Google Scholar]
- 13. Das U, Scott DA, Ganguly A, Koo EH, Tang Y, Roy S (2013) Activity‐induced convergence of APP and BACE‐1 in acidic microdomains via an endocytosis‐dependent pathway. Neuron 79: 447–460 [DOI] [PMC free article] [PubMed] [Google Scholar]
- 14. Haass C, Schlossmacher MG, Hung AY, Vigo‐Pelfrey C, Mellon A, Ostaszewski BL, Lieberburg I, Koo EH, Schenk D, Teplow DB (1992) Amyloid beta‐peptide is produced by cultured cells during normal metabolism. Nature 359: 322–325 [DOI] [PubMed] [Google Scholar]
- 15. Edgar JR, Willén K, Gouras GK, Futter CE (2015) ESCRTs regulate amyloid precursor protein sorting in multivesicular bodies and intracellular amyloid‐β accumulation. J Cell Sci 128: 2520–2528 [DOI] [PMC free article] [PubMed] [Google Scholar]
- 16. Morel E, Chamoun Z, Lasiecka ZM, Chan RB, Williamson RL, Vetanovetz C, Dall'Armi C, Simoes S, Point Du Jour KS, McCabe BD et al (2013) Phosphatidylinositol‐3‐phosphate regulates sorting and processing of amyloid precursor protein through the endosomal system. Nat Commun 4: 2250 [DOI] [PMC free article] [PubMed] [Google Scholar]
- 17. Buggia‐Prévot V, Fernandez CG, Udayar V, Vetrivel KS, Elie A, Roseman J, Sasse VA, Lefkow M, Meckler X, Bhattacharyya S et al (2013) A function for EHD family proteins in unidirectional retrograde dendritic transport of BACE1 and Alzheimer's disease Aβ production. Cell Rep 5: 1552–1563 [DOI] [PMC free article] [PubMed] [Google Scholar]
- 18. Cormont M, Meton I, Mari M, Monzo P, Keslair F, Gaskin C, McGraw TE, Le Marchand‐Brustel Y (2003) CD2AP/CMS regulates endosome morphology and traffic to the degradative pathway through its interaction with Rab4 and c‐Cbl. Traffic Cph Den 4: 97–112 [DOI] [PubMed] [Google Scholar]
- 19. Lynch DK, Winata SC, Lyons RJ, Hughes WE, Lehrbach GM, Wasinger V, Corthals G, Cordwell S, Daly RJ (2003) A cortactin‐CD2‐associated protein (CD2AP) complex provides a novel link between epidermal growth factor receptor endocytosis and the actin cytoskeleton. J Biol Chem 278: 21805–21813 [DOI] [PubMed] [Google Scholar]
- 20. Gauthier NC, Monzo P, Gonzalez T, Doye A, Oldani A, Gounon P, Ricci V, Cormont M, Boquet P (2007) Early endosomes associated with dynamic F‐actin structures are required for late trafficking of H. pylori VacA toxin. J Cell Biol 177: 343–354 [DOI] [PMC free article] [PubMed] [Google Scholar]
- 21. Pant S, Sharma M, Patel K, Caplan S, Carr CM, Grant BD (2009) AMPH‐1/Amphiphysin/Bin1 functions with RME‐1/Ehd1 in endocytic recycling. Nat Cell Biol 11: 1399–1410 [DOI] [PMC free article] [PubMed] [Google Scholar]
- 22. Leprince C, Romero F, Cussac D, Vayssiere B, Berger R, Tavitian A, Camonis JH (1997) A new member of the amphiphysin family connecting endocytosis and signal transduction pathways. J Biol Chem 272: 15101–15105 [DOI] [PubMed] [Google Scholar]
- 23. Leprince C, Scolan EL, Meunier B, Fraisier V, Brandon N, Gunzburg JD, Camonis J (2003) Sorting nexin 4 and amphiphysin 2, a new partnership between endocytosis and intracellular trafficking. J Cell Sci 116: 1937–1948 [DOI] [PubMed] [Google Scholar]
- 24. Willnow TE, Petersen CM, Nykjaer A (2008) VPS10P‐domain receptors [mdash] regulators of neuronal viability and function. Nat Rev Neurosci 9: 899–909 [DOI] [PubMed] [Google Scholar]
- 25. Tebar F, Bohlander SK, Sorkin A (1999) Clathrin assembly lymphoid myeloid leukemia (CALM) protein: localization in endocytic‐coated pits, interactions with clathrin, and the impact of overexpression on clathrin‐mediated traffic. Mol Biol Cell 10: 2687–2702 [DOI] [PMC free article] [PubMed] [Google Scholar]
- 26. Bertram L, McQueen MB, Mullin K, Blacker D, Tanzi RE (2007) Systematic meta‐analyses of Alzheimer disease genetic association studies: the AlzGene database. Nat Genet 39: 17–23 [DOI] [PubMed] [Google Scholar]
- 27. Harold D, Abraham R, Hollingworth P, Sims R, Gerrish A, Hamshere ML, Pahwa JS, Moskvina V, Dowzell K, Williams A et al (2009) Genome‐wide association study identifies variants at CLU and PICALM associated with Alzheimer's disease. Nat Genet 41: 1088–1093 [DOI] [PMC free article] [PubMed] [Google Scholar]
- 28. Hollingworth P, Harold D, Sims R, Gerrish A, Lambert J‐C, Carrasquillo MM, Abraham R, Hamshere ML, Pahwa JS, Moskvina V et al (2011) Common variants at ABCA7, MS4A6A/MS4A4E, EPHA1, CD33 and CD2AP are associated with Alzheimer's disease. Nat Genet 43: 429–435 [DOI] [PMC free article] [PubMed] [Google Scholar]
- 29. Naj AC, Jun G, Beecham GW, Wang L‐S, Vardarajan BN, Buros J, Gallins PJ, Buxbaum JD, Jarvik GP, Crane PK et al (2011) Common variants at MS4A4/MS4A6E, CD2AP, CD33 and EPHA1 are associated with late‐onset Alzheimer's disease. Nat Genet 43: 436–441 [DOI] [PMC free article] [PubMed] [Google Scholar]
- 30. Rogaeva E, Meng Y, Lee JH, Gu Y, Kawarai T, Zou F, Katayama T, Baldwin CT, Cheng R, Hasegawa H et al (2007) The neuronal sortilin‐related receptor SORL1 is genetically associated with Alzheimer disease. Nat Genet 39: 168–177 [DOI] [PMC free article] [PubMed] [Google Scholar]
- 31. Scherzer CR, Offe K, Gearing M, Rees HD, Fang G, Heilman CJ, Schaller C, Bujo H, Levey AI, Lah JJ (2004) Loss of apolipoprotein E receptor LR11 in Alzheimer disease. Arch Neurol 61: 1200–1205 [DOI] [PubMed] [Google Scholar]
- 32. Zhao Z, Sagare AP, Ma Q, Halliday MR, Kong P, Kisler K, Winkler EA, Ramanathan A, Kanekiyo T, Bu G et al (2015) Central role for PICALM in amyloid‐β blood‐brain barrier transcytosis and clearance. Nat Neurosci 18: 978–987 [DOI] [PMC free article] [PubMed] [Google Scholar]
- 33. Ando K, Brion J‐P, Stygelbout V, Suain V, Authelet M, Dedecker R, Chanut A, Lacor P, Lavaur J, Sazdovitch V et al (2013) Clathrin adaptor CALM/PICALM is associated with neurofibrillary tangles and is cleaved in Alzheimer's brains. Acta Neuropathol (Berl) 125: 861–878 [DOI] [PubMed] [Google Scholar]
- 34. Andersen OM, Schmidt V, Spoelgen R, Gliemann J, Behlke J, Galatis D, McKinstry WJ, Parker MW, Masters CL, Hyman BT et al (2006) Molecular dissection of the interaction between amyloid precursor protein and its neuronal trafficking receptor SorLA/LR11. Biochemistry (Mosc) 45: 2618–2628 [DOI] [PubMed] [Google Scholar]
- 35. Chapuis J, Hansmannel F, Gistelinck M, Mounier A, Van Cauwenberghe C, Kolen KV, Geller F, Sottejeau Y, Harold D, Dourlen P et al (2013) Increased expression of BIN1 mediates Alzheimer genetic risk by modulating tau pathology. Mol Psychiatry 18: 1225–1234 [DOI] [PMC free article] [PubMed] [Google Scholar]
- 36. Glennon EBC, Whitehouse IJ, Miners JS, Kehoe PG, Love S, Kellett KAB, Hooper NM (2013) BIN1 is decreased in sporadic but not familial Alzheimer's disease or in aging. PLoS One 8: e78806 [DOI] [PMC free article] [PubMed] [Google Scholar]
- 37. Holler CJ, Davis PR, Beckett TL, Platt TL, Webb RL, Head E, Murphy MP (2014) Bridging integrator 1 (BIN1) protein expression increases in the Alzheimer's disease brain and correlates with neurofibrillary tangle pathology. J Alzheimers Dis JAD 42: 1221–1227 [DOI] [PMC free article] [PubMed] [Google Scholar]
- 38. Karch CM, Jeng AT, Nowotny P, Cady J, Cruchaga C, Goate AM (2012) Expression of novel Alzheimer's disease risk genes in control and Alzheimer's disease brains. PLoS One 7: e50976 [DOI] [PMC free article] [PubMed] [Google Scholar]
- 39. Sun L, Tan M‐S, Hu N, Yu J‐T, Tan L (2013) Exploring the value of plasma BIN1 as a potential biomarker for Alzheimer's disease. J Alzheimers Dis JAD 37: 291–295 [DOI] [PubMed] [Google Scholar]
- 40. Yu L, Chibnik LB, Srivastava GP, Pochet N, Yang J, Xu J, Kozubek J, Obholzer N, Leurgans SE, Schneider JA et al (2015) Association of brain DNA methylation in SORL1, ABCA7, HLA‐DRB5, SLC24A4, and BIN1 with pathological diagnosis of Alzheimer disease. JAMA Neurol 72: 15–24 [DOI] [PMC free article] [PubMed] [Google Scholar]
- 41. De Rossi P, Buggia‐Prévot V, Clayton BLL, Vasquez JB, van Sanford C, Andrew RJ, Lesnick R, Botté A, Deyts C, Salem S et al (2016) Predominant expression of Alzheimer's disease‐associated BIN1 in mature oligodendrocytes and localization to white matter tracts. Mol Neurodegener 11: 59 [DOI] [PMC free article] [PubMed] [Google Scholar]
- 42. Barral S, Bird T, Goate A, Farlow MR, Diaz‐Arrastia R, Bennett DA, Graff‐Radford N, Boeve BF, Sweet RA, Stern Y et al (2012) Genotype patterns at PICALM, CR1, BIN1, CLU, and APOE genes are associated with episodic memory. Neurology 78: 1464–1471 [DOI] [PMC free article] [PubMed] [Google Scholar]
- 43. Bali J, Gheinani AH, Zurbriggen S, Rajendran L (2012) Role of genes linked to sporadic Alzheimer's disease risk in the production of β‐amyloid peptides. Proc Natl Acad Sci 109: 15307–15311 [DOI] [PMC free article] [PubMed] [Google Scholar]
- 44. Shulman JM, Chen K, Keenan BT, Chibnik LB, Fleisher A, Thiyyagura P, Roontiva A, McCabe C, Patsopoulos NA, Corneveaux JJ et al (2013) Genetic susceptibility for Alzheimer disease neuritic plaque pathology. JAMA Neurol 70: 1150–1157 [DOI] [PMC free article] [PubMed] [Google Scholar]
- 45. Liao F, Jiang H, Srivatsan S, Xiao Q, Lefton KB, Yamada K, Mahan TE, Lee J‐M, Shaw AS, Holtzman DM (2015) Effects of CD2‐associated protein deficiency on amyloid‐β in neuroblastoma cells and in an APP transgenic mouse model. Mol Neurodegener 10: 12 [DOI] [PMC free article] [PubMed] [Google Scholar]
- 46. Takahashi RH, Almeida CG, Kearney PF, Yu F, Lin MT, Milner TA, Gouras GK (2004) Oligomerization of Alzheimer's beta‐amyloid within processes and synapses of cultured neurons and brain. J Neurosci Off J Soc Neurosci 24: 3592–3599 [DOI] [PMC free article] [PubMed] [Google Scholar]
- 47. Tampellini D, Rahman N, Gallo EF, Huang Z, Dumont M, Capetillo‐Zarate E, Ma T, Zheng R, Lu B, Nanus DM et al (2009) Synaptic activity reduces intraneuronal Aβ, promotes APP transport to synapses, and protects against Aβ‐related synaptic alterations. J Neurosci 29: 9704 [DOI] [PMC free article] [PubMed] [Google Scholar]
- 48. Falcone S, Roman W, Hnia K, Gache V, Didier N, Lainé J, Auradé F, Marty I, Nishino I, Charlet‐Berguerand N et al (2014) N‐WASP is required for Amphiphysin‐2/BIN1‐dependent nuclear positioning and triad organization in skeletal muscle and is involved in the pathophysiology of centronuclear myopathy. EMBO Mol Med 6: 1455–1475 [DOI] [PMC free article] [PubMed] [Google Scholar]
- 49. Monzo P, Gauthier NC, Keslair F, Loubat A, Field CM, Marchand‐Brustel YL, Cormont M (2005) Clues to CD2‐associated protein involvement in cytokinesis. Mol Biol Cell 16: 2891–2902 [DOI] [PMC free article] [PubMed] [Google Scholar]
- 50. Tossidou I, Niedenthal R, Klaus M, Teng B, Worthmann K, King BL, Peterson KJ, Haller H, Schiffer M (2012) CD2AP regulates SUMOylation of CIN85 in podocytes. Mol Cell Biol 32: 1068–1079 [DOI] [PMC free article] [PubMed] [Google Scholar]
- 51. Taylor MJ, Perrais D, Merrifield CJ (2011) A high precision survey of the molecular dynamics of mammalian clathrin‐mediated endocytosis. PLoS Biol 9: e1000604 [DOI] [PMC free article] [PubMed] [Google Scholar]
- 52. Miyagawa T, Ebinuma I, Morohashi Y, Hori Y, Young Chang M, Hattori H, Maehara T, Yokoshima S, Fukuyama T, Tsuji S et al (2016) BIN1 regulates BACE1 intracellular trafficking and amyloid‐β production. Hum Mol Genet ddw146 [DOI] [PubMed] [Google Scholar]
- 53. Chaufty J, Sullivan SE, Ho A (2012) Intracellular amyloid precursor protein sorting and amyloid‐β secretion are regulated by Src‐mediated phosphorylation of Mint2. J Neurosci 32: 9613–9625 [DOI] [PMC free article] [PubMed] [Google Scholar]
- 54. Vieira SI, Rebelo S, Esselmann H, Wiltfang J, Lah J, Lane R, Small SA, Gandy S, da Cruz e Silva EF, da Cruz e Silva OA (2010) Retrieval of the Alzheimer's amyloid precursor protein from the endosome to the TGN is S655 phosphorylation state‐dependent and retromer‐mediated. Mol Neurodegener 5: 40 [DOI] [PMC free article] [PubMed] [Google Scholar]
- 55. Haass C, Koo EH, Mellon A, Hung AY, Selkoe DJ (1992) Targeting of cell‐surface beta‐amyloid precursor protein to lysosomes: alternative processing into amyloid‐bearing fragments. Nature 357: 500–503 [DOI] [PubMed] [Google Scholar]
- 56. Matsuda S, Matsuda Y, Snapp EL, D'Adamio L (2011) Maturation of BRI2 generates a specific inhibitor that reduces APP processing at the plasma membrane and in endocytic vesicles. Neurobiol Aging 32: 1400–1408 [DOI] [PMC free article] [PubMed] [Google Scholar]
- 57. Buggia‐Prévot V, Fernandez CG, Riordan S, Vetrivel KS, Roseman J, Waters J, Bindokas VP, Vassar R, Thinakaran G (2014) Axonal BACE1 dynamics and targeting in hippocampal neurons: a role for Rab11 GTPase. Mol Neurodegener 9: 1 [DOI] [PMC free article] [PubMed] [Google Scholar]
- 58. Lasiecka ZM, Yap CC, Vakulenko M, Winckler B (2008) Chapter 7 Compartmentalizing the neuronal plasma membrane: from axon initial segments to synapses. Int Rev Cell Mol Biol 272: 303–389 [DOI] [PubMed] [Google Scholar]
- 59. Di Paolo G, Sankaranarayanan S, Wenk MR, Daniell L, Perucco E, Caldarone BJ, Flavell R, Picciotto MR, Ryan TA, Cremona O et al (2002) Decreased synaptic vesicle recycling efficiency and cognitive deficits in amphiphysin 1 knockout mice. Neuron 33: 789–804 [DOI] [PubMed] [Google Scholar]
- 60. Grant BD, Donaldson JG (2009) Pathways and mechanisms of endocytic recycling. Nat Rev Mol Cell Biol 10: 597–608 [DOI] [PMC free article] [PubMed] [Google Scholar]
- 61. Rajendran L, Honsho M, Zahn TR, Keller P, Geiger KD, Verkade P, Simons K (2006) Alzheimer's disease β‐amyloid peptides are released in association with exosomes. Proc Natl Acad Sci 103: 11172–11177 [DOI] [PMC free article] [PubMed] [Google Scholar]
- 62. Wegener CS, Malerød L, Pedersen NM, Prodiga C, Bakke O, Stenmark H, Brech A (2010) Ultrastructural characterization of giant endosomes induced by GTPase‐deficient Rab5. Histochem Cell Biol 133: 41–55 [DOI] [PubMed] [Google Scholar]
- 63. Das U, Wang L, Ganguly A, Saikia JM, Wagner SL, Koo EH, Roy S (2016) Visualizing APP and BACE‐1 approximation in neurons yields insight into the amyloidogenic pathway. Nat Neurosci 19: 55–64 [DOI] [PMC free article] [PubMed] [Google Scholar]
- 64. Sannerud R, Esselens C, Ejsmont P, Mattera R, Rochin L, Tharkeshwar AK, De Baets G, De Wever V, Habets R, Baert V et al (2016) Restricted location of PSEN2/γ‐secretase determines substrate specificity and generates an intracellular Aβ Pool. Cell 166: 193–208 [DOI] [PMC free article] [PubMed] [Google Scholar]
- 65. Gouras GK, Almeida CG, Takahashi RH (2005) Intraneuronal Abeta accumulation and origin of plaques in Alzheimer's disease. Neurobiol Aging 26: 1235–1244 [DOI] [PubMed] [Google Scholar]
- 66. Parton RG, Dotti CG (1993) Cell biology of neuronal endocytosis. J Neurosci Res 36: 1–9 [DOI] [PubMed] [Google Scholar]
- 67. Rodriguez‐Boulan E, Kreitzer G, Müsch A (2005) Organization of vesicular trafficking in epithelia. Nat Rev Mol Cell Biol 6: 233–247 [DOI] [PubMed] [Google Scholar]
- 68. Wigge P, Köhler K, Vallis Y, Doyle CA, Owen D, Hunt SP, McMahon HT (1997) Amphiphysin heterodimers: potential role in clathrin‐mediated endocytosis. Mol Biol Cell 8: 2003–2015 [DOI] [PMC free article] [PubMed] [Google Scholar]
- 69. Ramjaun AR, McPherson PS (1998) Multiple amphiphysin II splice variants display differential clathrin binding: identification of two distinct clathrin‐binding sites. J Neurochem 70: 2369–2376 [DOI] [PubMed] [Google Scholar]
- 70. Stoorvogel W, Oorschot V, Geuze HJ (1996) A novel class of clathrin‐coated vesicles budding from endosomes. J Cell Biol 132: 21–33 [DOI] [PMC free article] [PubMed] [Google Scholar]
- 71. Zhao Y, Keen JH (2008) Gyrating clathrin: highly dynamic clathrin structures involved in rapid receptor recycling. Traffic Cph Den 9: 2253–2264 [DOI] [PMC free article] [PubMed] [Google Scholar]
- 72. Ferguson SM, Raimondi A, Paradise S, Shen H, Mesaki K, Ferguson A, Destaing O, Ko G, Takasaki J, Cremona O et al (2009) Coordinated actions of actin and BAR proteins upstream of dynamin at endocytic clathrin‐coated pits. Dev Cell 17: 811–822 [DOI] [PMC free article] [PubMed] [Google Scholar]
- 73. Nicot A‐S, Toussaint A, Tosch V, Kretz C, Wallgren‐Pettersson C, Iwarsson E, Kingston H, Garnier J‐M, Biancalana V, Oldfors A et al (2007) Mutations in amphiphysin 2 (BIN1) disrupt interaction with dynamin 2 and cause autosomal recessive centronuclear myopathy. Nat Genet 39: 1134–1139 [DOI] [PubMed] [Google Scholar]
- 74. Picas L, Viaud J, Schauer K, Vanni S, Hnia K, Fraisier V, Roux A, Bassereau P, Gaits‐Iacovoni F, Payrastre B et al (2014) BIN1/M‐Amphiphysin2 induces clustering of phosphoinositides to recruit its downstream partner dynamin. Nat Commun 5: 5647 [DOI] [PubMed] [Google Scholar]
- 75. Kim JM, Wu H, Green G, Winkler CA, Kopp JB, Miner JH, Unanue ER, Shaw AS (2003) CD2‐associated protein haploinsufficiency is linked to glomerular disease susceptibility. Science 300: 1298–1300 [DOI] [PubMed] [Google Scholar]
- 76. Tang VW, Brieher WM (2013) FSGS3/CD2AP is a barbed‐end capping protein that stabilizes actin and strengthens adherens junctions. J Cell Biol 203: 815–833 [DOI] [PMC free article] [PubMed] [Google Scholar]
- 77. Morel E, Parton RG, Gruenberg J (2009) Annexin A2‐dependent polymerization of actin mediates endosome biogenesis. Dev Cell 16: 445–457 [DOI] [PubMed] [Google Scholar]
- 78. Ortega Roldan JL, Casares S, Ringkjøbing Jensen M, Cárdenes N, Bravo J, Blackledge M, Azuaga AI, van Nuland NAJ (2013) Distinct ubiquitin binding modes exhibited by SH3 domains: molecular determinants and functional implications. PLoS One 8: e73018 [DOI] [PMC free article] [PubMed] [Google Scholar]
- 79. Morita E, Sandrin V, Chung H‐Y, Morham SG, Gygi SP, Rodesch CK, Sundquist WI (2007) Human ESCRT and ALIX proteins interact with proteins of the midbody and function in cytokinesis. EMBO J 26: 4215–4227 [DOI] [PMC free article] [PubMed] [Google Scholar]
- 80. Cataldo AM, Peterhoff CM, Troncoso JC, Gomez‐Isla T, Hyman BT, Nixon RA (2000) Endocytic pathway abnormalities precede amyloid β deposition in sporadic Alzheimer's disease and Down syndrome: differential effects of APOE genotype and presenilin mutations. Am J Pathol 157: 277–286 [DOI] [PMC free article] [PubMed] [Google Scholar]
- 81. Vardarajan BN, Ghani M, Kahn A, Sheikh S, Sato C, Barral S, Lee JH, Cheng R, Reitz C, Lantigua R et al (2015) Rare coding mutations identified by sequencing of Alzheimer disease genome‐wide association studies loci. Ann Neurol 78: 487–498 [DOI] [PMC free article] [PubMed] [Google Scholar]
- 82. Almeida CG, Tampellini D, Takahashi RH, Greengard P, Lin MT, Snyder EM, Gouras GK (2005) Beta‐amyloid accumulation in APP mutant neurons reduces PSD‐95 and GluR1 in synapses. Neurobiol Dis 20: 187–198 [DOI] [PubMed] [Google Scholar]
- 83. Lee S, Sato Y, Nixon RA (2011) Lysosomal proteolysis inhibition selectively disrupts axonal transport of degradative organelles and causes an Alzheimer's‐like axonal dystrophy. J Neurosci 31: 7817 [DOI] [PMC free article] [PubMed] [Google Scholar]
- 84. Morais VA, Leight S, Pijak DS, Lee VM‐Y, Costa J (2008) Cellular localization of Nicastrin affects amyloid beta species production. FEBS Lett 582: 427–433 [DOI] [PubMed] [Google Scholar]
- 85. Chirivino D, Del Maestro L, Formstecher E, Hupé P, Raposo G, Louvard D, Arpin M (2011) The ERM proteins interact with the HOPS complex to regulate the maturation of endosomes. Mol Biol Cell 22: 375–385 [DOI] [PMC free article] [PubMed] [Google Scholar]
- 86. Almeida CG, Yamada A, Tenza D, Louvard D, Raposo G, Coudrier E (2011) Myosin 1b promotes the formation of post‐Golgi carriers by regulating actin assembly and membrane remodelling at the trans‐Golgi network. Nat Cell Biol 13: 779–789 [DOI] [PubMed] [Google Scholar]
- 87. Soares H, Henriques R, Sachse M, Ventimiglia L, Alonso MA, Zimmer C, Thoulouze M‐I, Alcover A (2013) Regulated vesicle fusion generates signaling nanoterritories that control T cell activation at the immunological synapse. J Exp Med 210: 2415–2433 [DOI] [PMC free article] [PubMed] [Google Scholar]
- 88. Ovesný M, Křížek P, Borkovec J, Svindrych Z, Hagen GM (2014) ThunderSTORM: a comprehensive ImageJ plug‐in for PALM and STORM data analysis and super‐resolution imaging. Bioinforma Oxf Engl 30: 2389–2390 [DOI] [PMC free article] [PubMed] [Google Scholar]
- 89. Udayar V, Buggia‐Prévot V, Guerreiro RL, Siegel G, Rambabu N, Soohoo AL, Ponnusamy M, Siegenthaler B, Bali J, AESG et al (2013) A paired RNAi and RabGAP overexpression screen identifies Rab11 as a regulator of β‐Amyloid production. Cell Rep 5: 1536–1551 [DOI] [PMC free article] [PubMed] [Google Scholar]
- 90. Lanz TA, Himes CS, Pallante G, Adams L, Yamazaki S, Amore B, Merchant KM (2003) The gamma‐secretase inhibitor N‐[N‐(3,5‐difluorophenacetyl)‐L‐alanyl]‐S‐phenylglycine t‐butyl ester reduces A beta levels in vivo in plasma and cerebrospinal fluid in young (plaque‐free) and aged (plaque‐bearing) Tg2576 mice. J Pharmacol Exp Ther 305: 864–871 [DOI] [PubMed] [Google Scholar]
- 91. Stachel SJ, Coburn CA, Steele TG, Jones KG, Loutzenhiser EF, Gregro AR, Rajapakse HA, Lai M‐T, Crouthamel M‐C, Xu M et al (2004) Structure‐based design of potent and selective cell‐permeable inhibitors of human beta‐secretase (BACE‐1). J Med Chem 47: 6447–6450 [DOI] [PubMed] [Google Scholar]
Associated Data
This section collects any data citations, data availability statements, or supplementary materials included in this article.
Supplementary Materials
Appendix
Expanded View Figures PDF
Movie EV1
Movie EV2
Movie EV3
Source Data for Expanded View
Review Process File
Source Data for Figure 1
Source Data for Figure 3