

Abstract
PEX13 is an integral membrane protein on the peroxisome that regulates peroxisomal matrix protein import during peroxisome biogenesis. Mutations in PEX13 and other peroxin proteins are associated with Zellweger syndrome spectrum (ZSS) disorders, a subtype of peroxisome biogenesis disorder characterized by prominent neurological, hepatic, and renal abnormalities leading to neonatal death. The lack of functional peroxisomes in ZSS patients is widely accepted as the underlying cause of disease; however, our understanding of disease pathogenesis is still incomplete. Here, we demonstrate that PEX13 is required for selective autophagy of Sindbis virus (virophagy) and of damaged mitochondria (mitophagy) and that disease‐associated PEX13 mutants I326T and W313G are defective in mitophagy. The mitophagy function of PEX13 is shared with another peroxin family member PEX3, but not with two other peroxins, PEX14 and PEX19, which are required for general autophagy. Together, our results demonstrate that PEX13 is required for selective autophagy, and suggest that dysregulation of PEX13‐mediated mitophagy may contribute to ZSS pathogenesis.
Keywords: autophagy, mitophagy, PEX13, virophagy, Zellweger syndrome
Subject Categories: Autophagy & Cell Death; Membrane & Intracellular Transport; Microbiology, Virology & Host Pathogen Interaction
Introduction
Fourteen human PEX genes have been characterized thus far, encoding peroxin proteins that function in various stages of peroxisome biogenesis, including membrane formation, import of peroxisomal matrix proteins, and peroxisome proliferation 1, 2. Peroxisomal membrane proteins have also been implicated as signaling platforms involved in reactive oxygen species (ROS)‐induced autophagy 3 and antiviral immunity 4. Similar to other PEX genes, PEX13 was originally identified and has been best studied in the context of its role in peroxisome biogenesis and ZSS 5, 6. Biochemically, many ZSS patients present with elevated levels of substrates normally processed by peroxisomes (e.g., very long‐chain fatty acids) and reduced levels of products normally synthesized by peroxisome metabolism (e.g., plasmalogens) 7. However, ZSS patients with normal peroxisome metabolite levels have been described, and the degree of peroxisomal metabolite abnormality does not always correlate with clinical severity 8, 9, 10. The discrepancy in the biochemical and clinical phenotypes of ZSS patients suggests that at least a subset of PEX mutations may contribute to ZSS disease pathogenesis via additional molecular mechanisms independently of their role in peroxisome biogenesis.
Autophagy is a highly conserved pathway in eukaryotes characterized by the formation of double‐membraned structures which deliver cytoplasmic contents to the lysosome for degradation 11, 12. In contrast to general autophagy, which nonselectively degrades cytoplasmic material to supply the cell with nutrients during starvation, selective autophagy functions during nutrient‐rich conditions to remove specific harmful or unwanted structures. Diverse substrates have been described for selective autophagy, including protein aggregates (aggrephagy), mitochondria (mitophagy), peroxisomes (pexophagy), ribosomes (ribophagy), ER (reticulophagy), intracellular pathogens (xenophagy), and lipid droplets (lipophagy) 13, 14. Dysregulation of selective autophagy underlies numerous human pathologies, including neurodegeneration, infectious diseases, metabolic diseases, cancer, and aging, thus highlighting the important physiological roles of selective autophagy 11, 15. Cargo selectivity is determined by autophagic receptors; these receptors facilitate autophagosome engulfment of the cargo by interacting with both the cargo (which is commonly ubiquitylated) and LC3 family members on the autophagosomal membrane. Despite recent advances in characterizing several receptors such as p62, optineurin, and NBR1, our understanding of selective autophagy regulation remains limited 13. Thus, we previously conducted a genomewide siRNA screen to discover novel selective autophagy factors and identified PEX13 as a candidate selective virophagy and mitophagy factor 16.
Results and Discussion
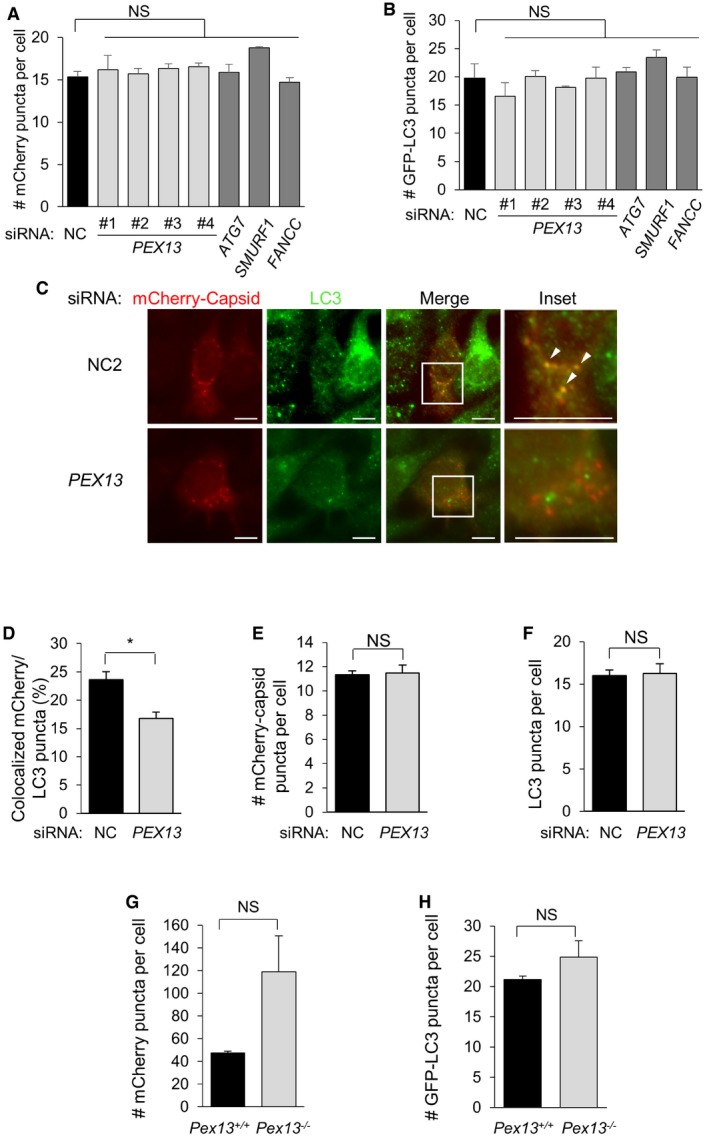
To evaluate whether PEX13 is a bona fide selective virophagy factor, we examined the colocalization of mCherry‐labeled capsid protein from Sindbis virus (SIN) and the autophagosomal marker GFP‐LC3 in cells with normal or reduced PEX13 expression. SIN is a single‐stranded RNA virus in the alphavirus family, and numerous previous studies have shown that SIN viral nucleocapsids are degraded by selective autophagy 16, 17, 18. In HeLa cells stably expressing GFP‐LC3 (HeLa/GFP‐LC3 cells) and infected with SIN, four siRNA oligos that target PEX13 (and decrease PEX13 expression [Fig 1A]) resulted in a decrease in colocalization between mCherry‐capsid and GFP‐LC3 puncta (Fig 1B and C). This decrease in colocalization was similar to that observed after knocking down ATG7, a core autophagy gene essential for autophagic vesicle elongation, and knocking down SMURF1 16 or FANCC 18, two previously described selective virophagy factors. The numbers of mCherry‐capsid puncta and GFP‐LC3 puncta were not decreased in PEX13‐deficient, SMURF1‐deficient, or FANCC‐deficient cells (Fig EV1A and B), suggesting that the defect in colocalization is likely due to a block in targeting the substrate to the autophagosome rather than deficiencies in either viral replication or autophagosome formation. (The failure of knockdown of ATG7, a core autophagy protein, to block overall numbers of GFP‐LC3 puncta but still decrease SIN capsid targeting to autophagosomes, is consistent with previous observations in the HeLa/VS cells used in this study 17, which are a cell line specifically adapted to be more permissive for alphavirus growth). Importantly, to exclude the possibility that SIN was targeted to GFP‐LC3 aggregates rather than true autophagosomes, we confirmed that PEX13 is required for colocalization between endogenous LC3 and mCherry‐capsid (Fig EV1C–F).
Figure 1. PEX13 is required for Sindbis virophagy but not general autophagy.
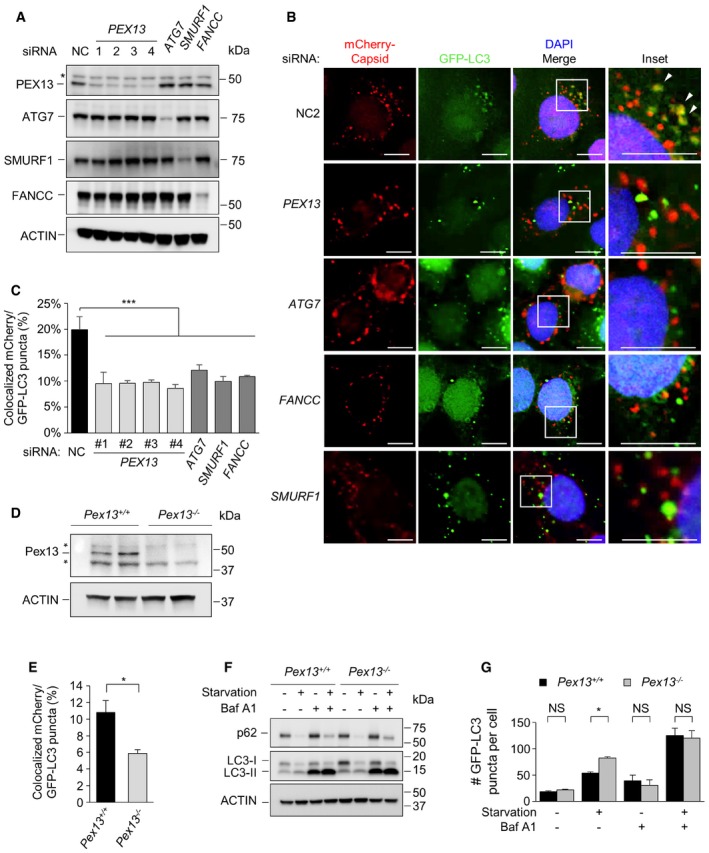
- Western blot detection of PEX13, ATG7, SMURF1, and FANCC in HeLa/GFP‐LC3 cells transfected with the indicated siRNA. Asterisk denotes nonspecific band.
- Representative images of GFP‐LC3 colocalization with mCherry‐capsid at 10 h after Sindbis virus (strain AO30) infection of HeLa/GFP‐LC3 cells treated with the indicated siRNA. siPEX13 oligo #2 is shown; similar results were observed with three other siPEX13 oligos. Arrowheads denote representative colocalized GFP‐LC3/mCherry‐capsid puncta. Scale bars, 10 μm.
- Quantification of colocalized GFP‐LC3 and mCherry‐capsid puncta normalized to the number of mCherry‐capsid puncta per cell (% colocalization) in the experiment shown in (B). Bars are mean ± SEM of triplicate samples (˜100 cells analyzed per sample). Similar results were observed in more than three independent experiments. ***P < 0.001; one‐way ANOVA with adjustment for multiple comparisons. See Fig EV1A and B for quantification of mCherry‐capsid puncta per cell and GFP‐LC3 puncta per cell from the same experiment.
- Western blot detection of Pex13 in MEFs of indicated genotype. Asterisks denote nonspecific bands.
- Quantification of colocalized GFP‐LC3 and mCherry‐capsid puncta normalized to the number of mCherry‐capsid puncta per cell (% colocalization) at 8 h after Sindbis virus (AO28 strain) infection in MEFs of the indicated genotype. Bars are mean ± SEM of triplicate samples (~100 cells analyzed per sample). Similar results were observed in more than three independent experiments. *P < 0.05; two‐tailed unpaired t‐test. See Fig EV1G and H for quantification of mCherry‐capsid puncta per cell and GFP‐LC3 puncta per cell from the same experiment.
- Western blot detection of p62 and LC3 in MEFs of indicated genotype treated with 100 nM Baf A1 or DMSO vehicle and cultured in normal medium (starvation “−”) or EBSS (starvation “+”) for 3 h. Similar results were observed in three independent experiments.
- Quantification of GFP‐LC3 puncta in MEFs of indicated genotype treated with 10 nM Baf A1 or DMSO vehicle and cultured in normal medium or HBSS (starvation “+”) for 3 h. Bars are mean ± SEM of triplicate samples (˜100 cells analyzed per sample). *P < 0.05; two‐tailed unpaired t‐test. NC, nonsilencing control.
Source data are available online for this figure.
Figure EV1. PEX13 is required for Sindbis virophagy.
-
A, BQuantification of mCherry‐capsid puncta per cell (A) and GFP‐LC3 puncta per cell (B) for experiment shown in Fig 1B and C in HeLa/GFP‐LC3 cells treated with the indicated siRNA and infected with SIN/mCherry‐capsid (AO30). Results represent mean ± SEM of triplicate samples (˜100 cells analyzed per sample). *P < 0.05, **P < 0.01, ***P < 0.001, NS = not significant; one‐way ANOVA with adjustment for multiple comparisons.
-
CRepresentative images of endogenous LC3 colocalization with mCherry‐capsid at 10 h after Sindbis virus (strain AO30) infection of HeLa cells treated with the indicated siRNA. Arrowheads indicate colocalization between mCherry‐capsid and LC3 puncta at 10 h after Sindbis virus (strain AO30) infection of HeLa cells treated with the indicated siRNA. Scale bars, 10 μm.
-
D–FQuantification of colocalized LC3 and mCherry‐capsid puncta normalized to the number of mCherry‐capsid puncta per cell (% colocalization) (D), mCherry‐capsid puncta per cell (E), and LC3 puncta per cell (F) in the experiment shown in (C). Bars are mean ± SEM of triplicate samples (˜70 cells analyzed per sample). *P < 0.05, NS = not significant; two‐tailed unpaired t‐test.
-
G, HQuantification of mCherry‐capsid puncta per cell (G) and GFP‐LC3 puncta per cell (H) for experiment shown in Fig 1E in MEFs infected with SIN/mCherry‐capsid/GFP‐LC3. Results represent mean ± SEM of triplicate samples (˜100 cells analyzed per sample). NS = not significant; two‐tailed unpaired t‐test.
We utilized murine embryonic fibroblasts (MEFs) derived from wild‐type Pex13 (Pex13 +/+) and knockout Pex13 (Pex13 −/−) embryos to further confirm whether Pex13 is required for SIN virophagy (Fig 1D and E). After infection with SIN expressing mCherry‐capsid and GFP‐LC3, Pex13 −/− MEFs showed a defect in the colocalization of mCherry‐capsid with GFP‐LC3, and no difference in the mCherry‐capsid or GFP‐LC3 puncta numbers (Figs 1E and EV1G and H). The defect in SIN virophagy in Pex13‐deficient MEFs is not due to a defect in general autophagy, as three well‐established assays to measure basal and starvation‐induced flux, including Western blot detection of p62 degradation, Western blot detection of LC3‐I to LC3‐II conversion, and quantitation of GFP‐LC3 puncta in the presence or absence of the lysosomal inhibitor, bafilomycin A1 (Baf A1), did not reveal any decreases in basal or starvation‐induced autophagic flux in Pex13 −/− MEFs (Fig 1F and G). Thus, taken together, our data indicate that PEX13 is required for selective virophagy but not for general autophagy in mammalian cells.
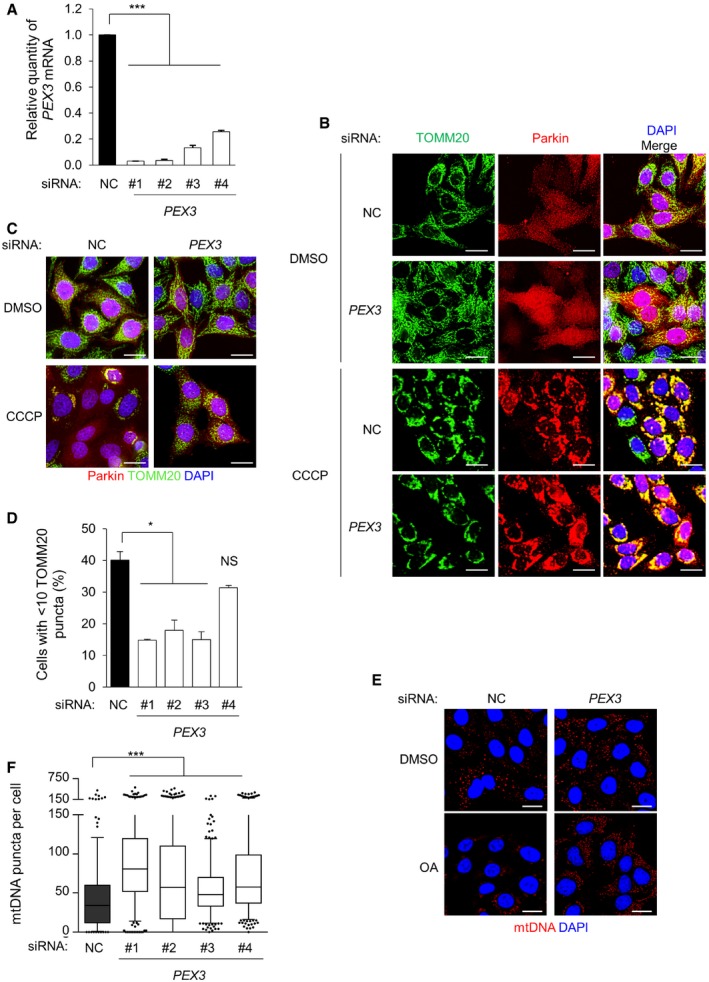
To evaluate whether PEX13 is a mitophagy factor, we first compared the effects of PEX13 and ATG7 siRNA knockdown on Parkin‐mediated mitophagy after treatment with the mitochondrial uncoupling agent carbonyl cyanide m‐chlorophenyl hydrazine (CCCP) using HeLa cells stably transfected with Parkin (HeLa/Parkin cells) (Figs 2A and B, and EV2A). PEX13 or ATG7 knockdown did not affect basal mitochondrial morphology as assessed by immunofluorescence imaging of TOMM20, a mitochondrial outer membrane protein (Fig 2A). After CCCP treatment, the majority of Parkin‐expressing cells treated with noncoding (NC) siRNA lacked TOMM20 signal, indicating clearance of damaged mitochondria (Fig 2A and B). In contrast, the clearance of damaged mitochondria was impaired after treatment with four different siRNAs targeted against PEX13; the level of impairment was similar to that observed after treatment with siRNA targeted against ATG7. At an early time point during mitophagy, we observed Parkin colocalization with TOMM20 even after PEX13 knockdown, suggesting that Parkin recruitment to the mitochondria is similar in PEX13‐deficient cells and control cells (Fig EV2B). We confirmed the role of PEX13 in mitophagy using a combination of more selective inhibitors of mitochondrial respiration, oligomycin, and antimycin A (OA) (as CCCP may have direct effects on lysosomal function 19) and by measuring the clearance of mitochondrial double‐stranded DNA (mtDNA) (as the proteasomal system can contribute to the degradation of mitochondrial outer membrane proteins such as TOMM20 but not to mtDNA 20). Our results indicate that four different siRNAs targeting PEX13 block OA‐induced mtDNA clearance as effectively as ATG7 siRNA (Fig 2C and D).
Figure 2. PEX13 is required for mitophagy.
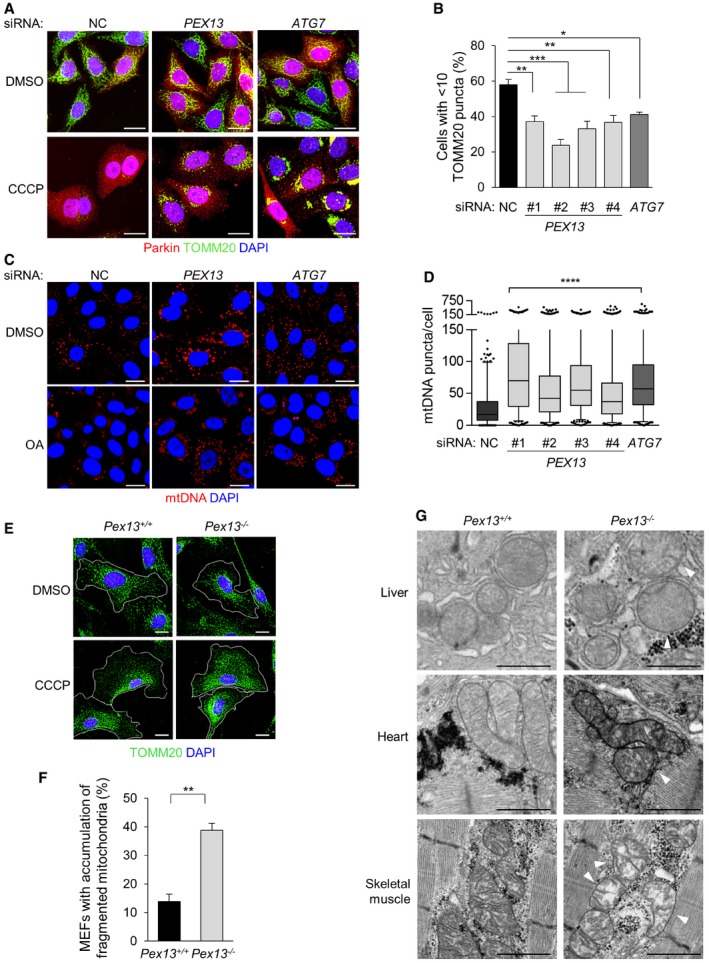
- Representative images of Parkin‐mediated clearance of mitochondrial outer membrane protein TOMM20 in HeLa/Parkin cells treated with indicated siRNA 16 h after treatment with 10 μM CCCP or DMSO vehicle control. siPEX13 oligo #2 is shown; similar results were observed with three other siPEX13 oligos. Scale bars, 20 μm.
- Quantification of TOMM20 clearance in the experiment shown in (A). Results represent mean ± SEM of triplicate samples (~100 cells analyzed per sample). Similar results were observed in more than three independent experiments. *P < 0.05, **P < 0.01, ***P < 0.001; one‐way ANOVA with adjustment for multiple comparisons.
- Representative images of Parkin‐mediated clearance of mitochondrial double‐stranded DNA (mtDNA) in HeLa/HA‐Parkin cells treated with indicated siRNA 8 h after treatment with 2.5 μM oligomycin and 250 nM antimycin A (OA) or DMSO vehicle control. siPEX13 oligo #1 is shown; similar results were observed with three other siPEX13 oligos. Nuclear DNA staining was masked using DAPI. Scale bars, 20 μm.
- Quantification of mtDNA clearance in the experiment shown in (C). Results represent box plots of ~300 cells analyzed per sample. Whiskers represent 5–95% range and the horizontal lines of the boxes indicate the 25th, 50th and 75th percentiles of the dataset. Each outlier is represented by a dot. Similar results were observed in three independent experiments. ****P < 0.0001; Kruskal–Wallis H‐test.
- Representative images of TOMM20 fragmentation or compaction around perinuclear region in MEFs of the indicated genotype 24 h after treatment with 30 μM CCCP or DMSO vehicle control. White lines indicate cell borders. Scale bars, 20 μm.
- Quantification of percentage of cells in experiment shown in (E) with accumulation of fragmented mitochondria after CCCP treatment. Results represent mean ± SEM of triplicate samples (~100 cells analyzed per sample). Similar results were observed in three independent experiments. **P < 0.01; two‐tailed unpaired t‐test.
- Electron microscopic analysis of E18.5 mouse embryonic liver, heart, and skeletal muscle. Shown are representative images from one mouse. Similar results were observed in three mice per genotype. Arrowheads indicate damaged mitochondria. Scale bars, 1 μm.
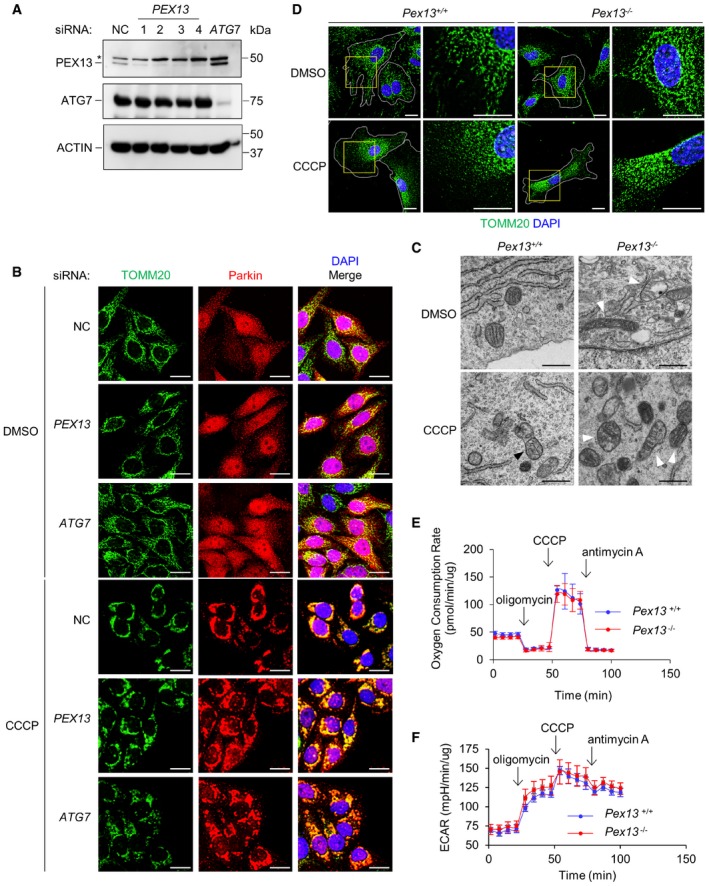
Figure EV2. PEX13 colocalization with Parkin during mitophagy and analysis of mitochondrial morphology and metabolism in Pex13 −/− MEFs.
-
AWestern blot detection of PEX13 and ATG7 in HeLa/Parkin cells transfected with the indicated siRNA. Asterisk denotes nonspecific band.
-
BRepresentative images of Parkin colocalization with TOMM20 in HeLa/Parkin cells treated with indicated siRNA after treatment with DMSO or 10 μM CCCP for 4 h. Scale bars, 20 μm.
-
CTransmission electron microscopic analysis of MEFs in control conditions or following CCCP‐induced mitochondrial damage. Shown are representative images of mitochondrial morphology in MEFs of the indicated genotype 24 h after treatment with 30 μM CCCP or DMSO vehicle control. Black arrowhead denotes autolysosome containing damaged mitochondria; white arrowheads denote mitochondria with abnormal cristae morphology. Scale bars, 500 nm.
-
DRepresentative images of TOMM20 staining in MEFs of the indicated genotype with DMSO or 30 μM CCCP for 24 h. Insets show reticular mitochondrial morphology during basal state and fragmented damaged mitochondria after CCCP treatment. White lines indicate cell borders. Scale bars, 20 μm.
-
E, FMitochondrial metabolism assay in primary MEFs of the indicated genotype. Mitochondrial oxygen consumption rate normalized to total protein level (E) and extracellular acidification rate (ECAR) adjusted to total protein level (F) are shown. Plot shows the average and SEM of 5 samples.
Source data are available online for this figure.
Next, we evaluated mitochondrial morphology and function in Pex13 +/+ and Pex13 −/− primary MEFs. During basal conditions, we observed similar reticular mitochondria morphology in Pex13 +/+ and Pex13 −/− MEFs, as assessed by TOMM20 immunostaining (Fig 2E). However, we did observe abnormal mitochondria with disorganized cristae in basal conditions in Pex13 −/− MEFs using electron microscopy (Fig EV2C). In MEFs, endogenous Parkin expression is negligible 20 and Parkin overexpression in primary MEFs does not promote the complete clearance of TOMM20 during CCCP or OA‐induced mitophagy as it does in HeLa cells. Instead, damaged mitochondria in primary MEFs undergo Parkin‐independent partial clearance and compaction around the perinuclear region 16. After CCCP treatment, TOMM20 staining showed that damaged mitochondria were compacted around the perinuclear region and partially degraded in Pex13 +/+ MEFs, whereas damaged mitochondrial fragments accumulated diffusely throughout the cytoplasm in Pex13 −/− MEFs (Figs 2E and F, and EV2D). Ultrastructurally, many autolysosomes containing mitochondria and only a few cytoplasmic damaged mitochondria were found in CCCP‐treated wild‐type MEFs (Fig EV2C), suggesting that damaged mitochondria were degraded via autophagy. In contrast, damaged mitochondria accumulated in CCCP‐treated Pex13 −/− MEFs (Fig EV2C). Of note, mitochondrial oxygen consumption and extracellular acidification rate were similar between Pex13 +/+ and Pex13 −/− MEFs, suggesting that Pex13 −/− MEFs have no major defect in mitochondrial biogenesis (Fig EV2E and F). Taken together, our data suggest that Pex13 facilitates removal of damaged mitochondria, even in primary fibroblasts that lack Parkin expression.
To evaluate whether Pex13 may function in mitophagy in vivo, we performed ultrastructural analysis of tissues from Pex13 +/+ and Pex13 −/− mouse embryos (as Pex13 −/− mice die neonatally). We found widespread abnormal mitochondrial cristae structures in Pex13 −/− livers, hearts, and skeletal muscles (Fig 2G), consistent with a previous report 21. Since autophagy is the only known pathway for degrading large cellular components such as organelles and protein aggregates and animals with tissue‐specific knockout of core autophagy genes accumulate similar morphologically abnormal mitochondria 11, these observations are consistent with an important homeostatic role of Pex13‐mediated mitophagy in regulating mitochondria quality in vivo. However, we cannot rule out that the accumulation of abnormal mitochondria in Pex13 knockout mice is due to factors other than defective mitophagy—either related to abnormal peroxisomal biogenesis or alterations in mitochondrial or proteasome functions which may contribute to mitochondrial quality control.
Our findings raised the possibility that patients with ZSS due to PEX13 mutations may have defects in selective autophagy. To test this hypothesis, we compared the effects of siRNA‐resistant wild‐type (WT) and disease‐associated mutation‐encoding PEX13 expression plasmids on the rescue of selective autophagy after PEX13 siRNA knockdown in HeLa/Parkin cells (Fig 3A–C). We focused on mitophagy rather than virophagy because HeLa cells and MEF cells are resistant to SIN infection after plasmid transfection. PEX13 I326T 22 and PEX13 W313G 23 are less stable than WT PEX13, but with higher concentration of plasmid transfection we observed similar levels of protein expression of WT and mutated PEX13 in HeLa/Parkin cells (Fig 3A). By immunofluorescence imaging, endogenous PEX13 was undetectable, but overexpressed WT and mutated PEX13 could both be detected (Fig 3B), and they colocalized with the peroxisomal marker PMP70 (Fig EV3A). siRNA‐resistant WT PEX13, but neither disease‐associated mutant, PEX13 I326T or PEX13 W313G, partially rescued the mitophagy defect in CCCP‐treated HeLa/Parkin cells with PEX13 knockdown (Fig 3C). Surprisingly, cells expressing the PEX13 I326T or PEX13 W313G mutants showed a greater mitophagy defect compared with cells with empty vector control (Fig 3C) and mitochondria in mutant transfected cells appeared fragmented and aggregated even during basal conditions (Fig EV3B). These data suggest that PEX13 proteins containing disease‐associated mutations are not only defective in mitophagy, they may also have a gain‐of‐function effect on interfering with basal mitochondria quality control.
Figure 3. siRNA‐resistant WT PEX13, but not disease‐associated mutants PEX13 I326T and W313G rescue the mitophagy defect in PEX13 knockdown cells.
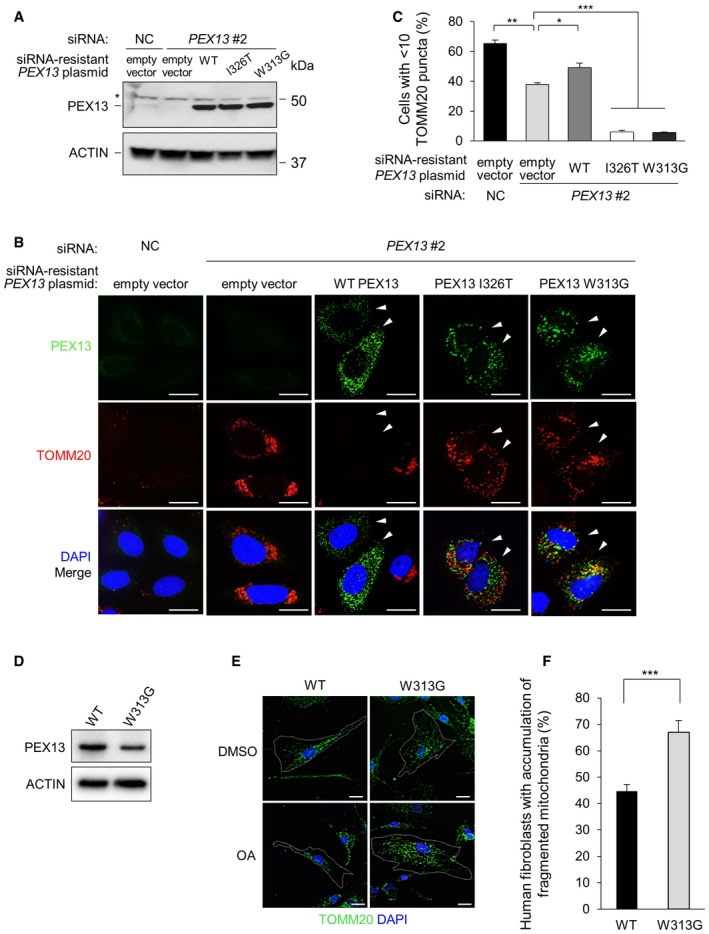
- Western blot detection of PEX13 in HeLa/Parkin cells transfected with indicated siRNA and siRNA‐resistant PEX13 plasmid. To achieve similar PEX13 protein expression levels, 0.75 μg PEX13 I326T and PEX13 W313G plasmids were transfected compared with 0.25 μg WT PEX13. Total plasmid level was adjusted using empty vector. Asterisk denotes nonspecific band.
- Representative images of Parkin‐mediated clearance of TOMM20 in HeLa/Parkin cells treated with PEX13 siRNA and transfected with indicated PEX13 siRNA‐resistant plasmid and then treated with CCCP (10 μM, 16 h). Arrowheads indicate cells expressing exogenous PEX13. Scale bars, 20 μm. See Fig EV3B for representative images of mitochondrial morphology (TOMM20 staining) in control cells treated with DMSO.
- Quantification of experiment shown in (B). Results represent mean ± SEM of triplicate samples (˜100 cells analyzed per sample). Similar results were observed in three independent experiments. *P < 0.05, **P < 0.01,***P < 0.001; two‐tailed unpaired t‐test.
- Western blot detection of PEX13 expression in wild‐type (WT) and PEX13 W313G (W313G) mutant primary human fibroblasts.
- Representative images of Parkin‐mediated clearance of TOMM20 in wild‐type (WT) and PEX13 W313G (W313G) mutant primary human fibroblasts treated with oligomycin (2.5 μM) + antimycin A (250 nM) for 24 h. Scale bars, 20 μm. W313G cells varied in morphology; outlined cell in upper right panel shows a representative cell with larger size and abnormal mitochondrial morphology (see Fig EV3C for higher resolution imaging) and outlined cell in lower right panel shows a representative cell with accumulation of fragmented mitochondria that would be scored as positive in (F).
- Quantification of experiment shown in (E). Results represent mean ± SEM of five groups of 10 images of random fields of cells (> 350 cells analyzed per sample). Similar results were observed in two independent experiments. ***P < 0.0001; two‐tailed unpaired t‐test.
Source data are available online for this figure.
Figure EV3. Disease‐associated PEX13 mutant protein colocalization with peroxisomes and effects on mitochondrial morphology, and structured illumination microscopic analyses of mitochondria in PEX13 patient mutant fibroblasts.
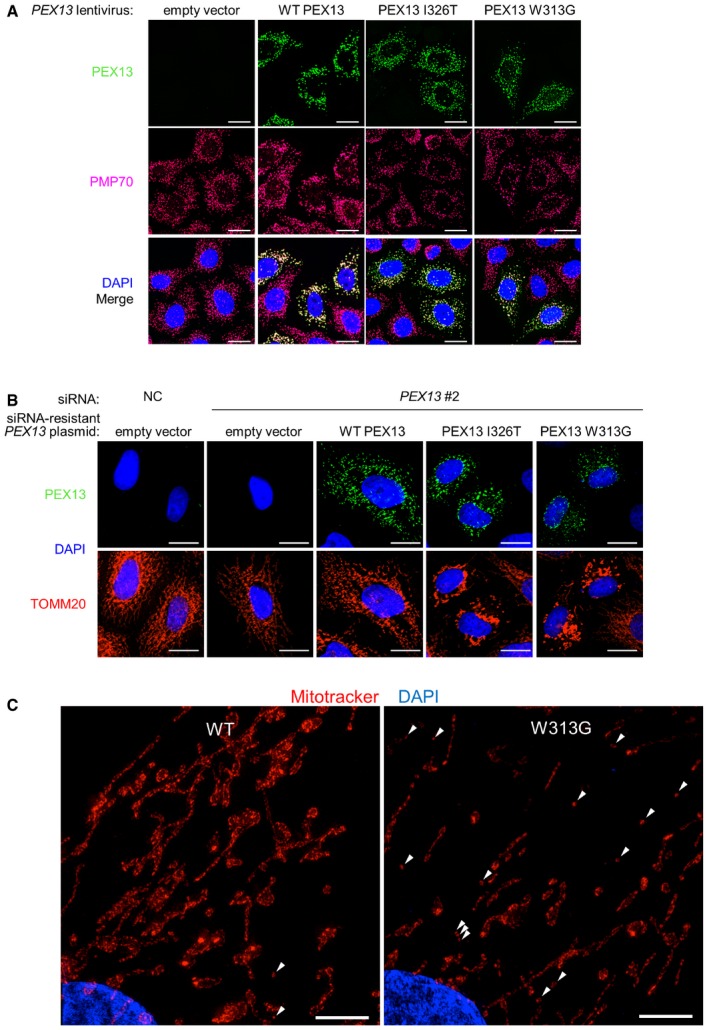
- Representative images of wild‐type and mutant PEX13 colocalization with PMP70 in HeLa/Parkin cells transduced with lentivirus containing the indicated PEX13‐MYC‐DDK cDNA. Scale bars, 20 μm.
- Representative images of TOMM20 morphology 16 h after DMSO vehicle treatment in HeLa/Parkin cells transfected with PEX13 siRNA and indicated PEX13 siRNA‐resistant plasmids. Scale bars, 20 μm.
- Representative structured illumination microscopy (SIM) 3D projections of wild‐type and PEX13 W313G mutant primary human fibroblasts treated with MitoTracker CMX rosamine (CMXROS, 50 nM, 30 min). White arrowheads indicate mitochondrial fragments. Scale bar, 5 μm.
To more directly evaluate whether cells from patients with PEX13 ZSS disease‐associated mutants have defects in mitochondrial clearance, we performed studies on primary fibroblasts derived from a patient with a PEX13 W313G homozygous mutation 23. Like MEFs, primary human fibroblasts do not express endogenous Parkin and CCCP or OA treatment results in Parkin‐independent partial mitochondrial clearance and compaction around the perinuclear region 18. Similar to our findings in CCCP‐treated Pex13 −/− vs. Pex13 +/+ MEFs, OA treatment resulted in partial mitochondrial clearance and compaction of remaining mitochondria in the perinuclear region, whereas fragments of damaged mitochondria accumulated throughout the cytoplasm in a higher percentage of PEX13 W313G mutant than PEX13 wild‐type cells (Fig 3E and F). In the absence of OA treatment, the morphology of PEX13 W313G cells was variable, and some cells (see example, upper right, Fig 3E) were larger and had abnormal‐appearing mitochondria compared with wild‐type fibroblasts. To further examine whether the defect in OA‐induced mitophagy in PEX13 W313G mutant fibroblasts is associated with basal abnormalities in mitochondria, we performed super‐resolution structured illumination microscopy of wild‐type and PEX13 W313G mutant fibroblasts labeled with MitoTracker CMXrosamine (Mitotracker Red), a dye sensitive to mitochondrial membrane potential (Fig EV3C). Similar to our observations in PEX13 siRNA‐treated HeLa cells expressing PEX13 W313G, the reticular mitochondrial network was markedly disrupted in PEX13 W313G mutant fibroblasts. In addition, we found that, compared with wild‐type cells, in PEX13 W313G cells the overall intensity of MitoTracker Red staining was decreased, indicating a decrease in mitochondrial membrane potential. Taken together, these findings provide further evidence supporting a defect in basal mitochondrial quality control in PEX13 W313G‐expressing cells.
Next, we sought to characterize the subcellular localization and expression levels of PEX13 during mitophagy. PEX13 formed punctate staining that strongly colocalized with PMP70 during both basal and mitophagy conditions (Fig 4A). Moreover, PEX13 did not colocalize with TOMM20 (Fig 4B) nor with WIPI2, a marker of early autophagosomes 24 (Fig 4C). Furthermore, we did not observe any difference in PEX13 protein levels during mitophagy (Fig 4D). Together, our data suggest that PEX13 remains localized to the peroxisomal membrane and is not degraded during mitophagy. Since PEX13 remains localized to the peroxisomal membrane and does not colocalize with either the selective autophagic cargo (the mitochondria) or the early autophagic membrane during mitophagy, it likely does not function as a direct adaptor during selective autophagy.
Figure 4. PEX13 colocalizes with peroxisomes, but not with mitochondria or early autophagosomes during CCCP‐induced mitophagy.
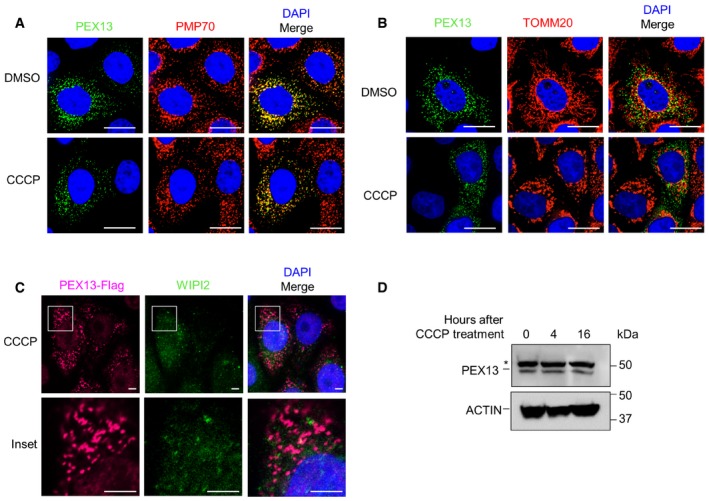
-
A–CRepresentative images of PEX13 and PMP70 (A), PEX13 and TOMM20 (B), or PEX13‐Flag and WIPI2 (C) colocalization in HeLa/Parkin cells transfected with PEX13 after 4 h DMSO or CCCP treatment.
-
DWestern blot detection of endogenous PEX13 in HeLa/Parkin cells treated with 10 μM CCCP for the indicated time. Asterisk denotes nonspecific band.
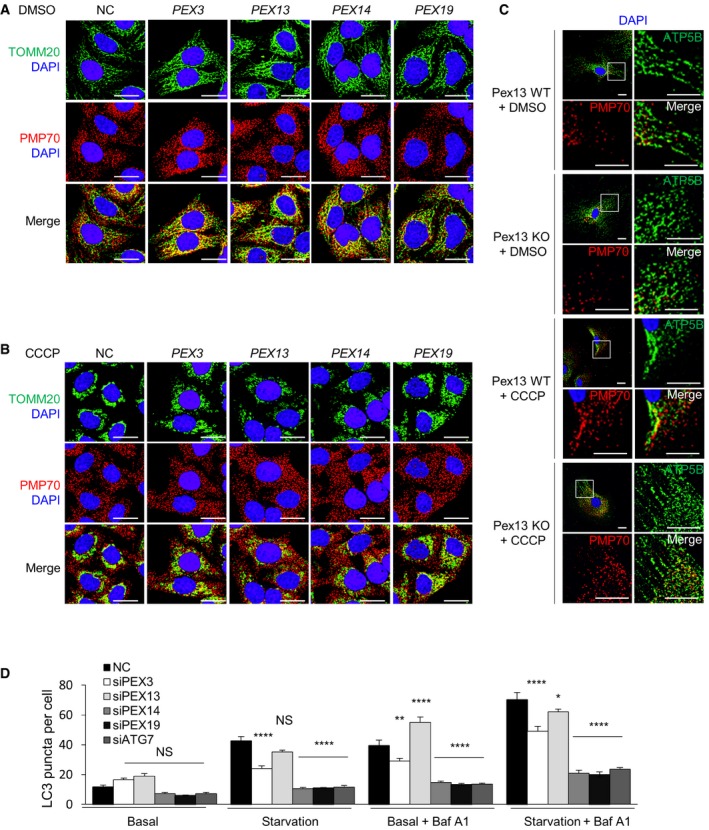
Our findings raised the question of whether all proteins involved in peroxisome biogenesis function in mitophagy or whether PEX13 proteins (and potentially certain other PEX proteins) have a function independent of peroxisome biogenesis in mitophagy. During peroxisome biogenesis, PEX13 interacts with PEX14 and PEX5 for peroxisomal matrix protein import, whereas PEX3 and PEX19 function upstream in the formation of peroxisomal membrane 2. Since the peroxisome biogenesis function of PEX13 depends on other peroxin family members, we evaluated whether other peroxins are required for mitophagy and general autophagy. Of note, PEX5 and PEX19 are involved in ROS‐induced general autophagy 3, and we previously identified PEX3 as a candidate selective autophagy factor 16. Using pools of four siRNAs targeting each gene, we knocked down PEX3, PEX5, PEX13, PEX14, or PEX19 in HeLa cells (Fig 5A). The siRNA pool did not knock down PEX5 efficiently (data not shown); thus, it was excluded from our study.
Figure 5. PEX13 and PEX3 are required for selective mitophagy, whereas PEX14 and PEX19 are required for general autophagy.
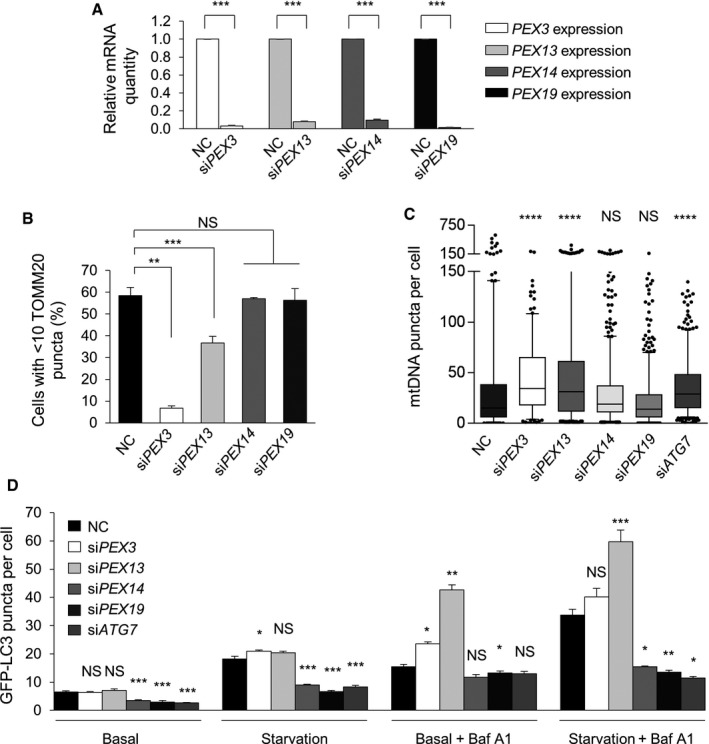
- Quantitative real‐time PCR detection of mRNA levels for PEX3, PEX13, PEX14, and PEX19 in HeLa cells transfected with the indicated siRNA. Results represent mean ± SEM of triplicate samples. Similar results were observed in three independent experiments. ***P < 0.001; two‐tailed unpaired t‐test.
- Quantification of Parkin‐mediated TOMM20 clearance in HeLa/Parkin cells transfected with the indicated siRNA 16 h after treatment with 10 μM CCCP. Results represent mean ± SEM of triplicate samples (˜100 cells analyzed per sample). Similar results were observed in three independent experiments. **P < 0.01, ***P < 0.001; one‐way ANOVA with adjustment for multiple comparisons.
- Quantification of mtDNA clearance in HeLa/HA‐Parkin cells transfected with the indicated siRNA 8 h after treatment with 2.5 μM oligomycin and 250 nM antimycin A (OA). Results represent box plots of ~300 cells analyzed per sample. Whiskers represent 5–95% range and the horizontal lines of the boxes indicate the 25th, 50th, and 75th percentiles of the dataset. Each outlier is represented by a dot. Similar results were observed in three independent experiments. ****P < 0.0001, NS = not significant; Kruskal–Wallis H‐test.
- Quantification of GFP‐LC3 puncta in HeLa/GFP‐LC3 cells treated with 10 nM Baf A1 or DMSO vehicle and cultured for 3 h in normal medium or HBSS starvation media. Results represent mean ± SEM in triplicate samples (˜100 cells analyzed per sample). Similar results were observed in three independent experiments. *P < 0.05, **P < 0.01, ***P < 0.001, NS = not significant; one‐way ANOVA with adjustment for multiple comparisons. Statistical analyses refer to the differences between Pex or ATG7 siRNAs vs. NC siRNA within each treatment group.
siPEX3 and siPEX13 treatment inhibited CCCP‐induced TOMM20 clearance (Fig 5B) and OA‐induced mtDNA clearance in HeLa cells expressing Parkin (Fig 5C). Using four individual siRNAs targeting PEX3, we further confirmed that PEX3 is required for selective mitophagy (Fig EV4). Similar to knockdown of PEX13 (Fig EV2B), siRNA targeting PEX3 did not block Parkin localization to mitochondria during mitophagy (Fig EV4B). Somewhat surprisingly, CCCP‐induced TOMM20 clearance and OA‐induced mtDNA clearance levels were normal in siPEX14 and siPEX19 treated HeLa/Parkin cells (Fig 5B and C). (Since PEX19 is required for general autophagy, we had expected a partial decrease in mitophagy after PEX19 knockdown.) Based on these data, we conclude that a deficiency in PEX3 or PEX13 inhibits mitophagy, whereas a deficiency in PEX14 or PEX19 does not inhibit mitophagy.
Figure EV4. PEX3 is required for mitophagy.
- Quantitative real‐time PCR of PEX3 mRNA detection in HeLa/Parkin cells transfected with indicated siRNA. Results represent mean ± SEM of triplicate samples. Similar results were observed in three independent experiments. ***P < 0.001; one‐way ANOVA with adjustment for multiple comparisons.
- Representative images of Parkin colocalization with TOMM20 in HeLa/Parkin cells treated with indicated siRNA after treatment with DMSO or 10 μM CCCP for 4 h. Scale bars 20 μm.
- Representative images of Parkin‐mediated clearance of TOMM20 in HeLa/Parkin cells transfected with indicated siRNA and after treatment with DMSO or 10 μM CCCP for 16 h. Scale bars, 20 μm.
- Quantification of TOMM20 clearance in the experiment shown in (C). Results represent mean ± SEM of triplicate samples (˜100 cells analyzed per sample). Similar results were observed in more than three independent experiments. *P < 0.05, *** P < 0.001, NS = not significant; one‐way ANOVA with adjustment for multiple comparisons.
- Representative images of Parkin‐mediated clearance of mtDNA after 8 h of treatment with 2.5 μM oligomycin and 250 nM antimycin A (OA) or DMSO vehicle control in HeLa/HA‐Parkin cells treated with indicated siRNA. siPEX3 oligo #1 is shown; similar results were observed with three other siPEX3 oligos. Nuclear DNA staining was masked using DAPI. Scale bars, 20 μm.
- Quantification of mtDNA clearance in the experiment shown in (E). Results represent box plots of ˜300 cells analyzed per sample. Whiskers represent 5–95% range and the horizontal lines of the boxes indicate the 25th, 50th, and 75th percentiles of the dataset. Each outlier is represented by a dot. Similar results were observed in three independent experiments. ***P < 0.001; Kruskal–Wallis H‐test.
After transient knockdown of PEX genes in HeLa/Parkin cells for 48 h, we did not observe changes in the number or morphology PMP70 puncta (Fig EV5A and B). This is not surprising, as mammalian peroxisomes typically have a half‐life of approximately 2 days during basal conditions 25. The peroxisomes and mitochondria in these cells did not colocalize during basal and mitophagy conditions, similar to what we observed in control siRNA‐treated cells (Fig EV5A and B). Thus, short‐term deficiency of PEX13, PEX3, PEX14, or PEX19 does not result in peroxisomal disappearance and does not alter peroxisome and mitochondria subcellular localization. Moreover, peroxisomal ghosts (labeled by PMP70 staining) in Pex13 −/− MEFs did not colocalize with mitochondria during basal or mitophagy conditions (Fig EV5C).
Figure EV5. PEX protein colocalization with peroxisomes and mitochondria in baseline and mitophagy conditions, and roles of different PEX proteins in general autophagy.
-
A, BRepresentative images of TOMM20 and PMP70 co‐staining in HeLa/Parkin cells treated with the indicated siRNA 4 h after treatment with DMSO (A) or 10 μM CCCP (B). Scale bars, 20 μm.
-
CRepresentative images of mitochondrial inner membrane protein ATP5B and peroxisome membrane protein PMP70 co‐staining in primary MEFs of the indicated genotype 24 h after treatment with DMSO or 30 μM CCCP. Scale bars, 20 μm.
-
DQuantification of endogenous LC3 puncta in HeLa/GFP‐LC3 cells treated with 10 nM Baf A1 or DMSO vehicle and cultured in normal medium or 3 h HBSS starvation media. Results represent mean ± SEM in triplicate samples (˜100 cells analyzed per sample). Similar results were observed in three independent experiments. *P < 0.05, **P < 0.01, ****P < 0.001, NS = not significant; one‐way ANOVA with adjustment for multiple comparisons. Statistical analyses refer to the differences between Pex or ATG7 siRNAs vs. NC siRNA within each treatment group.
Next, we evaluated whether these peroxins are involved in basal and starvation‐induced general autophagy. We found that GFP‐LC3 puncta numbers were similar in HeLa/GFP‐LC3 cells treated with siPEX3, siPEX13, and control siRNA in basal and starvation conditions either in the presence or absence of Baf A1 treatment. In fact, PEX13 siRNA slightly increased autophagic flux in both conditions. Thus, neither PEX3 nor PEX13 are required for general autophagy. In contrast, PEX14 and PEX19 siRNA reduced GFP‐LC3 puncta number during basal and starvation conditions to a similar extent as ATG7 siRNA, indicating reduced autophagic flux (Fig 5D). Similar autophagic flux analysis results were observed by quantifying endogenous LC3 puncta (Fig EV5D). These results corroborate a previous report indicating that PEX19 is required for general (ROS‐induced) autophagy 3, and further identify starvation as an additional stimulus for PEX19‐dependent autophagy pathway. In summary, we found that a subset of peroxins, PEX13 and PEX3, are required for selective autophagy, whereas another subset of peroxins, PEX14 and PEX19, are required for general autophagy.
In this study, we provide multiple lines of evidence supporting an essential role of PEX13 and PEX3 in selective, and not general, autophagy in mammalian cells. Previous studies showed that PEX3 is required not only for peroxisome biogenesis, but also for peroxisomal degradation via pexophagy in yeast 26 and in mammalian cells 27. Here, we showed that PEX13 is required for selective autophagy of two very different targets, a viral nucleocapsid protein and mitochondria, and that PEX3 is required for selective autophagy of mitochondria. Given that many factors involved in selective autophagy, including autophagy receptors (e.g., p62, NBR1, optineurin) and targeting signals (e.g., ubiquitin), mediate clearance of diverse substrates 13, we speculate that PEX3 and PEX13 may also be involved in other forms of selective autophagy.
Autophagy receptors facilitate the selective engulfment of cargo by the autophagosome by directly binding to the cargo and the autophagosomal membrane 13. Our observation that PEX13 did not colocalize with markers of the early autophagosome (WIPI2) or with the selective autophagic cargo (TOMM20) during basal and mitophagy conditions suggests it does not function as an autophagy receptor. Given the precedent of peroxisome‐associated proteins functioning as signaling platforms 3, 4, we speculate that PEX13 may regulate selective autophagy as a peroxisomal membrane‐associated signaling node, leading to downstream posttranslational modifications (such as ubiquitylation 28 or phosphorylation 29, 30) and activation of other yet‐to‐be identified selective autophagy regulators. Unbiased proteomics approaches will be helpful to interrogate this pathway. From a teleological perspective, it is reasonable to postulate the dual function of certain proteins such as PEX13 in the biogenesis of peroxisomes—organelles that detoxify reactive oxygen intermediates—and in mitophagy, a process that involves the removal of damaged mitochondria that generate reactive oxygen intermediates.
Although the molecular mechanism underlying PEX13 regulation of selective autophagy remains to be determined, our study provides important insights into ZSS pathogenesis. Cells expressing the PEX13 disease‐associated I326T and W313G mutant proteins showed a greater mitophagy defect compared with cells with PEX13 knockdown alone. Furthermore, overexpression of PEX13 with these mutations, but not wild‐type PEX13, disrupted the normal reticular staining pattern of mitochondria during basal growth conditions. These results suggest that the disease‐associated mutations interfere with mitophagy and mitochondrial quality control. In support of this hypothesis, mitochondria from patient fibroblasts homozygous for the W313G mutation had abnormal mitochondrial membrane potential and morphology during baseline conditions, and a defect in perinuclear mitochondrial compaction following treatment with a mitochondrial uncoupling reagent.
Abnormal mitochondria are frequently observed in patients with PEX mutations and have been suggested to contribute to ZSS disease pathogenesis 31, 32. The current prevailing paradigm is that mitochondrial dysfunction in ZSS is secondary to the defect in peroxisomal antioxidant functions and accumulation of lipid metabolites from the β‐oxidation process 31. Based on our discovery that a subset of PEX genes are required for selective autophagy (PEX3 and PEX13), while another subset are required for general autophagy (PEX14 and PEX19), we propose that dysregulation of mitochondrial quality control in cells with defective mitophagy or general autophagy contributes to ZSS pathogenesis. Defects in mitophagy‐specific genes or core autophagy genes both lead to abnormal mitochondrial function, which contributes to the pathogenesis of aging, neurodegeneration, and cancer 33. Our model is not mutually exclusive with the previous paradigm of ZSS pathogenesis; the two functions of PEX13 could be additive in promoting mitochondrial health. Further studies are required to delineate the mechanisms by which peroxisome‐associated proteins contribute to autophagy, as well as the role of autophagy defects in the pathogenesis of developmental disorders associated with mutations in peroxin proteins.
Materials and Methods
Cell culture
HeLa cells 34 (provided by V. Stollar) and HEK293T cells were cultured in DMEM containing 10% fetal bovine serum (FBS), 2 mM L‐glutamine, and 1× penicillin/streptomycin. HeLa/GFP‐LC3 cells 17 were cultured in media containing 10 μg/ml G418. HeLa/Parkin cells were generated by stable transfection of a pIRES‐hyg3 vector (Clontech) expressing Parkin cDNA and cultured in media containing 100 μg/ml hygromycin B. HeLa/HA‐Parkin cells were generated by retroviral transduction and cultured in media containing 0.25 μg/ml puromycin (see “Retroviruses and lentiviruses” section for details). Primary murine embryonic fibroblasts (MEFs) were derived from day 13.5 embryos by crossing Pex13 +/− mice and genotyped using previously described methods 21, 35. Additionally, mice that transgenically express GFP‐LC3 36 (provided by N. Mizushima) were crossed with Pex13 +/− mice to obtain Pex13 +/−/GFP‐LC3 mice, and this strain was bred to harvest Pex13 +/+/GFP‐LC3 and Pex13 −/−/GFP‐LC3 MEFs. Primary MEFs were maintained in DMEM containing 15% FBS, 1× penicillin/streptomycin, 120 μM β‐mercaptoethanol, and 1× MEM nonessential amino acids and passaged no more than four times. Primary human fibroblasts from Zellweger syndrome patient fibroblast containing homozygous W313G mutation from control human subject without Zellweger syndrome were cultured in DMEM containing 10% FBS, 2 mM L‐glutamine, and 1× penicillin/streptomycin 23. For starvation experiments, cells were cultured in Hank's balanced salt solution (HBSS) (Sigma, H9269) or Earle's balanced salt solution (EBSS) (Sigma, E7510) for the indicated time period. All cell lines were tested for mycoplasma contamination. HeLa cells and HeLa/Parkin cells were authenticated by STR profiling.
Animal experiments
Pex13 +/− and GFP‐LC3 transgenic mice were housed and bred in a specific pathogen‐free animal facility to obtain MEFs of the desired genotype and embryos for electron microscopic analyses. All animal experiments were approved by the UT Southwestern Institutional Animal Care and Use Committee.
siRNA transfection
siRNA sequences and the source of siRNAs are provided in Appendix Table S1. siRNA was transfected using Lipofectamine 2000 (Invitrogen) or RNAiMAX (Invitrogen) at a final concentration of 50 nM according to the manufacturer's instructions 48 h before experiments.
Sindbis virophagy assays
Recombinant Sindbis virus strains SIN‐mCherry.capsid (strain AO30) and SIN‐mCherry.capsid/GFP‐LC3 (strain AO28) were generated, titered, and used for infections as previously described 16, 37, 38. SIN‐mCherry.capsid infections of HeLa/GFP‐LC3 cells were performed at a multiplicity of infection (MOI) of five plaque‐forming units (PFUs) per cell for 10 h. SIN‐mCherry.capsid/GFP‐LC3 infections of primary MEFs were performed at an MOI of 2.5 PFUs per cell for 16 h. Fluorescent microscopy images were analyzed by an observer blinded to experimental condition and the number of mCherry‐capsid puncta, GFP‐LC3 puncta, and colocalized mCherry‐capsid/GFP‐LC3 puncta was counted per cell.
Mitophagy assays
HeLa/Parkin cells were treated with 10 μM CCCP for 16 h, fixed, and then subjected to immunofluorescence staining to detect TOMM20. The number of cells with < 10 mitochondria/cell and with ≥ 10 mitochondria/cell was counted by an observer blinded to experimental condition. For rescue experiments, HeLa/Parkin cells were treated with siRNA for 24 h, transfected with plasmids expressing siRNA‐resistant WT or mutant PEX13 for an additional 24 h, and then treated with CCCP for 16 h. Additionally, HeLa/HA‐Parkin cells were treated with 2.5 μM oligomycin A and 250 nM antimycin A for 8 h, fixed, subjected to immunofluorescence staining to detect dsDNA, and analyzed by CellMask immunofluorescence imaging using Z‐stacks (see “Immunofluorescence microscopy and image analysis” section for details). Primary MEFs and human fibroblasts were treated with 30 μM CCCP or 2.5 μM oligomycin A and 250 nM antimycin A, respectively, for 24 h, fixed, and then subjected to immunofluorescence staining to detect TOMM20. The number of cells with mitochondrial compaction around the nucleus and the number of cells with diffuse fragmentation of damaged mitochondria was counted by an observer blinded to experimental condition.
Autophagy analyses
Autophagy was assessed by fluorescent microscopy quantification of GFP‐LC3 puncta in Pex13 +/+/GFP‐LC3 MEFs, Pex13 −/−/GFP‐LC3 MEFs, and in HeLa/GFP‐LC3 cells by an observed blinded to experimental condition as previously described 39 and by Western blot analysis of LC3. Autophagic flux was assessed by Western blot detection of p62 and LC3 and by quantitating GFP‐LC3 puncta in the presence or absence of Baf A1. Autophagic flux was also assessed by quantitating endogenous LC3 puncta in the presence or absence of Baf A1.
Immunofluorescence microscopy and image analysis
HeLa cells and MEFs were cultured on glass chamber slides (Lab‐Tek), fixed in 2% paraformaldehyde (PFA) in PBS, permeabilized in 0.5% triton X‐100/PBS, and then blocked with blocking buffer (0.5% BSA and 0.2% cold fish gelatin in PBS). Slides were incubated with primary antibodies overnight at 4°C, secondary antibodies at room temperature for 1 h, and then mounted with VectaShield containing DAPI (Vector). Negative control samples with only secondary antibody staining were used to determine background immunofluorescence levels. For experiments involving cellular segmentation, CellMask Deep Red (ThermoFisher C10046, 1:5,000) was applied with secondary antibodies. Z‐stack images were acquired with a Zeiss AxioImager Z2 microscope equipped with a Photometrics CoolSnap HQ2 camera and a Zeiss PLAN APOCHROMAT 20×/0.8 NA air objective or 63×/1.3 NA oil objective using the same acquisition time for all samples within each experiment. Images were deconvolved using AutoDeBlur (Bitplane) and analyzed using the Cell module in Imaris version 8.2 (Bitplane). For images stained for double‐stranded DNA related to quantitative image analysis of mitochondria DNA clearance, nuclear DNA staining was masked using Imaris by generating a nuclear surface using the DAPI channel and then setting non‐DAPI signal within the nuclear surface to zero. For PMP70 and TOMM20 colocalization images, nonspecific nuclear staining was masked using Imaris. MEF and human fibroblast cell border outlines were drawn manually using Photoshop.
Structured illumination microscopy of mitochondria
Cells were grown and treated with MitoTracker CMXROS on #1.5 coverslips in six‐well plates. After treatment (50 nM, 30 min), cells were rinsed three times with complete medium, fixed in 2% PFA for 10 min, and rinsed with PBS. After fixation, coverslips were placed inverted onto ~50 μl Prolong Diamond mounting medium (Invitrogen) on glass slides. Images were acquired with a Deltavision OMX SR microscope (GE) equipped with an Olympus PLAPON 60X/1.42 NA objective and channel‐dedicated pco.edge sCMOS cameras (PCO). SIM reconstructions and 3D projections were performed using Deltavision softWoRx software (GE).
Western blot analyses
Cultured cells were lysed in buffer containing 150 mM NaCl, 25 mM HEPES, 1 mM EDTA, 1% Triton X‐100, protease inhibitor mixture (Roche Applied Sciences), and Halt phosphatase inhibitor cocktail (Thermo Scientific) for 1 h at 4°C, boiled in Laemmli buffer containing 2.5% β‐mercaptoethanol for 5 min, separated by SDS–PAGE, and then transferred to PVDF membranes. Membranes were blocked in 5% milk for 1 h and then incubated in the indicated antibodies. Membranes were imaged using ECL Prime Western Blotting Detection Reagent (GE Healthcare) or Supersignal® West Pico Chemiluminescent Substrate kit (Pierce) on a digital imaging system (BioSpectrum, UVP).
Quantitative real‐time‐PCR
Total RNA was isolated from cells using the RNeasy Plus Mini Kit (Qiagen) and 1 μg RNA was used to generate cDNA (iScript, Bio‐Rad). Quantitative RT–PCR was performed using the SYBR Green Master Mix (Qiagen) and detected using a 7500 Fast Real‐Time PCR System (Applied Biosystems). Primers for the reactions are listed in Appendix Table S2.
Electron microscopy
Tissue samples from day 18.5 mouse embryos and primary MEFs were treated with CCCP or DMSO vehicle, prepared for electron microscopy as described 40, and imaged using a JEOL 1200EX microscope equipped with an SIS Morada CCD camera.
Mitochondrial functional assays
Oxygen consumption rate and proton production rate, as assessed by extracellular acidification rate, were assessed in a Seahorse Biosciences Extracellular Flux Analyzer (model XF96) according to previous protocol 41. Ten thousand MEF cells were plated 18 h prior to measurement in complete medium in a 96‐well plate. Cells were equilibrated in media containing DMEM lacking bicarbonate (Sigma D5030) 1 h prior to experiment. Oxygen and pH levels were measured over 5‐min periods at basal state, and after sequential addition of 2 μM oligomycin, 10 μM CCCP, and 2 μM antimycin A to evaluate maximal mitochondrial respiration. Data are normalized to total protein level in each well.
Chemical reagents and antibodies
Antimycin A (Santa Cruz), oligomycin (Santa Cruz), CCCP (Sigma), bafilomycin A1 (Sigma), and MitoTracker CMXROS (ThermoFisher) were resuspended in DMSO (Sigma). Antimycin A and oligomycin were stored in aliquots at −80°C. CCCP and bafilomycin A1 were stored in aliquots at −20°C. Primary antibodies for immunofluorescent staining include the following: rabbit anti‐LC3 (Sigma L7543, 1:5,000), rabbit anti‐TOMM20 (Santa Cruz sc‐11415, 1:1,000), mouse anti‐Parkin (Cell Signaling 4211, 1:1,000), mouse anti‐DNA (Millipore CBL186, 1:1,000), mouse anti‐ATP5B (Santa Cruz sc‐166462, 1:1,000), mouse anti‐PEX13 (Santa Cruz sc‐271477, 1:100), rabbit anti‐PMP70 (Thermo Scientific PA1‐650, 1:1,000), mouse anti‐Flag (Sigma 184‐200UG, 1:1,000), and rabbit anti‐WIPI2 (Abcam ab105459, 1:500). Secondary antibodies were conjugated to AlexaFluor488, AlexaFluor594, and/or AlexaFluor647 (Invitrogen, 1:750). Primary antibodies for Western blot analyses include the following: mouse anti‐PEX13 (Santa Cruz sc‐271477, 1:200), rabbit anti‐ATG7 (Sigma A2856, 1:1,000), rabbit anti‐FANCC (Fanconi Anemia Research Fund FANCC‐C2, 1:1,000), mouse anti‐SMURF1 (Sigma WH0057154M1, 1:1,000), guinea pig anti‐p62 (Progen GP62‐C, 1:1,000), rabbit anti‐LC3 (Novus NB100‐2220, 1:1,000), and HRP‐conjugated mouse anti‐actin (Santa Cruz sc‐47778‐HRP, 1:2,000).
Constructs
The pCMV6 vector expressing human PEX13‐MYC‐DDK was purchased from Origene. PEX13 disease‐associated mutants I326T and W313G, siRNA‐resistant constructs, and constructs without MYC‐DDK tags were generated using QuikChange II Site‐Directed Mutagenesis kit (Agilent Technologies). PEX13 constructs with resistance to siPEX13 oligo #2 were generated using two successive steps. Primers are listed in Appendix Table S3.
Retroviruses and lentiviruses
pMXs‐IP‐HA‐Parkin 20 (Addgene #38248) was cotransfected with the helper plasmids pUMVC and pCMV‐VSV‐G 42 (Addgene #8849 and #8454) into HEK293T cells. PEX13 cDNAs containing WT, W313G mutation, and I326T mutation were cloned into pLenti‐C‐Myc‐DDK‐IRES‐Neo vector (Origene), then cotransfected into HEK293 cells with the helper plasmids pCMVΔR8.91 43 and pMDG 44. Retro‐ or lentiviral supernatant was filtered through a 0.45‐μm membrane and then added to target cells in the presence of polybrene (8 μg/ml). Cells were selected in media containing 0.5 μg/ml puromycin or 500 μg/ml G418 and then maintained in media containing 0.25 μg/ml puromycin and/or 100 μg/ml G418.
Statistical analyses
Two‐tailed unpaired Student's t‐test was used for the comparison of means of two normally distributed datasets. ANOVA with adjustment for multiple comparisons was used for comparing multiple conditions to a single control. Kruskal–Wallis H‐test was used for comparing multiple non‐normally distributed datasets to one control. Unless otherwise specified, data shown represent mean ± error bars for technical replicates and similar results were observed in at least three independent experiments. Since the absolute values in readouts of control samples can vary significantly across independent experiments, it is more meaningful to compare experimental conditions to the control conditions within a given experiment.
Author contributions
MYL, DIC, HR, and BL designed research; MYL, ZZ, RS, SS, YW, and PM performed research; MYL, PM, and BL analyzed data; and MYL, DIC, and BL wrote the paper.
Conflict of interest
The authors declare that they have no conflict of interest.
Supporting information
Appendix
Expanded View Figures PDF
Source Data for Expanded View
Review Process File
Source Data for Figure 1
Source Data for Figure 3
Source Data for Figure 4
Acknowledgements
This work was supported by NIH grants RO1 CA109618 (B.L.), U19 AI109725 (B.L.), and KO8 AI099150 (R.S.); Cancer Prevention Research Institute of Texas (CPRIT) grant RP120718 (B.L.); and a Burroughs Wellcome Career Medical Scientist Award (R.S.). We gratefully acknowledge Suresh Subramani (UC San Diego School of Medicine) for helpful discussions; Noboru Mizushima (University of Tokyo Medical School) for providing critical reagents; Haley Smith for assistance with manuscript preparation; and Lori Nguyen for technical assistance.
EMBO Reports (2017) 18: 48–60
References
- 1. Wanders RJ (2004) Metabolic and molecular basis of peroxisomal disorders: a review. Am J Med Genet A 126A: 355–375 [DOI] [PubMed] [Google Scholar]
- 2. Fujiki Y, Okumoto K, Mukai S, Honsho M, Tamura S (2014) Peroxisome biogenesis in mammalian cells. Front Physiol 5: 307 [DOI] [PMC free article] [PubMed] [Google Scholar]
- 3. Zhang J, Kim J, Alexander A, Cai S, Tripathi DN, Dere R, Tee AR, Tait‐Mulder J, Di Nardo A, Han JM et al (2013) A tuberous sclerosis complex signalling node at the peroxisome regulates mTORC1 and autophagy in response to ROS. Nat Cell Biol 15: 1186–1196 [DOI] [PMC free article] [PubMed] [Google Scholar]
- 4. Dixit E, Boulant S, Zhang Y, Lee AS, Odendall C, Shum B, Hacohen N, Chen ZJ, Whelan SP, Fransen M et al (2010) Peroxisomes are signaling platforms for antiviral innate immunity. Cell 141: 668–681 [DOI] [PMC free article] [PubMed] [Google Scholar]
- 5. Gould SJ, Kalish JE, Morrell JC, Bjorkman J, Urquhart AJ, Crane DI (1996) Pex13p is an SH3 protein of the peroxisome membrane and a docking factor for the predominantly cytoplasmic PTs1 receptor. J Cell Biol 135: 85–95 [DOI] [PMC free article] [PubMed] [Google Scholar]
- 6. Liu Y, Bjorkman J, Urquhart A, Wanders RJ, Crane DI, Gould SJ (1999) PEX13 is mutated in complementation group 13 of the peroxisome‐biogenesis disorders. Am J Hum Genet 65: 621–634 [DOI] [PMC free article] [PubMed] [Google Scholar]
- 7. Wanders RJ, Waterham HR (2006) Biochemistry of mammalian peroxisomes revisited. Annu Rev Biochem 75: 295–332 [DOI] [PubMed] [Google Scholar]
- 8. Wanders RJ, Waterham HR (2005) Peroxisomal disorders I: biochemistry and genetics of peroxisome biogenesis disorders. Clin Genet 67: 107–133 [DOI] [PubMed] [Google Scholar]
- 9. Zeharia A, Ebberink MS, Wanders RJ, Waterham HR, Gutman A, Nissenkorn A, Korman SH (2007) A novel PEX12 mutation identified as the cause of a peroxisomal biogenesis disorder with mild clinical phenotype, mild biochemical abnormalities in fibroblasts and a mosaic catalase immunofluorescence pattern, even at 40 degrees C. J Hum Genet 52: 599–606 [DOI] [PubMed] [Google Scholar]
- 10. Rosewich H, Waterham HR, Wanders RJ, Ferdinandusse S, Henneke M, Hunneman D, Gartner J (2006) Pitfall in metabolic screening in a patient with fatal peroxisomal beta‐oxidation defect. Neuropediatrics 37: 95–98 [DOI] [PubMed] [Google Scholar]
- 11. Levine B, Kroemer G (2008) Autophagy in the pathogenesis of disease. Cell 132: 27–42 [DOI] [PMC free article] [PubMed] [Google Scholar]
- 12. Boya P, Reggiori F, Codogno P (2013) Emerging regulation and functions of autophagy. Nat Cell Biol 15: 713–720 [DOI] [PMC free article] [PubMed] [Google Scholar]
- 13. Stolz A, Ernst A, Dikic I (2014) Cargo recognition and trafficking in selective autophagy. Nat Cell Biol 16: 495–501 [DOI] [PubMed] [Google Scholar]
- 14. Rogov V, Dotsch V, Johansen T, Kirkin V (2014) Interactions between autophagy receptors and ubiquitin‐like proteins form the molecular basis for selective autophagy. Mol Cell 53: 167–178 [DOI] [PubMed] [Google Scholar]
- 15. Choi AM, Ryter SW, Levine B (2013) Autophagy in human health and disease. N Engl J Med 368: 1845–1846 [DOI] [PubMed] [Google Scholar]
- 16. Orvedahl A, Sumpter R Jr, Xiao G, Ng A, Zou Z, Tang Y, Narimatsu M, Gilpin C, Sun Q, Roth M et al (2011) Image‐based genome‐wide siRNA screen identifies selective autophagy factors. Nature 480: 113–117 [DOI] [PMC free article] [PubMed] [Google Scholar]
- 17. Orvedahl A, MacPherson S, Sumpter R Jr, Talloczy Z, Zou Z, Levine B (2010) Autophagy protects against Sindbis virus infection of the central nervous system. Cell Host Microbe 7: 115–127 [DOI] [PMC free article] [PubMed] [Google Scholar]
- 18. Sumpter R Jr, Sirasanagandla S, Fernandez AF, Wei Y, Dong X, Franco L, Zou Z, Marchal C, Lee MY, Clapp DW et al (2016) Fanconi anemia proteins function in mitophagy and immunity. Cell 165: 867–881 [DOI] [PMC free article] [PubMed] [Google Scholar]
- 19. Padman BS, Bach M, Lucarelli G, Prescott M, Ramm G (2013) The protonophore CCCP interferes with lysosomal degradation of autophagic cargo in yeast and mammalian cells. Autophagy 9: 1862–1875 [DOI] [PubMed] [Google Scholar]
- 20. Yoshii SR, Kishi C, Ishihara N, Mizushima N (2011) Parkin mediates proteasome‐dependent protein degradation and rupture of the outer mitochondrial membrane. J Biol Chem 286: 19630–19640 [DOI] [PMC free article] [PubMed] [Google Scholar]
- 21. Maxwell M, Bjorkman J, Nguyen T, Sharp P, Finnie J, Paterson C, Tonks I, Paton BC, Kay GF, Crane DI (2003) Pex13 inactivation in the mouse disrupts peroxisome biogenesis and leads to a Zellweger syndrome phenotype. Mol Cell Biol 23: 5947–5957 [DOI] [PMC free article] [PubMed] [Google Scholar]
- 22. Shimozawa N, Suzuki Y, Zhang Z, Imamura A, Toyama R, Mukai S, Fujiki Y, Tsukamoto T, Osumi T, Orii T et al (1999) Nonsense and temperature‐sensitive mutations in PEX13 are the cause of complementation group H of peroxisome biogenesis disorders. Hum Mol Genet 8: 1077–1083 [DOI] [PubMed] [Google Scholar]
- 23. Krause C, Rosewich H, Woehler A, Gartner J (2013) Functional analysis of PEX13 mutation in a Zellweger syndrome spectrum patient reveals novel homooligomerization of PEX13 and its role in human peroxisome biogenesis. Hum Mol Genet 22: 3844–3857 [DOI] [PubMed] [Google Scholar]
- 24. Polson HE, de Lartique J, Rigden DJ, Reedijk M, Urbe S, Claque MJ, Tooze SA (2010) Mammalian Atg18 (WIPI2) localizes to omegasome‐anchored phagophores and positively regulates LC3 lipidation. Autophagy 6: 506–522 [DOI] [PubMed] [Google Scholar]
- 25. Huybrechts SJ, Van Veldhoven PP, Brees C, Mannaerts GP, Los GV, Fransen M (2009) Peroxisome dynamics in cultured mammalian cells. Traffic 10: 1722–1733 [DOI] [PubMed] [Google Scholar]
- 26. Burnett SF, Farre JC, Nazarko TY, Subramani S (2015) Peroxisomal Pex3 activates selective autophagy of peroxisomes via interaction with the pexophagy receptor Atg30. J Biol Chem 290: 8623–8631 [DOI] [PMC free article] [PubMed] [Google Scholar]
- 27. Yamashita S, Abe K, Tatemichi Y, Fujiki Y (2014) The membrane peroxin PEX3 induces peroxisome‐ubiquitination‐linked pexophagy. Autophagy 10: 1549–1564 [DOI] [PMC free article] [PubMed] [Google Scholar]
- 28. Kirkin V, McEwan DG, Novak I, Dikic I (2009) A role for ubiquitin in selective autophagy. Mol Cell 34: 259–269 [DOI] [PubMed] [Google Scholar]
- 29. Wild P, Farhan H, McEwan DG, Wagner S, Rogov VV, Brady NR, Richter B, Korac J, Waidmann O, Choudhary C et al (2011) Phosphorylation of the autophagy receptor optineurin restricts Salmonella growth. Science 333: 228–233 [DOI] [PMC free article] [PubMed] [Google Scholar]
- 30. Matsumoto G, Wada K, Okuno M, Kurosawa M, Nukina N (2011) Serine 403 phosphorylation of p62/SQSTM1 regulates selective autophagic clearance of ubiquitinated proteins. Mol Cell 44: 279–289 [DOI] [PubMed] [Google Scholar]
- 31. Baumgart E, Vanhorebeek I, Grabenbauer M, Borgers M, Declercq PE, Fahimi HD, Baes M (2001) Mitochondrial alterations caused by defective peroxisomal biogenesis in a mouse model for Zellweger syndrome (PEX5 knockout mouse). Am J Pathol 159: 1477–1494 [DOI] [PMC free article] [PubMed] [Google Scholar]
- 32. Salpietro V et al (2015) Zellweger syndrome and secondary mitochondrial myopathy. Eur J Pediatr 174: 557–563 [DOI] [PubMed] [Google Scholar]
- 33. Ding WX, Yin XM (2012) Mitophagy: mechanisms, pathophysiological roles, and analysis. Biol Chem 393: 547–564 [DOI] [PMC free article] [PubMed] [Google Scholar]
- 34. Li ML, Wang HL, Stollar V (1997) Complementation of and interference with Sindbis virus replication by full‐length and deleted forms of the nonstructural protein, nsP1, expressed in stable transfectants of Hela cells. Virology 227: 361–369 [DOI] [PubMed] [Google Scholar]
- 35. Su T, Suzui M, Wang L, Lin CS, Xing WQ, Weinstein IB (2003) Deletion of histidine triad nucleotide‐binding protein 1/PKC‐interacting protein in mice enhances cell growth and carcinogenesis. Proc Natl Acad Sci USA 100: 7824–7829 [DOI] [PMC free article] [PubMed] [Google Scholar]
- 36. Mizushima N, Yamamoto A, Matsui M, Yoshimori T, Ohsumi Y (2004) In vivo analysis of autophagy in response to nutrient starvation using transgenic mice expressing a fluorescent autophagosome marker. Mol Biol Cell 15: 1101–1111 [DOI] [PMC free article] [PubMed] [Google Scholar]
- 37. Liang XH, Kleeman LK, Jiang HH, Gordon G, Goldman JE, Berry G, Herman B, Levine B (1998) Protection against fatal Sindbis virus encephalitis by Beclin, a novel Bcl‐2‐interacting protein. J Virol 72: 8586–8596 [DOI] [PMC free article] [PubMed] [Google Scholar]
- 38. Hardwick JM, Levine B (2000) Sindbis virus vector system for functional analysis of apoptosis regulators. Methods Enzymol 322: 492–508 [DOI] [PubMed] [Google Scholar]
- 39. Shoji‐Kawata S, Sumpter R, Leveno M, Campbell GR, Zou Z, Kinch L, Wilkins AD, Sun Q, Pallauf K, MacDuff D et al (2013) Identification of a candidate therapeutic autophagy‐inducing peptide. Nature 494: 201–206 [DOI] [PMC free article] [PubMed] [Google Scholar]
- 40. Liang XH, Jackson S, Seaman M, Brown K, Kempkes B, Hibshoosh H, Levine B (1999) Induction of autophagy and inhibition of tumorigenesis by beclin 1 . Nature 402: 672–676 [DOI] [PubMed] [Google Scholar]
- 41. Mishra P, Carelli V, Manfredi G, Chan DC (2014) Proteolytic cleavage of Opa1 stimulates mitochondrial inner membrane fusion and couples fusion to oxidative phosphorylation. Cell Metab 19: 630–641 [DOI] [PMC free article] [PubMed] [Google Scholar]
- 42. Stewart SA, Dykxhoorn DM, Palliser D, Mizuno H, Yu EY, An DS, Sabatini DM, Chen IS, Hahn WC, Sharp PA et al (2003) Lentivirus‐delivered stable gene silencing by RNAi in primary cells. RNA 9: 493–501 [DOI] [PMC free article] [PubMed] [Google Scholar]
- 43. Zufferey R, Nagy D, Mandel RJ, Naldini L, Trono D (1997) Multiply attenuated lentiviral vector achieves efficient gene delivery in vivo. Nat Biotechnol 15: 871–875 [DOI] [PubMed] [Google Scholar]
- 44. Naldini L, Blomer U, Gallay P, Ory D, Mulligan R, Gage FH, Verma IM, Trono D (1996) In vivo gene delivery and stable transduction of nondividing cells by a lentiviral vector. Science 272: 263–267 [DOI] [PubMed] [Google Scholar]
Associated Data
This section collects any data citations, data availability statements, or supplementary materials included in this article.
Supplementary Materials
Appendix
Expanded View Figures PDF
Source Data for Expanded View
Review Process File
Source Data for Figure 1
Source Data for Figure 3
Source Data for Figure 4