

Abstract
Adaptive cellular responses are often required during wound repair. Following disruption of the intestinal epithelium, wound‐associated epithelial (WAE) cells form the initial barrier over the wound. Our goal was to determine the critical factor that promotes WAE cell differentiation. Using an adaptation of our in vitro primary epithelial cell culture system, we found that prostaglandin E2 (PGE 2) signaling through one of its receptors, Ptger4, was sufficient to drive a differentiation state morphologically and transcriptionally similar to in vivo WAE cells. WAE cell differentiation was a permanent state and dominant over enterocyte differentiation in plasticity experiments. WAE cell differentiation was triggered by nuclear β‐catenin signaling independent of canonical Wnt signaling. Creation of WAE cells via the PGE 2‐Ptger4 pathway was required in vivo, as mice with loss of Ptger4 in the intestinal epithelium did not produce WAE cells and exhibited impaired wound repair. Our results demonstrate a mechanism by which WAE cells are formed by PGE 2 and suggest a process of adaptive cellular reprogramming of the intestinal epithelium that occurs to ensure proper repair to injury.
Keywords: epithelium, prostaglandin, restitution, stem cell, wound repair
Subject Categories: Development & Differentiation, Molecular Biology of Disease, Stem Cells
Introduction
The intestinal epithelium is comprised of a single layer of columnar epithelial cells that separate the luminal contents from the rich networks of vascular, structural, and immune cells that reside in the lamina propria. This semipermeable cellular barrier functions to reduce exposure to pathogenic and commensal microbes, toxins, and other immunogenic substances (Turner, 2009). During homeostasis, the epithelial cell barrier is maintained by highly active stem cells residing at the base of the crypts that provide continuous and perpetual cell renewal, with the majority of the differentiated cells being replaced every 3–5 days (Cheng & Leblond, 1974b; Potten et al, 1992; Crosnier et al, 2006; Barker et al, 2007; Noah et al, 2011). However, in response to injury (i.e. infection, ischemia, toxin exposure), additional mechanisms are rapidly implemented to restore the epithelial barrier. Delay or failure to do so can facilitate exposure to luminal antigens and potentially direct invasion of luminal microorganisms into the host, resulting in a heightened pro‐inflammatory response, worsened tissue damage, and systemic infection.
Adaptive cellular responses are triggered by injury or damage to promote the survival and regeneration of a diverse array of mammalian tissues. Two general classes of these responses have been recognized. In one state, a transient class of repair cells is formed that has an atypical differentiation state for that tissue. In a second state, cells lost during damage are directly replaced (Jessen et al, 2015). The intestinal epithelium appears to employ the first approach in a process termed epithelial restitution (Svanes et al, 1982; Ito et al, 1984; Lacy, 1988). The critical driver is a transient, specialized repair cell type, which we subsequently termed wound‐associated epithelial (WAE) cells (Seno et al, 2009; Stappenbeck & Miyoshi, 2009). These atypical epithelial cells migrate over the surfaces of intestinal wounds within minutes to hours after injury to re‐establish the epithelial barrier. The initial restitution phase of repair does not depend on altered cellular proliferation rates of nearby stem cells (Podolsky, 1999; Dignass, 2001); however, a subsequent repair phase requires enhanced proliferation of stem and progenitor cells in the crypts adjacent to the wound to replace crypts lost during severe damage (Seno et al, 2009).
Several factors have been proposed to affect epithelial restitution, including growth factors (e.g. TGF‐β, EGF, IGF‐1), cytokines (e.g. IL‐2, IFN‐γ, IL‐1β), and a variety of peptide (e.g. trefoil factors) and non‐peptide (e.g. lysophosphatidic acid, polyamines, short chain fatty acids) molecules (Moore et al, 1989, 1992; Nusrat et al, 1992; Dignass & Podolsky, 1993; Dignass et al, 1994; Wilson & Gibson, 1997; Dignass, 2001). However, due to the limitations of the experimental model systems used in these previous studies, it is still unclear as to which of these factors, if any, are necessary and sufficient for the WAE cell formation that occurs in the initial phase of repair. Understanding the regulation of such WAE mediators in the intestine could provide a potential avenue for regenerative therapies.
We and others have modeled WAE cells in vivo using a biopsy injury system to generate focal wounds in the mouse colon. This method allows the investigator to study mucosal repair with control over spatial and temporal variables (Becker et al, 2005; Seno et al, 2009; Manieri et al, 2012, 2015; Miyoshi et al, 2012; Leoni et al, 2013). Following biopsy injury, wound surfaces are rapidly covered by WAE cells (Seno et al, 2009). Multiple lineage tracing models have shown that these WAE cells emanate from crypts adjacent to the wounded area and are replaced by columnar epithelial cells in a subsequent repair phase (Seno et al, 2009; Miyoshi et al, 2012). With this injury method, we found that mice deficient for prostaglandin‐endoperoxide synthase 2 (Ptgs2), which encodes the inducible prostaglandin synthase family member cyclooxygenase 2, have multiple defects in repair including incomplete covering of biopsy wounds with WAE cells (Manieri et al, 2012, 2015). Prostaglandins likely exert their effects near their site of production due to their chemical and/or metabolic instability (Narumiya et al, 1999; Matsuoka & Narumiya, 2007). We previously found that Ptgs2‐expressing mesenchymal stem cells localize specifically in the colonic wound bed in close association with crypts adjacent to the wound and their associated WAE cells (Manieri et al, 2012). From these observations, we reasoned that prostaglandins were promising candidate molecules to investigate for capacity to directly induce adaptive cellular reprogramming of the intestinal epithelium and stimulate WAE cell formation during early wound repair.
Ptgs2‐mediated synthesis of prostaglandins increases during acute inflammation, and the resulting influx of these lipid mediators acts to orchestrate pro‐inflammatory and anti‐inflammatory responses in a cell type‐ and context‐dependent manner (Ricciotti & FitzGerald, 2011; Kalinski, 2012). Thus, to study the direct effects of prostaglandins on intestinal epithelial cells, we utilized our culture system for primary intestinal epithelial cells (Miyoshi et al, 2012; Miyoshi & Stappenbeck, 2013). With this system, primary epithelial cell lines are generated from any region of the gastrointestinal tract and propagated as spheroids enriched for epithelial stem cells in a conditioned media containing Wnt3a, R‐spondin 3, and noggin (Miyoshi & Stappenbeck, 2013), the critical factors that support intestinal stem cell growth (Sato et al, 2009). As WAE cells are known to be post‐mitotic (Lacy, 1988), a key advantage of the spheroid culture system is that withdrawal of the conditioned medium promotes exit from the cell cycle and differentiation to mature intestinal epithelial cell types (Miyoshi et al, 2012; Patel et al, 2013; Moon et al, 2014; Sun et al, 2015; VanDussen et al, 2015). Here, we use this culture system to show that prostaglandin E2 (PGE2) signals through the EP4 receptor on epithelial stem and/or progenitor cells to directly induce WAE cells and validate these findings in vivo with our biopsy injury model and a genetic mouse lacking EP4 receptor expression specifically in the intestinal epithelium.
Results
PGE2 induces differentiation of intestinal epithelial stem cells to WAE cells through EP4
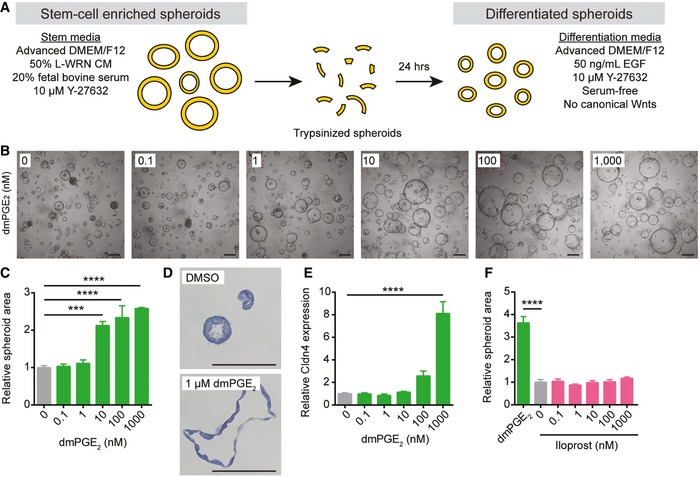
To investigate whether prostaglandins can directly promote the formation of WAE cells, we utilized our culture system for primary intestinal epithelial cells (Miyoshi et al, 2012; Miyoshi & Stappenbeck, 2013). Stem cell‐enriched spheroids from the jejunum were passaged and then cultured in serum‐ and canonical Wnt‐free differentiation medium (supplemented with EGF) for 24 h in the absence or presence of stabilized PGE2 analog 16,16‐dimethyl PGE2 (dmPGE2; Narumiya et al, 1999) or prostaglandin I2 (PGI2) analog iloprost (Schror et al, 1981; Abramovitz et al, 2000) (Fig 1A). These two prostaglandins rescue repair defects in Ptgs2‐deficient mice (Walker et al, 2010; Manieri et al, 2012). Treatment with dmPGE2 stimulated WAE cell formation. There was a dose‐dependent effect on spheroid size (Fig 1B and C), cell flattening (Fig 1D), and mRNA expression of the one previously described WAE cell marker, Claudin‐4 (Cldn4) (Seno et al, 2009; Fig 1E). In contrast, spheroids treated with the PGI2 analog iloprost did not stimulate WAE cell phenotypes at equivalent dosages (Fig 1F). Thus, PGE2 treatment appeared to directly stimulate WAE cells.
Figure 1. Prostaglandin E2 induces differentiation of intestinal epithelial stem cells to wound‐associated epithelial cells.
-
ASchematic of spheroid differentiation method. L‐WRN CM, conditioned medium from an L cell line engineered to secrete Wnt3a, R‐spondin 3, and noggin. Y‐27632, ROCK inhibitor. EGF, epidermal growth factor.
-
B–FMouse jejunal spheroids were cultured in differentiation medium containing 0–1,000 nM dmPGE2 or iloprost. (B) Representative bright‐field images of spheroids treated with dmPGE2. Scale bars, 200 μm. (C) Quantification of average spheroid area ± s.e.m. relative to spheroids treated with 0 nM dmPGE2 (average area was 3,761 μm2 for 0 nM group; n = 4 images with a minimum of 50 spheroids counted from two independent experiments). (D) Representative histological sections of spheroids treated with 1 μM dmPGE2 or an equivalent volume of DMSO and stained with hematoxylin. Scale bars, 100 μm. (E) Quantification of the average expression ± s.e.m. of Cldn4 mRNA relative to the 0 nM treatment group (n = 3 independent experiments). (F) Quantification of average spheroid area ± s.e.m. relative to spheroids treated with 0 nM iloprost (n = 4 images with a minimum of 50 spheroids counted from two independent experiments). ***P < 0.001, ****P < 0.0001 by one‐way ANOVA and Dunnett's post‐test.
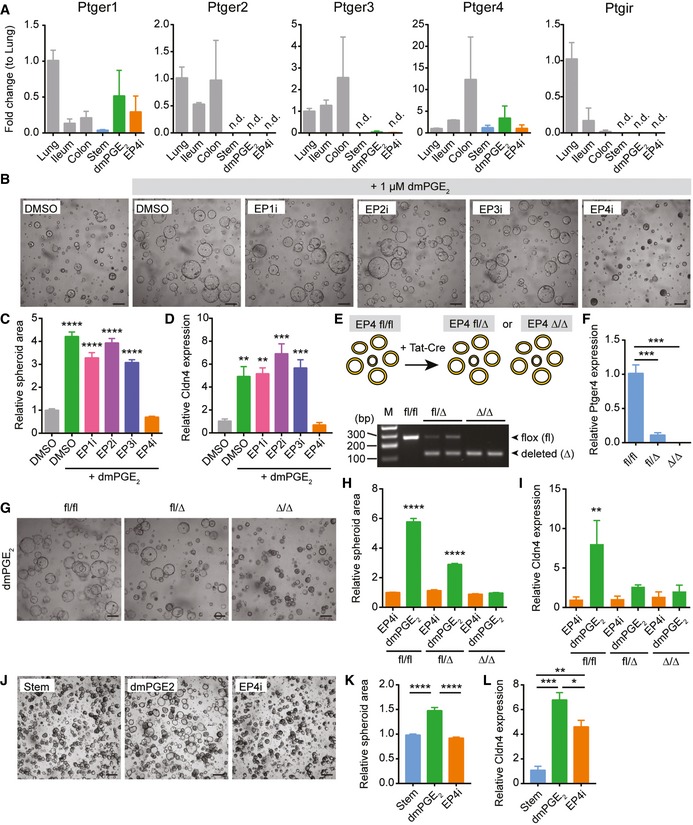
PGE2 can signal through four prostaglandin E receptors: Ptger1 (encoding EP1), Ptger2 (encoding EP2), Ptger3 (encoding EP3), and Ptger4 (encoding EP4; Narumiya et al, 1999). All four of these receptors were readily detectable in whole organ preparations of lung, small intestine, and colon (Fig 2A). In contrast, only Ptger1 and Ptger4 mRNAs, but not Ptger2 or Ptger3 mRNAs, were detectable in jejunal spheroid epithelial cells (Fig 2A). The PGI2 receptor Ptgir was also undetectable in the spheroids. These data corroborated a previous in situ hybridization study reporting mRNA expression of Ptger1 and Ptger4 throughout the intestinal epithelium (Morimoto et al, 1997) and our own validation of Ptger4 mRNA localization (Appendix Fig S1). To determine which cellular receptor mediated the effects of PGE2 on WAE cell formation, spheroids were treated with dmPGE2 and specific pharmacological inhibitors for EP1 (SC 51322), EP2 (PF 04418948), EP3 (L‐798,106), or EP4 (L‐161,982). Of these, only EP4 inhibitor (EP4i) blocked the dmPGE2‐induced WAE formation (Fig 2B–D). These results support a role for dmPGE2 signaling through EP4 to promote WAE formation. We next utilized a genetic model of Ptger4 deficiency to confirm the effect of the PGE2‐EP4 signaling pathway on WAE formation. Spheroid lines were established from the jejunum of the Ptger4 flox/flox mouse (Schneider et al, 2004) and delivered transient recombinant Tat‐Cre (Shaw et al, 2008; Morimoto et al, 2010; Patel et al, 2013) to generate heterozygous Ptger4 flox/Δ and knockout Ptger4 Δ/Δ spheroid lines (Fig 2E and F). Ptger4 Δ/Δ spheroids did not make WAE cells by any of the above criteria (Fig 2G–I).
Figure 2. PGE2 signals through the prostaglandin receptor EP4 to induce differentiation of wound‐associated epithelial cells.
-
AQuantification of the average expression ± s.e.m. of Ptger1, Ptger2, Ptger3, Ptger4, and Ptgir mRNAs in whole‐thickness mouse lung, ileum, or colon tissues or in jejunal spheroids cultured in stem cell (Stem), WAE (dmPGE2), or enterocyte (EP4i) medium (n = 3 independent experiments). Data are presented as fold change compared to lung tissue. n.d., not detected.
-
B–DMouse jejunal spheroids were cultured in differentiation medium with DMSO only or with 1 μM dmPGE2 and pharmacological inhibitors of EP1 (EP1i, SC 51322), EP2 (EP2i, PF 04418948), EP3 (EP3i, L‐798,106), or EP4 (EP4i, L‐161,982) at a concentration of 10 μM or an equivalent volume of DMSO vehicle. **P < 0.01, ***P < 0.001, ****P < 0.0001 compared to the DMSO only group by one‐way ANOVA and Dunnett's post‐test. (B) Representative bright‐field images. Scale bars, 200 μm. (C) Quantification of average spheroid area ± s.e.m. relative to spheroids treated with DMSO alone (n = 4 images with a minimum of 50 spheroids counted from two independent experiments). (D) Quantification of the average expression ± s.e.m. of Cldn4 mRNA relative to stem cell spheroids (n = 3 independent experiments).
-
E, FTat‐Cre mediated recombination of Ptger4 flox/flox (fl/fl) jejunal spheroids to generate Ptger4 flox/Δ (fl/Δ) and Ptger4 Δ/Δ (Δ/Δ) spheroid lines. (E) Schematic and representative PCR genotyping results. M, marker lane. bp, base pairs. (F) Quantification of the average expression ± s.e.m. of Ptger4 mRNA in spheroids cultured in stem cell media relative to fl/fl genotype (n = 3 independent experiments). ***P < 0.001 by two‐way ANOVA and Dunnett's multiple comparisons post‐test with the EP4i‐treated fl/fl group set as the control.
-
G–IPtger4 flox/flox, Ptger4 flox/Δ, and Ptger4 Δ/Δ spheroids were cultured in differentiation medium with 1 μM dmPGE2 or 10 μM EP4i. **P < 0.01, ****P < 0.0001 by one‐way ANOVA and Tukey's post‐test. (G) Representative bright‐field images. Scale bars, 200 μm. (H) Quantification of average spheroid area ± s.e.m. (n = 4 images with a minimum of 50 spheroids counted per group from two independent experiments) and (I) average expression ± s.e.m. of Cldn4 mRNA (n = 3 independent experiments) relative to EP4i‐treated Ptger4 flox/flox spheroids.
-
J–LHuman ileal spheroids were cultured in differentiation medium with 1 μM dmPGE2 or 10 μM EP4i. *P < 0.05, **P < 0.01, ***P < 0.001, ****P < 0.0001 by one‐way ANOVA and Tukey's post‐test. (J) Representative bright‐field images. Scale bars, 200 μm. (K) Quantification of average spheroid area ± s.e.m. (n = 4 images with a minimum of 50 spheroids counted per group from three independent donor lines examined over 3 passages each) and (L) the average expression ± s.e.m. of CLDN4 mRNA (n = 3 independent donor lines) relative to stem spheroids.
We then tested whether PGE2 signaling through EP4 was important for the formation of WAE cells in human lines. In response to treatment with dmPGE2, human ileal spheroids exhibited morphological changes and induction of CLDN4 mRNA (Fig 2J–L) similar to mouse spheroids. EP4i blocked these responses (Fig 2J–L). Thus, PGE2‐EP4 signaling appears to be a conserved mechanism in mouse and human.
In vitro‐induced WAE cells resemble WAE cells in vivo
Our next goals were to validate that PGE2‐treated cells highly resembled WAE cells and to identify additional markers to describe this cell population more precisely. To do this, we performed microarray transcriptional profiling of these cells compared to stem cell‐enriched spheroids as well as EP4i‐treated spheroids (Fig 3A). We used EP4i‐treated cells to eliminate the effects of endogenous PGE2 present in the culture medium or produced by the spheroid epithelial cells. We observed significant and differential expression of 11,925 probes between the groups of cells. Unsupervised hierarchical clustering showed that dmPGE2‐treated and EP4i‐treated spheroids were more related to each other than to stem cells (Fig 3B). The clustering analysis also highlighted six major gene clusters. Detailed analysis of these clusters developed the hypothesis that stimulation or inhibition of PGE2 signaling directed distinct differentiation states.
Figure 3. Spheroids differentiated with dmPGE2 or EP4i are composed of post‐mitotic intestinal epithelial cells.

-
ASchematic of method used to generate stem cell, enterocyte, and WAE cell groups.
-
BHeatmap showing unsupervised hierarchical clustering of genes that were significantly (FDR‐adjusted P < 0.05) and differentially expressed between the three groups (n = 4 samples per treatment from two independent experiments). Each column is one sample and each row is one gene. Red and blue indicate genes with enriched or de‐enriched mRNA expression in a particular group, respectively. The dendrogram for the gene clustering is colored to highlight major gene clusters 1–6. The number of probes in each cluster is in parentheses.
-
C, DGraphs showing the top five most significant pathways (C) and gene ontology cellular component terms (D) associated with Cluster 1 and Cluster 4.
-
E, FSpheroids were cultured as indicated for 24 h followed by a 1‐h pulse with EdU to mark the cells undergoing DNA synthesis. (E) Representative images of EdU staining (red). Nuclei are visualized with bisbenzimide (blue). Scale bars, 20 μm. (F) Quantification of EdU‐positive nuclei ± s.e.m. as a percent of the total nuclei (n = minimum of 15 spheroids counted per sample from two independent experiments). ****P < 0.0001 by one‐way ANOVA and Tukey's post‐test.
-
GGraph of the fold change in background‐subtracted luminescence ± s.e.m. (relative to 0 h measurement) of Cdc25A‐CBRLuc spheroids (n = 3 independent experiments with four technical replicates). ****P < 0.0001 for dmPGE2‐ and EP4i‐treated spheroids compared to stem cells by repeated measures two‐way ANOVA (variable = treatment). P < 0.001 at the 16, 20, and 24 h time points by Dunnett's post‐test comparing dmPGE2‐treated and EP4i‐treated spheroids to the stem cell control.
-
HQuantification of the average expression ± s.e.m. of Lgr5 and Mki67 mRNAs in jejunal spheroids cultured in stem cell (Stem) or in differentiation medium with the indicated supplements relative to the stem cell group (n = 3 independent experiments). **P < 0.01, ****P < 0.0001 by one‐way ANOVA and Dunnett's post‐test. n.d., not detected.
The two largest clusters corresponded to genes that encode mRNAs either highly expressed in stem cell spheroids (Cluster 1; 5,289 probes) or in post‐mitotic intestinal epithelial cells (Cluster 4; 4,636 probes). Cluster 1 was enriched for cell cycle and mRNA processing pathways and cellular component gene ontology (GO) terms related to the nucleus, whereas Cluster 4 was enriched for metabolism pathways and GO terms related to the endoplasmic reticulum (Fig 3C and D), suggesting that mitotic state is driving the major transcriptional feature distinguishing stem cell spheroids from dmPGE2‐ or EP4i‐treated spheroids. We validated that PGE2‐ and EP4i‐treated cells were post‐mitotic by assessing proliferation with an EdU incorporation assay (Fig 3E and F) and a spheroid proliferation reporter line (Cdc25a‐CRBLuc; Fig 3G; Sun et al, 2015). Additionally, the mRNA levels of the intestinal stem cell marker leucine‐rich repeat containing G protein‐coupled receptor 5 (Lgr5) (Barker et al, 2007) and the proliferation marker antigen identified by monoclonal antibody Ki‐67 (Mki67) (Iatropoulos & Williams, 1996) were lower in PGE2‐ and EP4i‐treated spheroids than stem cells (Fig 3H). We also found that dmPGE2 treatment had no obvious effects on the proliferation of stem cell spheroids (Appendix Fig S2).
Two gene clusters discriminated PGE2‐treated cells, Cluster 5 (616 probes) and Cluster 6 (701 probes) (Fig 3B). These clusters contained genes associated with focal adhesion, cell junction organization, regulation of actin cytoskeleton, and the MAPK and Rap1 signaling pathways (Fig 4A and B). These functions and pathways are consistent with the migratory properties of WAE cells (Dignass, 2001; Blikslager et al, 2007).
Figure 4. In vitro generated wound‐associated epithelial cells resemble their in vivo counterparts.
-
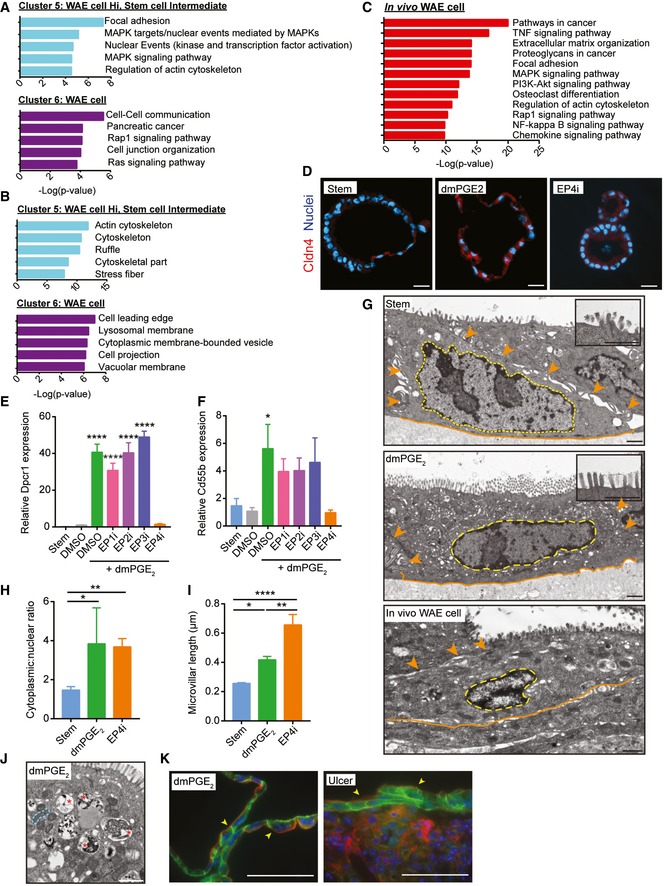
A, BGraphs showing the top five most significant pathways (A) and gene ontology cellular component terms (B) associated with Cluster 5 and Cluster 6.
-
CGraph of the top twelve significantly enriched pathways in in vivo colonic WAE cells.
-
DRepresentative images of spheroids stained for Cldn4 (red). Nuclei are visualized with bisbenzimide (blue) (n = 2 independent experiments). Scale bars, 20 μm.
-
E, FJejunal spheroids were cultured as in Fig 2B–D. Quantification of the average expression ± s.e.m. of Dpcr1 (E) and Cd55b mRNAs relative to DMSO group (n = 3 independent experiments). *P < 0.05, ****P < 0.0001 by one‐way ANOVA and Dunnett's post‐test.
-
G–JRepresentative transmission electron microscopy (TEM) images of stem and WAE spheroids and an in vivo WAE cell from a biopsy‐injured mouse colon. (G) The basal plasma membranes are outlined in orange solid lines, lateral plasma membranes are indicated with orange arrowheads, and nuclei are outlined with wide yellow dashed lines. Insets show a magnified view of the apical cell surface. Quantification of cytoplasmic:nuclear ratio (H) and microvillar length (I) ± s.e.m. from the TEM images (n = minimum of five images per group). *P < 0.05, **P < 0.01, ****P < 0.0001 by one‐way ANOVA and Tukey's post‐test. (J) Higher power image of the cytoplasm of a WAE spheroid cell. Single mitochondria are outlined with a narrow blue dashed line; vacuole structures are indicated with red asterisks. Scale bars, 1 μm.
-
KRepresentative image of a spheroid stained for β‐catenin (green) and F‐actin (red). Nuclei are visualized with bisbenzimide (blue). A similarly stained section of a small intestinal ulcer is shown for comparison. Arrowheads indicate the apical cell membrane. Scale bars, 50 μm.
To confirm that in vitro WAE cells were transcriptionally similar to in vivo WAE cells, we compared the gene sets from Cluster 5 and Cluster 6 to previous microarray data obtained from laser capture microdissected WAE cells that covered colonic biopsy wounds (Miyoshi et al, 2012). We found a statistically significant overlap of the in vivo and in vitro WAE cell gene sets (P = 0.0026) by hypergeometric probability test and similar pathway overrepresentation (Fig 4C). One difference between these two data sets was that the in vivo WAE cell cluster was additionally enriched for genes associated with cytokine and chemokine signaling pathways, which was likely a consequence of the inflammatory response that occurred in the wound bed. These data suggest that small intestinal WAE cells generated in vitro have similarity to colonic WAE cells in vivo.
Cellular markers to distinguish WAE cells are lacking. We previously reported Cldn4 protein expression in WAE cells in vivo (Seno et al, 2009). We confirmed this expression pattern in WAE cells generated in vitro (Fig 4D). Cldn4 mRNA robustly distinguishes dmPGE2‐ and EP4i‐treated spheroids, but is also expressed in stem cell‐enriched spheroids (Fig EV1). Despite this, mitotic state (Fig 3) and morphology (Fig EV1) can be used to distinguish stem and WAE spheroids. Thus, we used our transcriptional profiling data to identify additional mRNA markers that were enriched in dmPGE2‐treated spheroids as compared to both stem and EP4i‐treated spheroids. We validated the genes diffuse panbronchiolitis critical region 1 (Dpcr1) and CD55 decay accelerating factor for complement B (Cd55b; also known as Daf2) as novel mRNA markers for WAE cells that were induced by PGE2 signaling through EP4 receptor in mouse and human small intestinal epithelial cells as well as mouse colonic epithelial cells (Figs 4E and F, and EV2).
Figure EV1. Morphology distinguishes wound‐associated epithelial cell and stem cell spheroids.

- Quantification of the average expression ± s.e.m. of Cldn4 mRNA in mouse jejunal spheroids cultured in stem cell or in differentiation medium with the indicated supplements relative to the DMSO group (n = 3 independent experiments). ****P < 0.0001 by one‐way ANOVA and Tukey's post‐test.
- Representative bright‐field images of stem or dmPGE2‐treated spheroids. Stem spheroids have a smooth appearance, whereas dmPGE2‐treated spheroids have a dimpled “golf ball‐like” appearance. Scale bars, 200 μm.
Figure EV2. Expression of additional wound‐associated epithelial cell and enterocyte markers in human ileal and mouse colonic spheroids.
-
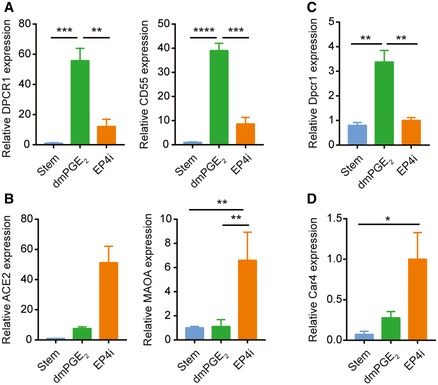
A, BHuman ileal spheroids were cultured in stem cell medium or in differentiation medium containing dmPGE2 or EP4i. Quantification of the average mRNA expression ± s.e.m. of the WAE cell markers DPCR1 and CD55 (A) and the enterocyte markers ACE2 and MAOA (B) relative to the stem group (n = 3 independent human lines). **P < 0.01, ***P < 0.001, ****P < 0.0001 by one‐way ANOVA and Tukey's post‐test.
-
C, DMouse colon spheroids were cultured as indicated. Quantification of the average mRNA expression ± s.e.m. of the WAE marker Dpcr1 (C) and the colonocyte marker Car4 (D) relative to stem group (n = 3 independent experiments). *P < 0.05, **P < 0.01 as determined by one‐way ANOVA and Tukey's post‐test.
To further confirm that in vitro WAE cells resembled in vivo WAE cells, we next compared their ultrastructure and histology. Cells treated with dmPGE2 had an increased cytoplasmic to nuclear ratio compared to spheroid stem cells and an apical brush border (although the microvilli were short), consistent with being a differentiated intestinal epithelial cell type (Fig 4G–I). The cytoplasm of these cells contained prominent vacuoles and lysosomes, consistent with highly migratory cells (Tuloup‐Minguez et al, 2013; Fig 4J). These features are in accordance with GO term analysis of the WAE cell gene clusters, which showed enrichment for vacuolar and lysosomal membrane terms (Fig 4B). In vivo WAE cells shared similar ultrastructural features (Fig 4G). We next examined histological sections stained for F‐actin to visualize the brush border and β‐catenin to visualize the plasma membrane. The dmPGE2‐treated spheroids were composed of flattened, squamous cells with thin apical F‐actin staining, similar to in vivo WAE cells (diclofenac‐induced ulcer) (Fig 4K). Together, these data demonstrate that the transcriptional, histological, and ultrastructural features of the WAE cells generated in vitro upon dmPGE2 treatment closely resemble WAE cells observed in vivo.
Inhibition or absence of PGE2‐EP4 signaling leads to enterocyte differentiation
We noted that the EP4i‐treated cells exhibited a columnar shape and apical enrichment for F‐actin, features consistent with enterocytes (Fig 5A; Crawley et al, 2014). Therefore, we analyzed the genes most highly enriched after EP4i treatment and found many genes known to be highly enriched in enterocytes, including Fabp1, Ace2, and Maoa (Iemhoff & Hulsmann, 1971; Gordon et al, 1985; Sivasubramaniam et al, 2003; Hamming et al, 2004; Narisawa et al, 2007). We used quantitative PCR to validate the enrichment of these mRNAs in the EP4i‐treated spheroids (mouse and human; Figs 5B and EV2) and immunostaining to validate the expression of Ace2 protein (Fig 5C) in the EP4i‐treated spheroids. For mouse colonic spheroids, we validated that EP4i treatment resulted in induction of a colonocyte marker, Car4 (Kaiko et al, 2016; Fig EV2). Pathway and GO term analysis of the gene cluster specifically associated with EP4i treatment (Cluster 3; 289 probes) showed enrichment for functions associated with mitochondria, including metabolism, TCA cycle, respiratory electron transport, and oxidative phosphorylation pathways (Fig 5D and E). Ultrastructure analysis of EP4i‐treated cells showed that these cells had a columnar shape, basally located nucleus, large cytoplasm with abundant mitochondria, and a well‐developed brush border composed of long, densely packed microvilli (Figs 4H and I, and 5F and G). These features were all consistent with enterocytes (Cheng & Leblond, 1974a; Crawley et al, 2014).
Figure 5. Inhibition of the prostaglandin receptor EP4 produces enterocytes in vitro .

-
ARepresentative image of a mouse spheroid stained for β‐catenin (green) and F‐actin (red). Nuclei are visualized with bisbenzimide (blue). A similarly stained section of a mouse villus is shown for comparison. Arrowheads indicate the apical cell membrane. Scale bars, 50 μm.
-
B, CMouse jejunal spheroids were cultured as indicated. (B) Quantification of the average expression ± s.e.m. of Fabp1, Ace2, and Maoa mRNAs (n = 3 independent experiments). *P < 0.05, **P < 0.01 by one‐way ANOVA and Tukey's post‐test. (C) Representative images of spheroids stained for Ace2 (green) and β‐catenin (red). Nuclei are visualized with bisbenzimide (blue). Scale bars, 20 μm.
-
D, EGraphs showing the top five most significant pathways (D) and gene ontology cellular component terms (E) associated with Cluster 3.
-
F, GRepresentative TEM images of EP4i‐treated spheroids. (F) The basal plasma membranes are outlined in orange solid lines, lateral plasma membranes are indicated with orange arrowheads, and nuclei are outlined with wide yellow dashed lines. Inset shows a magnified view of the apical cell surface. (G) Higher power image of the cytoplasm. Single mitochondria are outlined with a narrow blue dashed line. Scale bars, 1 μm.
-
HGraph of spheroid oxygen consumption rate (OCR) to extracellular acidification rate (ECAR) ratio expressed as mean ± s.e.m. (n = 3 independent experiments). **P < 0.01 by one‐way ANOVA and Tukey's post‐test.
We used the Seahorse Bioscience assay to test the differences in oxidative phosphorylation predicted by microarray. We found a higher oxidation consumption rate to extracellular acidification rate (OCR/ECAR) ratio with EP4i‐treated cells as compared to stem cells or PGE2‐treated cells (Fig 5H), suggesting that EP4i‐treated cells favor oxidative phosphorylation. This result is consistent with a recent report demonstrating greater OCR/ECAR ratio in differentiating daughter cells compared to Lgr5‐positive intestinal stem cells (Fan et al, 2015). We also assessed secretory cells (endocrine, goblet, and Paneth cells) in the EP4i‐treated spheroids and found that these constituted a very small proportion (~5%) of the total cell number (Fig EV3). Overall, the transcriptional analysis and its validation suggested that PGE2‐EP4 signaling regulates a cell fate decision primarily between enterocytes and WAE cells.
Figure EV3. Limited presence of secretory cell populations in EP4i‐treated spheroids.
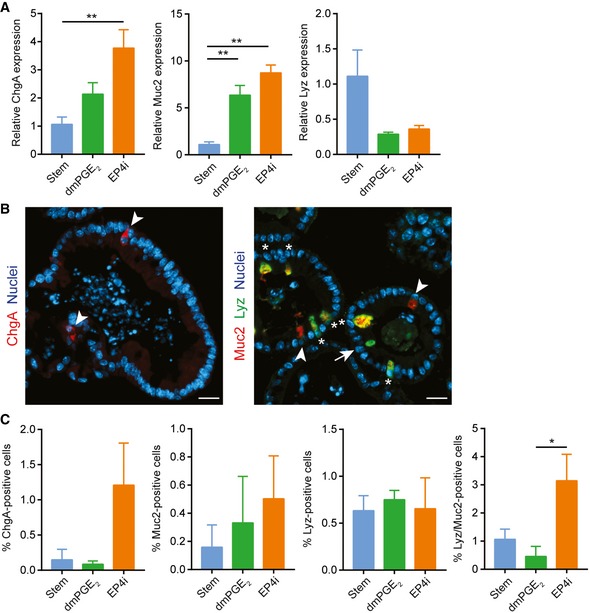
-
A–CMouse jejunal spheroids were cultured in stem cell medium or in differentiation medium containing dmPGE2 or EP4i followed by assessment of intestinal secretory lineages. *P < 0.05, **P < 0.01 by one‐way ANOVA and Tukey's post‐test. (A) Quantification of the average mRNA expression ± s.e.m. of the endocrine marker chromogranin A (ChgA), the goblet cell marker mucin 2 (Muc2), and the Paneth cell marker lysozyme (Lyz) relative to the stem group (n = 3 independent experiments). (B) Representative fluorescent images of histological sections of spheroids stained with ChgA (red; arrowheads) or co‐stained for Muc2 (red; arrowheads) and Lyz (green; arrows) as indicated. Asterisks indicate cells that co‐expressed Muc2 and Lyz. Nuclei are visualized with bisbenzimide (blue). Scale bars, 20 μm. (C) Quantification of the cells expressing the indicated protein markers as a percentage ± s.e.m. of the total nuclei counted per group (n = minimum of three images counted from each treatment group; two independent experiments).
PGE2 treatment dominates cell fate plasticity
We next tested whether the cell fate choice between WAE cells and enterocytes was permanent. To do this, we first determined the time course of differentiation; mRNA expression levels of WAE cell genes (Dpcr1 and Cd55b) and enterocyte genes (Fabp1 and Ace2) were assessed at 2, 6, 12, and 24 h after starting treatment with differentiation medium containing dmPGE2 or EP4i. The WAE cell mRNAs were detected by 6 h of treatment (Fig 6A). In contrast, enterocyte mRNA induction did not occur until 12–24 h of treatment (Fig 6B). These results suggest that WAE cell genes are rapidly and directly induced by EP4 signaling, whereas enterocyte genes are more slowly induced, likely indicative of a transcriptional cascade orchestrating enterocyte differentiation. To test whether expression of these markers was permanent, we treated spheroids with either dmPGE2 or EP4i for 12 h. We then washed out the media and re‐fed with the opposing treatment for an additional 12 h. If spheroids were treated during the second 12‐h period with dmPGE2, then the WAE cell markers Dpcr1 and Cd55b were expressed, regardless of the treatment during the initial 12 h (Fig 6C). In contrast, the enterocyte markers Fabp1 and Ace2 were suppressed if spheroids were treated with dmPGE2 in either phase (Fig 6D). These results indicate that PGE2 is a potent inhibitor of enterocyte differentiation that irreversibly alters epithelial cell fate.
Figure 6. PGE2‐EP4 signaling controls a differentiation switch between wound‐associated epithelial cells and enterocytes.
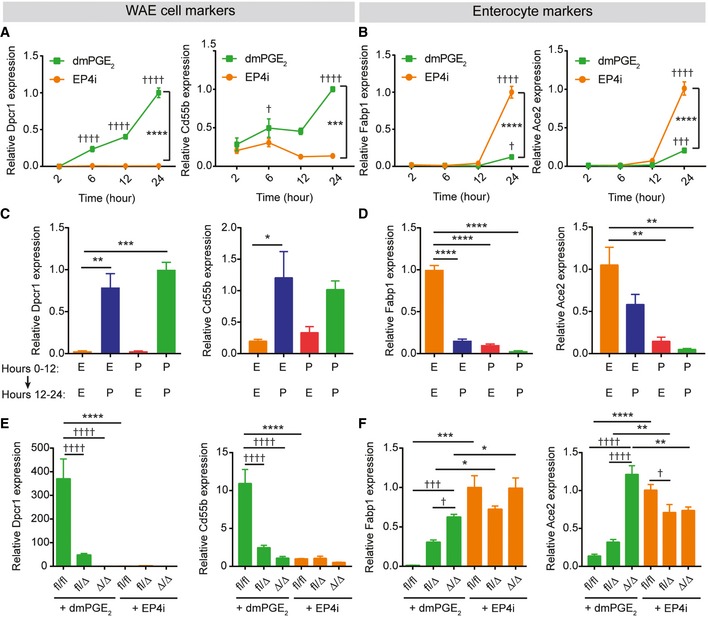
-
A–DQuantification of the average expression ± s.e.m. of Dpcr1 and Cd55b mRNAs (A, C) or Fabp1 and Ace2 mRNAs (B, D) in mouse jejunal spheroids cultured in differentiation medium containing EP4i or dmPGE2. (A, B) Gene expression analyzed 2, 6, 12, or 24 h after the start of treatment (n = 3 independent experiments). ***P < 0.001, ****P < 0.0001 comparing the two treatment groups and † P < 0.05, ††† P < 0.001, †††† P < 0.0001 compared to the 2‐h time point of the same medium by two‐way ANOVA and Sidak's multiple comparisons test. (C, D) Gene expression was analyzed after culturing spheroids in EP4i (E) or dmPGE2 (P) for the first 12 h followed by washout and re‐feeding with EP4i or dmPGE2 for the second 12 h as shown (n = 3 independent experiments). *P < 0.05, **P < 0.01, ***P < 0.001, and ****P < 0.0001 by one‐way ANOVA and Dunnett's post‐test.
-
E, FGene expression was analyzed in Ptger4 flox/flox, Ptger4 flox/Δ, and Ptger4 Δ/Δ spheroids and expressed as fold change relative to EP4i‐treated Ptger4 flox/flox (n = 3 independent experiments). *P < 0.05, **P < 0.01, ***P < 0.001, ****P < 0.0001 by two‐way ANOVA and Tukey's post‐test comparing the genotypes within a treatment group. † P < 0.05, ††† P < 0.001, †††† P < 0.0001 by two‐way ANOVA and Sidak's post‐test comparing the effects of the treatments within a genotype.
We observed that dmPGE2 was unable to induce WAE cells in EP4‐deficient spheroids (Figs 2 and 6E). This finding led us to next interrogate whether these cells were instead directed to the enterocyte fate. We found that the enterocyte markers Fabp1 and Ace2 were similarly induced following dmPGE2 or EP4i treatment in EP4‐deficient cells (Fig 6F), suggesting that the enterocyte program is the default differentiation pathway. Moreover, these data further support that, during the response to injury, PGE2 not only augments the WAE program of differentiation but also suppresses the enterocyte program of differentiation. Of note, EP4 heterozygous spheroids exhibited an intermediate phenotype, with partial induction of both WAE and enterocyte markers (Figs 2 and 6E and F). These data suggest that a certain threshold of PGE2‐EP4 signaling must be met for full suppression of enterocyte differentiation and full activation of WAE cell differentiation.
Inhibition of GSK‐3β suppresses enterocyte differentiation
We next investigated the cellular signaling events that occur downstream of the EP4 receptor to direct differentiation to the WAE cell lineage. EP4 signaling is known to activate adenylate cyclase followed by cAMP formation (Konya et al, 2013). We confirmed this in our system by treating spheroids with forskolin, an adenylate cyclase activator. This treatment stimulated the WAE cell‐associated morphological alterations and induced Cldn4 mRNA in small intestinal spheroids (Fig 7A and B). The morphologic effects were similar to previous reports using forskolin (Dekkers et al, 2013; Schwank et al, 2013). cAMP is known to activate a multitude of effector proteins. Because of the abundant transcript differences and the altered differentiation states between PGE2‐ and EP4i‐treated cells, we reasoned that a transcriptional regulator would be altered downstream of PGE2‐EP4 signaling. We took a candidate approach based on the literature and focused on glycogen synthase kinase‐3β (GSK‐3β), as several lines of evidence have indicated that PKA signaling (a target of cAMP) can suppress GSK‐3β (Jensen et al, 2007; Hundsrucker et al, 2010; Whiting et al, 2015). GSK‐3β phosphorylates β‐catenin and promotes its degradation (Krausova & Korinek, 2014). Therefore, we determined protein levels of nuclear β‐catenin in spheroids cultured as stem cells or cultured in differentiation medium and treated with dmPGE2 or EP4i (Figs 7C and EV4). As expected, significant levels of nuclear β‐catenin were detected in stem cell spheroids but not in EP4i‐treated spheroids. This is consistent with canonical Wnt signaling in vivo, which is active in intestinal stem cells and inactive in enterocytes (Clevers, 2013; Krausova & Korinek, 2014). Interestingly, dmPGE2‐treated spheroids exhibited high levels of nuclear β‐catenin that were similar to those in stem cell spheroids. To functionally test whether inhibition of GSK‐3β could recapitulate the effects of dmPGE2, we treated spheroids with the GSK‐3β inhibitor CHIR 99021 in addition to EP4i (to ensure inhibition of endogenous PGE2 signaling). CHIR 99021 inhibited the degradation of nuclear β‐catenin (Figs 7D and EV4). CHIR 99021 also suppressed mRNA expression of the enterocyte marker Fabp1 and induced mRNA expression of the WAE cell marker Cldn4 in a dose‐dependent manner (Fig 7E and F). Histological analysis of Ptger4 Δ/Δ spheroids showed that the accumulation of actin filaments on the apical surface observed in DMSO‐treated spheroids was abolished by CHIR 99021 (Fig 7G). Together, these results indicate that PGE2 suppresses enterocyte differentiation to promote WAE cell differentiation through maintenance of nuclear β‐catenin.
Figure 7. Nuclear β‐catenin signaling without canonical Wnt signaling suppresses enterocyte and promotes wound‐associated epithelial cell differentiation.

-
A, BMouse jejunal spheroids were cultured in differentiation medium containing 10 μM of forskolin or an equivalent volume of DMSO. (A) Representative bright‐field images. Scale bars, 200 μm. (B) Quantification of the average expression ± s.e.m. of Cldn4 mRNA relative to the DMSO treatment group (n = 3 independent experiments). *P < 0.05 compared to DMSO group by unpaired t‐test.
-
C, DRepresentative immunoblots for β‐catenin detected in nuclear (Nuc) and cytoplasmic (Cyt) protein lysates. Lamin A/C and actin were used as loading controls for the nuclear and cytoplasmic fractions, respectively (n = 3 independent experiments). (C) Spheroids were cultured in stem, enterocyte (EP4i), or WAE (dmPGE2) media. (D) Spheroids were cultured in enterocyte medium with DMSO or 10 μM CHIR 99021.
-
E, FSpheroids were cultured in enterocyte medium with the indicated concentrations of CHIR 99021. Quantification of the average expression ± s.e.m. of Cldn4 (E) and Fabp1 (F) mRNAs shown as fold change relative to 0 μM group (n = 3 independent experiments). **P < 0.01, ****P < 0.0001 as determined by one‐way ANOVA and Dunnett's post‐test.
-
GRepresentative images of Ptger4 Δ/Δ spheroids cultured in differentiation medium with DMSO or 10 μM CHIR 99021 and stained for β‐catenin (green) and F‐actin (red). Nuclei are visualized with bisbenzimide (blue). Arrowheads indicate the apical cell membrane. Scale bars, 20 μm.
-
HGraph of TOPFlash (TOP) to FOPFlash (FOP) luciferase reporter ratios ± s.e.m. (n = 3 independent experiments) in transfected 293FT cells treated with conditioned mediums collected from L‐WRN cells and diluted as indicated. L‐WRN CM had been produced in the presence or absence of the porcupine inhibitor C59 (10‐fold dilutions, 10 μM to 1 pM). *P < 0.05, ***P < 0.001, ****P < 0.0001 by one‐way ANOVA and Dunnett's post‐test compared to 0% L‐WRN CM group.
-
I, JSpheroids were cultured in enterocyte media, WAE media, or WAE media containing 100 pM C59. Quantification of the average expression ± s.e.m. of Cldn4 (I) and Fabp1 (J) mRNAs shown as fold change relative to EP4i group (n = 3 independent experiments). ***P < 0.001, ****P < 0.0001 as determined by one‐way ANOVA and Tukey's post‐test.
-
KQuantification of the average expression ± s.e.m. of Axin2 mRNA in spheroids cultured in stem cell or in differentiation medium with the indicated supplements relative to stem (n = 3 independent experiments). ****P < 0.0001 compared to stem cell group as determined by one‐way ANOVA and Dunnett's post‐test.
Figure EV4. β‐catenin localizes to the nucleus of wound‐associated epithelial cells in vitro .

Representative histological sections of mouse jejunal spheroids cultured in stem, enterocyte (EP4i), or WAE (dmPGE2) media or in enterocyte medium containing 10 μM CHIR 99021 or an equivalent volume of DMSO were immunostained for β‐catenin (brown). Nuclear localization of β‐catenin was observed in the positive control samples (Stem, EP4i + CHIR 99021) and in the PGE2‐treated spheroids, but not in the negative control samples (EP4i, EP4i + DMSO). Scale bars, 20 μm. Insets show a high magnification view of the boxed regions in the low magnification images.
We considered that active canonical Wnt signaling could cause nuclear β‐catenin localization in WAE cells (Krausova & Korinek, 2014). As the differentiation medium used to generate WAE cells does not contain Wnt ligands, we tested whether the WAE‐enriched spheroids were secreting and responding to Wnts in a cell‐autonomous manner. Our microarray data highlighted mRNAs encoding several Wnt ligands that were potentially expressed in the PGE2‐treated cells (Appendix Fig S3). Due to functional redundancy among Wnt ligands, we chose to block all Wnt secretion with a pharmacological inhibitor of porcupine, an essential enzyme for Wnt lipidation and secretion (Proffitt et al, 2013). We first determined the effective concentration of porcupine inhibitor using the L‐WRN cell line because these cells abundantly secrete Wnt3a (Miyoshi et al, 2012). L‐WRN cells were cultured in the presence or absence of the porcupine inhibitor C59 to generate conditioned media. These media were applied to 293FT cells expressing the TOP/FOPFlash luciferase reporter system to measure the Wnt signaling activity (Fig 7H). C59 concentrations from 10 μM to 100 pM potently inhibited Wnt secretion by L‐WRN cells.
We next tested whether C59 had an inhibitory effect on the formation of WAE cells. We found that spheroids treated with PGE2 and C59 had a similar induction of Cldn4 mRNA as those treated with PGE2 alone (Fig 7I), and low expression levels of Fabp1 mRNA were observed in both of these treatment groups compared to EP4i‐treated spheroids (Fig 7J). These data show that WAE differentiation in the spheroids is not mediated by cell‐autonomous Wnt signaling. Furthermore, they suggest that a mechanism other than canonical Wnt signaling is driving the accumulation of nuclear β‐catenin in WAE cell spheroids. Accordingly, we observed that the mRNA levels of Axin2, a transcriptional readout for canonical Wnt signaling (Jho et al, 2002; Lustig et al, 2002), were extremely low in WAE cells compared to stem cells (Fig 7K).
EP4 is required for WAE cell differentiation and wound healing in vivo
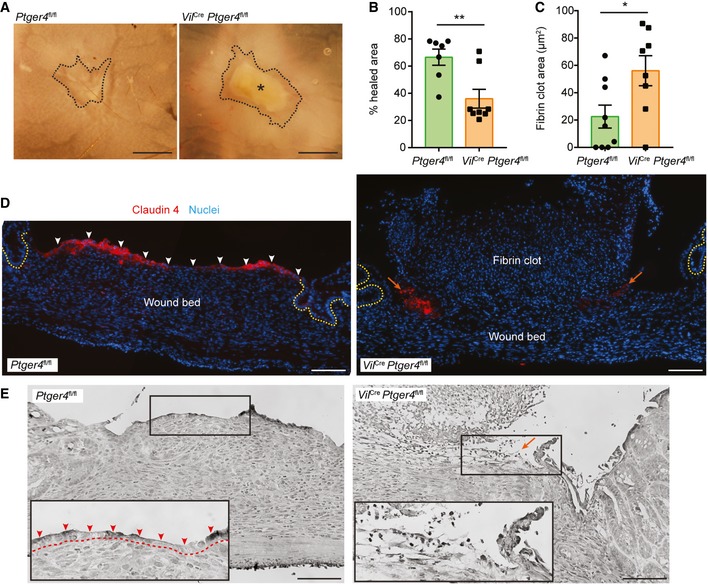
We have shown that PGE2 is sufficient to form WAE cells using our in vitro model. However, there are many factors that have been proposed to affect intestinal epithelial restitution (Dignass, 2001) and these or others could potentially compensate for loss of PGE2‐EP4 signaling in vivo. Thus, to test the requirement for EP4‐mediated signaling to form WAE cells during wound healing, we utilized a colonic biopsy injury model (Seno et al, 2009; Manieri et al, 2012, 2015; Miyoshi et al, 2012). We chose this model because the location and timing of injury and mucosal healing is controlled and well understood (Seno et al, 2009). To examine the role of PGE2‐EP4 signaling in the intestinal epithelium, we bred Ptger4 flox/flox mice (Schneider et al, 2004) with Vil Cre mice (Madison et al, 2002) and generated mice that were deficient for Ptger4 expression specifically in intestinal epithelial cells (Vil Cre Ptger4 flox/flox). Vil Cre Ptger4 flox/flox and Ptger4 flox/flox littermate controls were biopsy‐injured and wound repair was assessed 4 days post‐injury, a time at which WAE cells should completely cover the wound surface (Seno et al, 2009). Although similar numbers of crypts were initially removed during biopsy injury, we consistently observed decreased healing in the Vil Cre Ptger4 flox/flox mice compared to the controls 4 days post‐injury by whole‐mount microscopy (Fig 8A and B), suggesting impaired or delayed healing. In addition, fibrin clots were frequently found to be covering the wound surface in Vil Cre Ptger4 flox/flox mice to a greater extent than control mice (Fig 8C). Histological analysis of wounded regions showed that a layer of flattened, Cldn4‐positive cells was covering the wound surface in control injured mice (Fig 8D and E). These wound surface cells also exhibited accumulation of nuclear β‐catenin (compared to surface epithelial cells of uninjured regions of colonic tissue), lacked Axin2 and Lgr5 expression, and were non‐proliferative, similar to in vitro WAE cells (Fig EV5). In contrast, a layer of flattened, Cldn4‐positive epithelial cells was lacking at the Vil Cre Ptger4 flox/flox wound surfaces (Fig 8D and E). Instead, Cldn4‐positive cells were only located at the edge of the wound and were frequently non‐adherent. These data confirm that expression of EP4 in the intestinal epithelium is critical for complete covering of the wound bed with WAE cells and proper epithelial restitution in response to intestinal biopsy injury.
Figure 8. Intestinal epithelium deficient for Ptger4 lacks wound‐associated epithelial cells and has delayed wound repair following biopsy injury.
-
ARepresentative whole‐mount images of wounds from Ptger4 flox/flox (Ptger4 fl/fl) and Vil Cre Ptger4 flox/flox (Vil Cre Ptger4 fl/fl) mice 4 days post‐biopsy injury. Scale bars, 750 μm. Wounds are outlined with a black dashed line. Asterisk indicates fibrin clot.
-
B, CQuantification of percent healing (1 – [day 4 wound area/original wound area] × 100) (B) and fibrin clot areas (C) ± s.e.m. (n = 7–8 mice per genotype with 3–4 wounds each, three independent experiments). *P = 0.0270, **P = 0.0057 by two‐tailed unpaired t‐test.
-
D, ERepresentative images of serial wound tissue sections from the indicated genotypes. (D) Fluorescent images of sections stained for Claudin‐4 (red). Nuclei are visualized with bisbenzimide (blue). Epithelial crypts adjacent to the wound bed are indicated by dashed yellow lines. Layer of adherent WAE cells indicated by white arrowheads. Non‐adherent residual WAE cells indicated by orange arrows. (E) Grayscale images of hematoxylin‐ and eosin‐stained sections. Insets of the boxed regions show a higher magnification of the region typically containing WAE cells (red arrowheads, dashed line indicates border with wound bed). Orange arrow indicates region of non‐adherent residual WAE cells. Scale bars, 100 μm.
Figure EV5. Nuclear β‐catenin but not canonical Wnt signaling targets are present in wound‐associated epithelial cells in vivo .

-
A, BRepresentative high power, bright‐field images of control mice wound tissue sections immunostained for β‐catenin (brown). Scale bars, 20 μm. (A) WAE cells covering wound bed. (B) Surface colonocytes from an uninjured area. Examples of cells with accumulation of nuclear β‐catenin are indicated by arrows, whereas examples of cells with strong membrane staining but low nuclear β‐catenin staining are indicated with arrowheads.
-
CRepresentative in situ hybridization result for Axin2 mRNA on day 6 post‐biopsy showing accumulation of signal at the crypt bases where stem cells reside (arrows), but no signal in WAE cells (arrowheads). Scale bar, 50 μm.
-
DRepresentative whole‐mount fluorescent image of colonic wound on day 6 post‐biopsy. Endogenous GFP expression is driven by the Lgr5 promoter (this genetic mouse model has mosaic GFP expression). The wounded area is outlined in a dashed white line. Scale bar, 50 μm.
-
ERepresentative image of control mouse wound tissue section on day 4 post‐biopsy stained for Ki67 (green). Nuclei are visualized with bisbenzimide (blue). The white dashed line separates the non‐proliferative WAE cells from the highly proliferative cells of the wound bed. Scale bar, 50 μm.
Discussion
We identified the prostaglandin PGE2 as a factor that is necessary and sufficient to promote WAE differentiation and wound repair after mucosal injury. In the older literature, flattened, migratory epithelial cells were shown to be responsible for quickly re‐establishing the epithelial barrier after mucosal injury (Svanes et al, 1982; Ito et al, 1984; Lacy, 1988; Moore et al, 1989). Subsequent tracing experiments showed that WAE cells emanate from crypt stem cells adjacent to the wound bed (Miyoshi et al, 2012). Here, we identified PGE2 as a potent inductive factor that directly acts on crypt epithelial cells to produce this atypical epithelial cell type. This mechanism appears to be conserved in mouse and human. Primary columnar intestinal epithelial cells cultured with PGE2 rapidly transitioned to a squamous cell shape and induced WAE cell markers within 2–6 h after treatment. Inhibition of the EP4 receptor in intestinal epithelial cells either pharmacologically or by genetic deficiency abolished these effects and impaired wound healing in vivo. We showed that WAE cells were post‐mitotic and exhibited transcriptional and ultrastructural features consistent with in vivo WAE cells. Our findings agree with early epithelial restitution studies, which also reported the short time frame of this process and indicated a primary dependence on cellular migration that was independent of cellular proliferation (Lacy, 1988; Wilson & Gibson, 1997; Dignass, 2001). Thus, our work highlights the unique nature of the gastrointestinal wound response and WAE cells in particular. In contrast, skin wound healing requires dedifferentiation of epidermal cells and migration of this proliferative cell type to cover and re‐epithelialize wound surfaces (Singer & Clark, 1999; Gurtner et al, 2008).
We found that PGE2 suppressed the enterocyte differentiation program and redirected differentiating intestinal epithelial cells to the WAE cell lineage. In the intestine, stem cells located at the crypt base continually produce daughter cells that migrate out of the crypt and onto the villus to replenish the intestinal epithelium. Our data suggest that PGE2 produced in response to injury can direct intestinal stem cells, progenitor cells, and/or immature enterocytes to the WAE lineage. Addition of PGE2 12 h into the differentiation process could still activate WAE cell differentiation. Thus, the continually renewing intestinal epithelium provides a perpetual source of cells that, when called upon, can rapidly acquire a migratory phenotype and act to cover wound surfaces. It is important to note that the presence of WAE cells is transient and typically lasts only a few days (Seno et al, 2009; Miyoshi et al, 2012). In addition, once epithelial cell commitment to the WAE lineage has been triggered by PGE2, enterocyte differentiation is irreversibly blocked. We propose that the quick onset and durability of WAE differentiation is a protective mechanism for the host. Once a wound is sealed by WAE cells, prostaglandins diminish (Manieri et al, 2012). The WAE cells are then rapidly replaced by newly formed enterocytes during the later phase of repair.
Cross talk between mesenchymal cells and epithelial cells is critical for wound repair in the intestine. We have previously reported that intestinal injury results in activation and enrichment of mesenchymal stem cells that express Ptgs2, the rate‐limiting enzyme for PGE2 production, in close proximity to the crypts adjacent to injured regions and migrating WAE cells (Brown et al, 2007; Malvin et al, 2012; Manieri et al, 2012). Proper activation and positioning of the Ptgs2‐expressing cells is dependent both on injury and Myd88 signaling (Brown et al, 2007; Malvin et al, 2012). Taken together with the current study, we propose the following model for the early repair process (Fig 9): (i) Mucosal injury results in activation of TLR/Myd88 signaling in the stromal compartment, (ii) TLR/Myd88 signaling activates and enriches for Ptgs2‐positive cells at the site of injury to stimulate high local production of PGE2, (iii) PGE2 signals to several local target cell populations, including intestinal epithelial cells, to mediate the repair response, (iv) PGE2 signals through the EP4 receptor to direct intestinal stem cells, progenitor cells, and likely immature enterocytes to form WAE cells. This mechanism allows the intestinal epithelium to rapidly mount an adequate early repair response and form sufficient numbers of WAE cells without relying on cellular proliferation.
Figure 9. Model of wound‐associated epithelial cell formation in response to mucosal injury.
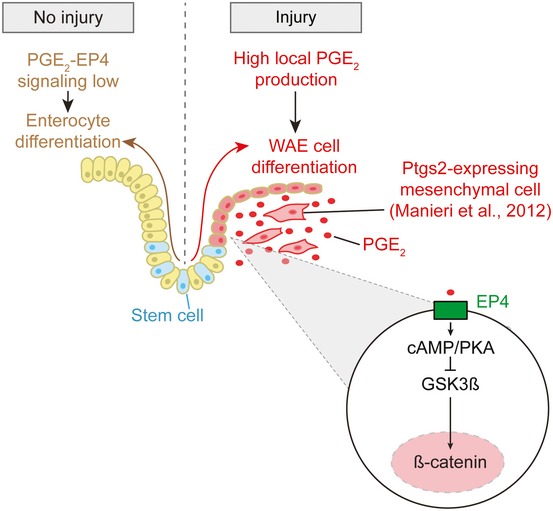
In the absence of injury, PGE2‐EP4 signaling does not reach the signal threshold required for WAE cell formation, and enterocytes differentiate from intestinal epithelial stem cells in accordance with their normal program of differentiation. Upon mucosal injury, Ptgs2‐expressing mesenchymal cells become localized to the wound bed in close proximity with the migrating WAE cells. High local production of PGE2 signals to the EP4 receptor on differentiating intestinal epithelial cells to induce formation of WAE cells, which migrate to cover and seal the wound bed, thereby re‐establishing the epithelial barrier.
We found accumulation of nuclear β‐catenin in WAE cells, and this was functionally important for their formation. In the intestine, Wnt/β‐catenin signaling is critical for maintenance of the intestinal epithelial stem cell compartment (Krausova & Korinek, 2014). Inducible loss of β‐catenin in the intestinal epithelium results in rapidly diminished proliferation and differentiation of stem cells (Ireland et al, 2004; Fevr et al, 2007), whereas forced β‐catenin expression results in polyp and tumor formation (Wong et al, 1996, 1998; Harada et al, 1999; van Es et al, 2005). Thus, it is challenging to genetically manipulate β‐catenin signaling in vivo or in vitro within a time frame that allows for the study of its role in WAE cells and intestinal wound repair. Instead, we used a GSK‐3β inhibitor to treat spheroid epithelial cells deficient in EP4 and showed that the resulting accumulation of nuclear β‐catenin was sufficient to suppress enterocyte gene induction and promote WAE cell formation. There is an accumulating body of evidence linking cell adhesive and migratory properties with alterations in β‐catenin signaling (Daugherty & Gottardi, 2007; Maher et al, 2009; Amini‐Nik et al, 2014). As WAE cells are migratory and exhibit high levels of nuclear β‐catenin, our data provide further support of this literature. However, as canonical Wnt signaling was not active in WAE cells, some factor other than canonical Wnt ligands (e.g. extracellular matrix components) (Bielefeld et al, 2011) must be critical for regulating β‐catenin in these cells. Further study of the transcriptional mechanisms that regulate WAE cells could yield new insights into the relationship between cell adhesiveness and β‐catenin signaling.
EP4 agonist treatment has been shown to provide a beneficial effect in rodent models of colitis (Kabashima et al, 2002; Nitta et al, 2002; Jiang et al, 2007; Okamoto et al, 2012; Watanabe et al, 2015) and in a Phase II trial with ulcerative colitis patients (Nakase et al, 2010). Accordingly, there is interest in the potential for using EP4 agonists to treat inflammatory bowel disease patients. Although the beneficial effects of EP4 agonists are likely mediated through multiple EP4‐expressing cell types, our data suggest that one benefit could be an improved wound repair response of the intestinal epithelium. We found that Ptger4 expression levels were critical for WAE cell formation. Intestinal spheroids heterozygous for Ptger4 exhibited a haploinsufficiency phenotype, with impaired WAE cell formation and skewing toward the enterocyte lineage. These data are intriguing because PTGER4 is the closest gene to one of the most significant susceptibility loci for inflammatory bowel disease (Jostins et al, 2012; Liu et al, 2015). SNPs within this locus have been proposed to regulate PTGER4 gene expression (Libioulle et al, 2007; Glas et al, 2012); however, it is currently unknown how this susceptibility region contributes to disease. PTGS2 (aka COX‐2) has also been implicated as a candidate susceptibility gene for inflammatory bowel disease in a recent meta‐analysis of patients of European descent (Liu et al, 2015). Thus, we speculate that genetic variations at these loci could potentially affect PGE2‐EP4 signaling in human intestinal epithelial cells, leading to inter‐individual variation in the ability to form WAE cells and efficiently repair wounds upon mucosal damage.
Materials and Methods
Mice
All animal studies were performed according to protocols approved by the Washington University School of Medicine Animal Studies Committee. Mice were maintained in a specific pathogen‐free barrier facility with a strict 12‐h light cycle. Experiments utilized mice that were 8–10 weeks old. Vil Cre mice (Madison et al, 2002) obtained from Jackson Laboratory (Bar Harbor, ME) were crossed to previously described Ptger4 flox/flox mice (Schneider et al, 2004) to generate intestinal epithelium with Ptger4 flox/flox, Ptger4 flox/Δ, or Ptger4 Δ/Δ genotype. All experimental mice were littermates on the C57BL/6 background. The following primers were used for PCR genotyping: Vil Cre forward primer 5′‐gtg tgg gac aga gaa caa acc‐3′; Vil Cre reverse primer 5′‐aca tct tca ggt tct gcg gg‐3′; Ptger4 locus forward primer 5′‐gtg cgg aga tcc aga tgg tc‐3′; Ptger4 locus reverse primer 5′‐cgc act ctc tct ctc cca agg aa‐3′. Lgr5‐EGFP‐IRES‐creERT2 mice (Barker et al, 2007) were obtained from the Jackson Laboratory.
Colonic biopsy and tissue preparation
Colorectal injuries (3–4 wounds/mouse) were created using a high‐resolution miniaturized colonoscope as previously described (Seno et al, 2009; Manieri et al, 2012, 2015). Mice were sacrificed 4 days after biopsy injury unless stated otherwise. Dissected colons were opened longitudinally to obtain images of the mucosal gross morphology using an Olympus SZX12 stereo dissection microscope equipped with an Olympus DP70 digital camera and DP Controller software. Tissues fragments (10 × 10 mm) with the wound located at the center were then frozen in OCT. Perpendicular serial 5‐μm sections from the center of each wound were prepared with a cryostat and used for later analysis. Wound and fibrin clot areas were determined with ImageJ (Schneider et al, 2012). Percent healing was determined as (1 – [wound area on day 4/original wound area] × 100). Adobe Photoshop CS6 was used to uniformly adjust the brightness and contrast and crop images.
Spheroid culture of primary small intestinal epithelial cells
For mouse spheroid culture, small intestinal or colonic crypts were isolated from the jejuna of the indicated mice and grown as three‐dimensional epithelial spheroids in Matrigel as previously described (Miyoshi et al, 2012; Miyoshi & Stappenbeck, 2013). For human spheroid cultures, spheroid lines were established from biopsy tissues obtained from three adults during routine endoscopy at the Washington University School of Medicine. This study was approved by the Institutional Review Board of Washington University School of Medicine. Written informed consent was obtained from all donors. The procedures for establishing and maintaining the human spheroid cultures have been previously described (VanDussen et al, 2015).
Stem cell media contained 50% L‐WRN conditioned medium, which is a 50/50 mix of L‐WRN conditioned medium (CM) (collected from an L cell line engineered to secrete Wnt3a, R‐spondin 3, and noggin as previously described (Miyoshi & Stappenbeck, 2013) and fresh primary culture media, which is Advanced DMEM/F‐12 (Invitrogen) supplemented with 20% fetal bovine serum, 2 mM l‐glutamine, 100 units/ml penicillin, and 0.1 mg/ml streptomycin. Differentiation medium is primary culture medium without serum supplemented with 50 ng/ml EGF (Peprotech) and 10 μM Y‐27632 (ROCK inhibitor; R&D Systems). For WAE cell medium, differentiation medium was supplemented with 1 μM dmPGE2 (R&D Systems), unless indicated otherwise. For enterocyte medium, differentiation medium was supplemented with 10 μM L‐161,982 (EP4 inhibitor, R&D Systems). To induce synchronized differentiation, stem cell‐enriched spheroids were trypsinized, plated into fresh Matrigel in 24‐well or 96‐well tissue culture plates, and then grown in differentiation medium containing the indicated supplements for 24 h.
Other cell culture reagents used were SC 51322 (EP1 inhibitor; R&D Systems), PF 04418948 (EP2 inhibitor; R&D Systems), L‐798,106 (EP3 inhibitor; R&D Systems), CHIR 99021 (GSK‐3β inhibitor; R&D Systems), iloprost (PGI2 analog; Cayman Chemical), and Wnt‐C59 (porcupine inhibitor; R&D Systems). Tat‐Cre mediated recombination was used to generate Ptger4 flox/Δ and Ptger4 Δ/Δ spheroid lines from Ptger4 flox/flox spheroids as previously described (Patel et al, 2013). For spheroid genotyping, genomic DNA was isolated with the Qiagen DNeasy Mini kit according to the manufacturer's instructions followed by PCR with the Ptger4 genotyping primers listed above. The luminescence assay with spheroids generated from the jejunum of the Cdc25A‐CBRLuc fusion protein knock‐in mouse was performed as previously described (Sun et al, 2015). Metabolic profiling was performed using a Seahorse XF96e analyzer (Seahorse Bioscience) as previously described (Kaiko et al, 2016).
Live spheroids were imaged with a Pupil Cam camera (Ken‐a‐Vision) fixed to a phase microscope (Fisher Scientific) equipped with an LPL4/0.10 4× objective lens. ImageJ (Schneider et al, 2012) was used to determine the average individual spheroid area from bright‐field images taken in the center of each tissue culture plate well of each sample (n = 4 four images [i.e. wells] and a minimum of 50 spheroids analyzed per sample). Similar densities of spheroids were seeded for all area measurement experiments. Adobe Photoshop CS6 was used to convert images to grayscale, uniformly adjust brightness and contrast, and crop images.
Antibodies
The following antibodies were used for immunostaining: polyclonal goat anti‐Ace2 (AF933, R&D Systems), polyclonal rabbit anti‐ChgA (ab15160, Abcam), polyclonal rabbit anti‐Muc2 (sc‐15334, Santa Cruz), polyclonal goat anti‐Lyz (sc‐27958, Santa Cruz), polyclonal rabbit anti‐Claudin‐4 (36‐4800, Thermo Fisher), monoclonal rabbit anti‐Ki67 (VP‐RM04, Vector), polyclonal rabbit anti‐β‐catenin (Sigma), and monoclonal mouse anti‐β‐catenin (14/B‐catenin, BD Transduction Laboratories). F‐actin was visualized with a rhodamine‐phalloidin conjugate (Invitrogen). For immunoblotting, the following antibodies were utilized: anti‐actin (A2066, Sigma), monoclonal mouse anti‐β‐catenin (14/B‐catenin, BD Transduction Laboratories), mouse monoclonal anti‐GAPDH (6C5, Advanced ImmunoChemicals), and monoclonal mouse anti‐lamin A/C (clone 14, EMD Millipore).
Immunohistochemistry, immunofluorescence, and in situ hybridization
Dissected tissues or recovered intestinal spheroids were fixed with 4% paraformaldehyde (PFA) overnight at 4°C in phosphate‐buffered saline (PBS), immersed in 20% sucrose solution, and then quickly frozen in OCT compound (Sakura Finetek) or embedded as unfixed tissues. Histological sections (4‐μm) were prepared and post‐fixed with 4% PFA, 10% neutral buffered formalin, or methanol. Histological sections were incubated in blocking buffer (3% BSA or 10% normal serum and 1% Triton X‐100 in PBS) followed by addition of diluted primary antibodies in blocking buffer. For immunofluorescence, sections were incubated with Alexa Fluor secondary antibodies conjugated to 488 or 594 fluorophores (Invitrogen), counterstained with bis‐benzamide (Hoechst 33258: Invitrogen) and coverslips were mounted with Fluoromount (Sigma). For immunohistochemistry, sections were incubated with biotin‐conjugated secondary antibodies (Vector Laboratories) followed by visualization with the VECTASTAIN Elite ABC and DAB (3,3′‐diaminobenzidine) Substrate Kits (Vector Laboratories) and coverslips were mounted with Cytoseal XYL (Thermo Scientific). EdU detection was performed using the Click‐iT Plus EdU imaging kit with Alexa Fluor 594 and a 1‐h EdU incorporation period prior to fixation and embedding of spheroids (Molecular Probes, C10639). For the in situ hybridization, antisense probe was generated from a SmaI‐digested Ptger4 mouse cDNA plasmid (GE Dharmacon, Clone ID 3481696) using the T7 promoter and a previously reported probe for Axin2 and methods (Miyoshi et al, 2012). Fluorescent images were acquired with a Zeiss Axiovert 200M inverted microscope equipped with Apochromat (10×/0.25 Ph1 and 20×/0.80) and LD‐A‐Plan 20×/0.30 Ph1 objective lenses, an Axiocam MRm digital camera, and Axiovision LE software. Bright‐field images were acquired with an Olympus BX51 microscope equipped with UPlan 20×/0.50 and 10×/0.30 objective lenses, an Olympus DP70 camera, and DP Controller software. Adobe Photoshop CS6 was used to uniformly adjust brightness and contrast, sharpen and crop images.
Immunoblotting
Matrigel‐embedded intestinal spheroids were first recovered using cell recovery solution (Corning). Next, the NE‐PER Nuclear and Cytoplasmic Extraction Kit (Thermo Fisher Scientific) was used for fractionation of nuclear and cytoplasmic proteins in conjunction with protease inhibitors (Sigma) and phosphatase inhibitors (Nacalai). Denatured protein samples were run on 10% Tris–HCl gels (Bio‐Rad) and transferred onto nitrocellulose membranes (Bio‐Rad). Membranes were incubated in blocking reagent (Blocking One, Nacalai) for 1 h at 4°C, then incubated with primary antibodies diluted with Blocking One overnight at 4°C. Membranes were washed with Tris‐buffered saline containing 0.1% Tween‐20 (TBS‐T) and incubated with horseradish peroxidase‐conjugated secondary antibodies (Bio‐Rad) before detecting signals using the SuperSignal West Dura chemiluminescent kit (Thermo Fisher Scientific).
Transmission electron microscopy
Spheroid–Matrigel mixtures were scraped out of the tissue culture plate wells with a pipette tip in 1 ml of PBS and centrifuged for 5 min at 113 × g to pellet the cells. Mouse colon tissue and pelleted spheroids were fixed with 2% paraformaldehyde/2.5% glutaraldehyde in 100 mM cacodylate buffer, pH 7.2 for 2 h at room temperature. Samples were washed in cacodylate buffer and post‐fixed in 1% osmium tetroxide (Polysciences Inc.) for 1 h. Samples were then rinsed extensively in dH2O prior to en bloc staining with 1% aqueous uranyl acetate (Ted Pella Inc., Redding, CA) for 1 h. Following several rinses in dH2O, samples were dehydrated in a graded series of ethanol and embedded in Eponate 12 resin (Ted Pella Inc.). Sections of 95 nm were cut with a Leica Ultracut UCT ultramicrotome (Leica Microsystems Inc., Bannockburn, IL), stained with uranyl acetate and lead citrate, and viewed on a JEOL 1200 EX transmission electron microscope (JEOL USA Inc., Peabody, MA) equipped with an AMT 8 megapixel digital camera (Advanced Microscopy Techniques, Woburn, MA). Adobe Photoshop CS6 was used to uniformly adjust brightness and contrast and crop images. ImageJ was used to quantify the cytoplasmic and nuclear areas of imaged cells as well as microvillar lengths.
RNA isolation and quantitative RT–PCR
Total RNA was purified using NucleoSpin RNA II kit (Macherey‐Nagel, Duren, Germany). cDNA was synthesized using SuperScript III (Invitrogen), and qPCR was performed using SYBR Green reagents (Clontech, Palo Alto, CA) on an Eppendorf Mastercycler. Primer sequences are listed in Appendix Table S1. Relative expression levels were normalized to GAPDH or B2m (Miyoshi et al, 2012), which were expressed at similar levels in all samples.
Microarray analysis
RNA was isolated from spheroids cultured as described above (n = 4/group). Samples were tested for quality with the Agilent Bioanalyzer followed by cDNA synthesis with the MessageAmp II kit and hybridization to Agilent 4 × 44K mouse gene expression microarrays at the Washington University Genome Technology Access Center (GTAC). Data are deposited at ArrayExpress (http://www.ebi.ac.uk/arrayexpress/; accession number E‐MTAB‐3952). Microarray data from in vivo laser capture microdissected WAE cells in wild‐type mice were previously reported and deposited at ArrayExpress (accession number E‐MTAB‐1175; Miyoshi et al, 2012). Data normalization, statistical analysis, and hierarchical clustering were performed using Partek software. Genes considered to be significantly differentially expressed between at least two treatments had a false discovery rate‐adjusted P < 0.05. Pathway and GO term analyses were performed using the ToppGene Suite (https://toppgene.cchmc.org/).
TOPFlash reporter assay
L‐WRN cells were cultured in 24‐well plates until post‐confluent and then re‐fed with primary culture medium containing C59 (concentration range from 10 μM to 1 pM) or without C59 for 24 h. Conditioned mediums were collected as previously described from three independent passages of cells (Miyoshi & Stappenbeck, 2013). Prior to use in the reporter assay, these media were diluted with 293FT media. M50 Super8x TOPFlash (Addgene plasmid #12456) and M51 Super8x FOPFlash (TOPFlash mutant; Addgene plasmid #12457) were gifts from Randall Moon (Veeman et al, 2003). The reporters were transiently transfected into 293FT cells cultured in 24‐well plates using Lipofectamine 2000 (Thermo Fisher Scientific) according to the manufacturer's directions. The following day, the 293FT cells were stimulated with the conditioned mediums for 24 h. Cell lysates (120 μl total volume) were generated using 1× Cell Culture Lysis Buffer and luminescence (1 s reads) was measured using 20 μl of cell lysate and 100 μl of luciferase substrate (Luciferase Assay System; Promega) with a Cytation 5 Multi‐mode Reader (BioTek). The total protein content of each sample was determined by BCA assay (Thermo Fisher Scientific) and used to perform initial normalization of luciferase activity values. These normalized values were then used to generate the TOP/FOPFlash ratios for each treatment.
Statistical analysis
GraphPad Prism software (version 6) was used to perform all statistical analyses unless indicated otherwise with P < 0.05 considered to be significant.
Author contributions
HM, KLV, and TSS contributed to the conception and design of the study. HM, KLV, SHR, and C‐WL performed the in vitro spheroid experiments. NPM and NMS performed the in vivo mouse experiments. YW performed the in situ hybridization experiment. HM, KLV, SHR, YW, NMS, and NPM contributed to data analysis and interpretation. HM and KLV drafted the manuscript. All authors contributed to editing of the manuscript. TSS obtained funding and supervised the study.
Conflict of interest
The authors declare that they have no conflict of interest.
Supporting information
Appendix
Expanded View Figures PDF
Review Process File
Acknowledgements
The authors thank Dr. Wandy Beatty for transmission electron microscopy. We thank the Genome Technology Access Center (GTAC) in the Department of Genetics at Washington University School of Medicine for help with genomic analysis. This work was supported by grants from the National Institutes of Health (NIH) (DK07161907) and the Crohn's and Colitis Foundation of America (CCFA) Genetics Initiative/Leona M. and Harry B. Helmsley Charitable Trust (# 274415) to T. S. Stappenbeck. K. L. VanDussen was supported by a CCFA Research Fellowship Award (# 290895) and a K01 from the NIH (DK109081). The GTAC is partially supported by the NCI (P30 CA91842 to the Siteman Cancer Center) and the NIH National Center for Research Resources (UL1 TR000448 to the Washington University ICST/CTSA) and the NIH Roadmap for Medical Research.
The EMBO Journal (2017) 36: 5–24
References
- Abramovitz M, Adam M, Boie Y, Carriere M, Denis D, Godbout C, Lamontagne S, Rochette C, Sawyer N, Tremblay NM, Belley M, Gallant M, Dufresne C, Gareau Y, Ruel R, Juteau H, Labelle M, Ouimet N, Metters KM (2000) The utilization of recombinant prostanoid receptors to determine the affinities and selectivities of prostaglandins and related analogs. Biochim Biophys Acta 1483: 285–293 [DOI] [PubMed] [Google Scholar]
- Amini‐Nik S, Cambridge E, Yu W, Guo A, Whetstone H, Nadesan P, Poon R, Hinz B, Alman BA (2014) beta‐Catenin‐regulated myeloid cell adhesion and migration determine wound healing. J Clin Invest 124: 2599–2610 [DOI] [PMC free article] [PubMed] [Google Scholar]
- Barker N, van Es JH, Kuipers J, Kujala P, van den Born M, Cozijnsen M, Haegebarth A, Korving J, Begthel H, Peters PJ, Clevers H (2007) Identification of stem cells in small intestine and colon by marker gene Lgr5. Nature 449: 1003–1007 [DOI] [PubMed] [Google Scholar]
- Becker C, Fantini MC, Wirtz S, Nikolaev A, Kiesslich R, Lehr HA, Galle PR, Neurath MF (2005) In vivo imaging of colitis and colon cancer development in mice using high resolution chromoendoscopy. Gut 54: 950–954 [DOI] [PMC free article] [PubMed] [Google Scholar]
- Bielefeld KA, Amini‐Nik S, Whetstone H, Poon R, Youn A, Wang J, Alman BA (2011) Fibronectin and beta‐catenin act in a regulatory loop in dermal fibroblasts to modulate cutaneous healing. J Biol Chem 286: 27687–27697 [DOI] [PMC free article] [PubMed] [Google Scholar]
- Blikslager AT, Moeser AJ, Gookin JL, Jones SL, Odle J (2007) Restoration of barrier function in injured intestinal mucosa. Physiol Rev 87: 545–564 [DOI] [PubMed] [Google Scholar]
- Brown SL, Riehl TE, Walker MR, Geske MJ, Doherty JM, Stenson WF, Stappenbeck TS (2007) Myd88‐dependent positioning of Ptgs2‐expressing stromal cells maintains colonic epithelial proliferation during injury. J Clin Invest 117: 258–269 [DOI] [PMC free article] [PubMed] [Google Scholar]
- Cheng H, Leblond CP (1974a) Origin, differentiation and renewal of the four main epithelial cell types in the mouse small intestine. I. Columnar cell. Am J Anat 141: 461–479 [DOI] [PubMed] [Google Scholar]
- Cheng H, Leblond CP (1974b) Origin, differentiation and renewal of the four main epithelial cell types in the mouse small intestine. V. Unitarian Theory of the origin of the four epithelial cell types. Am J Anat 141: 537–561 [DOI] [PubMed] [Google Scholar]
- Clevers H (2013) The intestinal crypt, a prototype stem cell compartment. Cell 154: 274–284 [DOI] [PubMed] [Google Scholar]
- Crawley SW, Mooseker MS, Tyska MJ (2014) Shaping the intestinal brush border. J Cell Biol 207: 441–451 [DOI] [PMC free article] [PubMed] [Google Scholar]
- Crosnier C, Stamataki D, Lewis J (2006) Organizing cell renewal in the intestine: stem cells, signals and combinatorial control. Nat Rev Genet 7: 349–359 [DOI] [PubMed] [Google Scholar]
- Daugherty RL, Gottardi CJ (2007) Phospho‐regulation of Beta‐catenin adhesion and signaling functions. Physiology 22: 303–309 [DOI] [PMC free article] [PubMed] [Google Scholar]
- Dekkers JF, Wiegerinck CL, de Jonge HR, Bronsveld I, Janssens HM, de Winter‐de Groot KM, Brandsma AM, de Jong NWM, Bijvelds MJC, Scholte BJ, Nieuwenhuis EES, van den Brink S, Clevers H, van der Ent CK, Middendorp S, Beekman JM (2013) A functional CFTR assay using primary cystic fibrosis intestinal organoids. Nat Med 19: 939–945 [DOI] [PubMed] [Google Scholar]
- Dignass AU, Podolsky DK (1993) Cytokine modulation of intestinal epithelial cell restitution: central role of transforming growth factor beta. Gastroenterology 105: 1323–1332 [DOI] [PubMed] [Google Scholar]
- Dignass A, Lynchdevaney K, Kindon H, Thim L, Podolsky DK (1994) Trefoil peptides promote epithelial migration through a transforming growth‐factor beta‐independent pathway. J Clin Invest 94: 376–383 [DOI] [PMC free article] [PubMed] [Google Scholar]
- Dignass AU (2001) Mechanisms and modulation of intestinal epithelial repair. Inflamm Bowel Dis 7: 68–77 [DOI] [PubMed] [Google Scholar]
- van Es JH, Jay P, Gregorieff A, van Gijn ME, Jonkheer S, Hatzis P, Thiele A, van den Born M, Begthel H, Brabletz T, Taketo MM, Clevers H (2005) Wnt signalling induces maturation of Paneth cells in intestinal crypts. Nat Cell Biol 7: 381–386 [DOI] [PubMed] [Google Scholar]
- Fan YY, Davidson LA, Callaway ES, Wright GA, Safe S, Chapkin RS (2015) A bioassay to measure energy metabolism in mouse colonic crypts, organoids, and sorted stem cells. Am J Physiol Gastrointest Liver Physiol 309: G1–G9 [DOI] [PMC free article] [PubMed] [Google Scholar]
- Fevr T, Robine S, Louvard D, Huelsken J (2007) Wnt/beta‐catenin is essential for intestinal homeostasis and maintenance of intestinal stem cells. Mol Cell Biol 27: 7551–7559 [DOI] [PMC free article] [PubMed] [Google Scholar]
- Glas J, Seiderer J, Czamara D, Pasciuto G, Diegelmann J, Wetzke M, Olszak T, Wolf C, Muller‐Myhsok B, Balschun T, Achkar JP, Kamboh MI, Franke A, Duerr RH, Brand S (2012) PTGER4 expression‐modulating polymorphisms in the 5p13.1 region predispose to Crohn's disease and affect NF‐kappaB and XBP1 binding sites. PLoS One 7: e52873 [DOI] [PMC free article] [PubMed] [Google Scholar]
- Gordon JI, Elshourbagy N, Lowe JB, Liao WS, Alpers DH, Taylor JM (1985) Tissue specific expression and developmental regulation of two genes coding for rat fatty acid binding proteins. J Biol Chem 260: 1995–1998 [PubMed] [Google Scholar]
- Gurtner GC, Werner S, Barrandon Y, Longaker MT (2008) Wound repair and regeneration. Nature 453: 314–321 [DOI] [PubMed] [Google Scholar]
- Hamming I, Timens W, Bulthuis ML, Lely AT, Navis G, van Goor H (2004) Tissue distribution of ACE2 protein, the functional receptor for SARS coronavirus. A first step in understanding SARS pathogenesis. J Pathol 203: 631–637 [DOI] [PMC free article] [PubMed] [Google Scholar]
- Harada N, Tamai Y, Ishikawa T, Sauer B, Takaku K, Oshima M, Taketo MM (1999) Intestinal polyposis in mice with a dominant stable mutation of the beta‐catenin gene. EMBO J 18: 5931–5942 [DOI] [PMC free article] [PubMed] [Google Scholar]
- Hundsrucker C, Skroblin P, Christian F, Zenn HM, Popara V, Joshi M, Eichhorst J, Wiesner B, Herberg FW, Reif B, Rosenthal W, Klussmann E (2010) Glycogen synthase kinase 3 beta interaction protein functions as an A‐kinase anchoring protein. J Biol Chem 285: 5507–5521 [DOI] [PMC free article] [PubMed] [Google Scholar]
- Iatropoulos MJ, Williams GM (1996) Proliferation markers. Exp Toxicol Pathol 48: 175–181 [DOI] [PubMed] [Google Scholar]
- Iemhoff WG, Hulsmann WC (1971) Development of mitochondrial enzyme activities in rat‐small‐intestinal epithelium. Eur J Biochem 23: 429–434 [DOI] [PubMed] [Google Scholar]
- Ireland H, Kemp R, Houghton C, Howard L, Clarke AR, Sansom OJ, Winton DJ (2004) Inducible Cre‐mediated control of gene expression in the murine gastrointestinal tract: effect of loss of beta‐catenin. Gastroenterology 126: 1236–1246 [DOI] [PubMed] [Google Scholar]
- Ito S, Lacy ER, Rutten MJ, Critchlow J, Silen W (1984) Rapid repair of injured gastric mucosa. Scand J Gastroenterol Suppl 101: 87–95 [PubMed] [Google Scholar]
- Jensen J, Brennesvik EO, Lai YC, Shepherd PR (2007) GSK‐3beta regulation in skeletal muscles by adrenaline and insulin: evidence that PKA and PKB regulate different pools of GSK‐3. Cell Signal 19: 204–210 [DOI] [PubMed] [Google Scholar]
- Jessen KR, Mirsky R, Arthur‐Farraj P (2015) The role of cell plasticity in tissue repair: adaptive cellular reprogramming. Dev Cell 34: 613–620 [DOI] [PubMed] [Google Scholar]
- Jho EH, Zhang T, Domon C, Joo CK, Freund JN, Costantini F (2002) Wnt/beta‐catenin/Tcf signaling induces the transcription of Axin2, a negative regulator of the signaling pathway. Mol Cell Biol 22: 1172–1183 [DOI] [PMC free article] [PubMed] [Google Scholar]
- Jiang GL, Nieves A, Im WB, Old DW, Dinh DT, Wheeler L (2007) The prevention of colitis by E prostanoid receptor 4 agonist through enhancement of epithelium survival and regeneration. J Pharmacol Exp Ther 320: 22–28 [DOI] [PubMed] [Google Scholar]
- Jostins L, Ripke S, Weersma RK, Duerr RH, McGovern DP, Hui KY, Lee JC, Schumm LP, Sharma Y, Anderson CA, Essers J, Mitrovic M, Ning K, Cleynen I, Theatre E, Spain SL, Raychaudhuri S, Goyette P, Wei Z, Abraham C et al (2012) Host‐microbe interactions have shaped the genetic architecture of inflammatory bowel disease. Nature 491: 119–124 [DOI] [PMC free article] [PubMed] [Google Scholar]
- Kabashima K, Saji T, Murata T, Nagamachi M, Matsuoka T, Segi E, Tsuboi K, Sugimoto Y, Kobayashi T, Miyachi Y, Ichikawa A, Narumiya S (2002) The prostaglandin receptor EP4 suppresses colitis, mucosal damage and CD4 cell activation in the gut. J Clin Invest 109: 883–893 [DOI] [PMC free article] [PubMed] [Google Scholar]
- Kaiko GE, Ryu SH, Koues OI, Collins PL, Solnica‐Krezel L, Pearce EJ, Pearce EL, Oltz EM, Stappenbeck TS (2016) The colonic crypt protects stem cells from microbiota‐derived metabolites. Cell 165: 1708–1720 [DOI] [PMC free article] [PubMed] [Google Scholar]
- Kalinski P (2012) Regulation of immune responses by prostaglandin E2. J Immunol 188: 21–28 [DOI] [PMC free article] [PubMed] [Google Scholar]
- Konya V, Marsche G, Schuligoi R, Heinemann A (2013) E‐type prostanoid receptor 4 (EP4) in disease and therapy. Pharmacol Ther 138: 485–502 [DOI] [PMC free article] [PubMed] [Google Scholar]
- Krausova M, Korinek V (2014) Wnt signaling in adult intestinal stem cells and cancer. Cell Signal 26: 570–579 [DOI] [PubMed] [Google Scholar]
- Lacy ER (1988) Epithelial restitution in the gastrointestinal tract. J Clin Gastroenterol 10(Suppl. 1): S72–S77 [DOI] [PubMed] [Google Scholar]
- Leoni G, Alam A, Neumann PA, Lambeth JD, Cheng G, McCoy J, Hilgarth RS, Kundu K, Murthy N, Kusters D, Reutelingsperger C, Perretti M, Parkos CA, Neish AS, Nusrat A (2013) Annexin A1, formyl peptide receptor, and NOX1 orchestrate epithelial repair. J Clin Invest 123: 443–454 [DOI] [PMC free article] [PubMed] [Google Scholar]
- Libioulle C, Louis E, Hansoul S, Sandor C, Farnir F, Franchimont D, Vermeire S, Dewit O, de Vos M, Dixon A, Demarche B, Gut I, Heath S, Foglio M, Liang L, Laukens D, Mni M, Zelenika D, Van Gossum A, Rutgeerts P et al (2007) Novel Crohn disease locus identified by genome‐wide association maps to a gene desert on 5p13.1 and modulates expression of PTGER4. PLoS Genet 3: e58 [DOI] [PMC free article] [PubMed] [Google Scholar]
- Liu JZ, van Sommeren S, Huang HL, Ng SC, Alberts R, Takahashi A, Ripke S, Lee JC, Jostins L, Shah T, Abedian S, Cheon JH, Cho J, Daryani NE, Franke L, Fuyuno Y, Hart A, Juyal RC, Juyal G, Kim WH et al (2015) Association analyses identify 38 susceptibility loci for inflammatory bowel disease and highlight shared genetic risk across populations. Nat Genet 47: 979–986 [DOI] [PMC free article] [PubMed] [Google Scholar]
- Lustig B, Jerchow B, Sachs M, Weiler S, Pietsch T, Karsten U, van de Wetering M, Clevers H, Schlag PM, Birchmeier W, Behrens J (2002) Negative feedback loop of Wnt signaling through upregulation of conductin/Axin2 in colorectal and liver tumors. Mol Cell Biol 22: 1184–1193 [DOI] [PMC free article] [PubMed] [Google Scholar]
- Madison BB, Dunbar L, Qiao XT, Braunstein K, Braunstein E, Gumucio DL (2002) Cis elements of the villin gene control expression in restricted domains of the vertical (crypt) and horizontal (duodenum, cecum) axes of the intestine. J Biol Chem 277: 33275–33283 [DOI] [PubMed] [Google Scholar]
- Maher MT, Flozak AS, Stocker AM, Chenn A, Gottardi CJ (2009) Activity of the beta‐catenin phosphodestruction complex at cell‐cell contacts is enhanced by cadherin‐based adhesion. J Cell Biol 186: 219–228 [DOI] [PMC free article] [PubMed] [Google Scholar]
- Malvin NP, Seno H, Stappenbeck TS (2012) Colonic epithelial response to injury requires Myd88 signaling in myeloid cells. Mucosal Immunol 5: 194–206 [DOI] [PMC free article] [PubMed] [Google Scholar]
- Manieri NA, Drylewicz MR, Miyoshi H, Stappenbeck TS (2012) Igf2bp1 is required for full induction of Ptgs2 mRNA in colonic mesenchymal stem cells in mice. Gastroenterology 143: 110–121 [DOI] [PMC free article] [PubMed] [Google Scholar]
- Manieri NA, Mack MR, Himmelrich MD, Worthley DL, Hanson EM, Eckmann L, Wang TC, Stappenbeck TS (2015) Mucosally transplanted mesenchymal stem cells stimulate intestinal healing by promoting angiogenesis. J Clin Invest 125: 3606–3618 [DOI] [PMC free article] [PubMed] [Google Scholar]
- Matsuoka T, Narumiya S (2007) Prostaglandin receptor signaling in disease. ScientificWorldJournal 7: 1329–1347 [DOI] [PMC free article] [PubMed] [Google Scholar]
- Miyoshi H, Ajima R, Luo CT, Yamaguchi TP, Stappenbeck TS (2012) Wnt5a potentiates TGF‐beta signaling to promote colonic crypt regeneration after tissue injury. Science 338: 108–113 [DOI] [PMC free article] [PubMed] [Google Scholar]
- Miyoshi H, Stappenbeck TS (2013) In vitro expansion and genetic modification of gastrointestinal stem cells in spheroid culture. Nat Protoc 8: 2471–2482 [DOI] [PMC free article] [PubMed] [Google Scholar]
- Moon C, VanDussen KL, Miyoshi H, Stappenbeck TS (2014) Development of a primary mouse intestinal epithelial cell monolayer culture system to evaluate factors that modulate IgA transcytosis. Mucosal Immunol 7: 818–828 [DOI] [PMC free article] [PubMed] [Google Scholar]
- Moore R, Carlson S, Madara JL (1989) Rapid barrier restitution in an in vitro model of intestinal epithelial injury. Lab Invest 60: 237–244 [PubMed] [Google Scholar]
- Moore R, Madri J, Carlson S, Madara JL (1992) Collagens facilitate epithelial migration in restitution of native guinea pig intestinal epithelium. Gastroenterology 102: 119–130 [DOI] [PubMed] [Google Scholar]
- Morimoto K, Sugimoto Y, Katsuyama M, Oida H, Tsuboi K, Kishi K, Kinoshita Y, Negishi M, Chiba T, Narumiya S, Ichikawa A (1997) Cellular localization of mRNAs for prostaglandin E receptor subtypes in mouse gastrointestinal tract. Am J Physiol 272: G681–G687 [DOI] [PubMed] [Google Scholar]
- Morimoto M, Liu Z, Cheng HT, Winters N, Bader D, Kopan R (2010) Canonical Notch signaling in the developing lung is required for determination of arterial smooth muscle cells and selection of Clara versus ciliated cell fate. J Cell Sci 123: 213–224 [DOI] [PMC free article] [PubMed] [Google Scholar]
- Nakase H, Fujiyama Y, Oshitani N, Oga T, Nonomura K, Matsuoka T, Esaki Y, Murayama T, Teramukai S, Chiba T, Narumiya S (2010) Effect of EP4 agonist (ONO‐4819CD) for patients with mild to moderate ulcerative colitis refractory to 5‐aminosalicylates: a randomized phase II, placebo‐controlled trial. Inflamm Bowel Dis 16: 731–733 [DOI] [PubMed] [Google Scholar]
- Narisawa S, Hoylaerts MF, Doctor KS, Fukuda MN, Alpers DH, Millan JL (2007) A novel phosphatase upregulated in Akp3 knockout mice. Am J Physiol Gastrointest Liver Physiol 293: G1068–G1077 [DOI] [PubMed] [Google Scholar]
- Narumiya S, Sugimoto Y, Ushikubi F (1999) Prostanoid receptors: structures, properties, and functions. Physiol Rev 79: 1193–1226 [DOI] [PubMed] [Google Scholar]
- Nitta M, Hirata I, Toshina K, Murano M, Maemura K, Hamamoto N, Sasaki S, Yamauchi H, Katsu K (2002) Expression of the EP4 prostaglandin E2 receptor subtype with rat dextran sodium sulphate colitis: colitis suppression by a selective agonist, ONO‐AE1‐329. Scand J Immunol 56: 66–75 [DOI] [PubMed] [Google Scholar]
- Noah TK, Donahue B, Shroyer NF (2011) Intestinal development and differentiation. Exp Cell Res 317: 2702–2710 [DOI] [PMC free article] [PubMed] [Google Scholar]
- Nusrat A, Delp C, Madara JL (1992) Intestinal epithelial restitution. Characterization of a cell culture model and mapping of cytoskeletal elements in migrating cells. J Clin Invest 89: 1501–1511 [DOI] [PMC free article] [PubMed] [Google Scholar]
- Okamoto T, Uemoto S, Tabata Y (2012) Prevention of trinitrobenzene sulfonic acid‐induced experimental colitis by oral administration of a poly(lactic‐coglycolic acid) microsphere containing prostaglandin E‐2 receptor subtype 4 agonist. J Pharmacol Exp Ther 341: 340–349 [DOI] [PubMed] [Google Scholar]
- Patel KK, Miyoshi H, Beatty WL, Head RD, Malvin NP, Cadwell K, Guan JL, Saitoh T, Akira S, Seglen PO, Dinauer MC, Virgin HW, Stappenbeck TS (2013) Autophagy proteins control goblet cell function by potentiating reactive oxygen species production. EMBO J 32: 3130–3144 [DOI] [PMC free article] [PubMed] [Google Scholar]
- Podolsky DK (1999) Mucosal immunity and inflammation. V. Innate mechanisms of mucosal defense and repair: the best offense is a good defense. Am J Physiol 277: G495–G499 [DOI] [PubMed] [Google Scholar]
- Potten CS, Kellett M, Roberts SA, Rew DA, Wilson GD (1992) Measurement of in vivo proliferation in human colorectal mucosa using bromodeoxyuridine. Gut 33: 71–78 [DOI] [PMC free article] [PubMed] [Google Scholar]
- Proffitt KD, Madan B, Ke Z, Pendharkar V, Ding L, Lee MA, Hannoush RN, Virshup DM (2013) Pharmacological inhibition of the Wnt acyltransferase PORCN prevents growth of WNT‐driven mammary cancer. Cancer Res 73: 502–507 [DOI] [PubMed] [Google Scholar]
- Ricciotti E, FitzGerald GA (2011) Prostaglandins and inflammation. Arterioscler Thromb Vasc Biol 31: 986–1000 [DOI] [PMC free article] [PubMed] [Google Scholar]
- Sato T, Vries RG, Snippert HJ, van de Wetering M, Barker N, Stange DE, van Es JH, Abo A, Kujala P, Peters PJ, Clevers H (2009) Single Lgr5 stem cells build crypt‐villus structures in vitro without a mesenchymal niche. Nature 459: 262–265 [DOI] [PubMed] [Google Scholar]
- Schneider A, Guan Y, Zhang Y, Magnuson MA, Pettepher C, Loftin CD, Langenbach R, Breyer RM, Breyer MD (2004) Generation of a conditional allele of the mouse prostaglandin EP4 receptor. Genesis 40: 7–14 [DOI] [PubMed] [Google Scholar]
- Schneider CA, Rasband WS, Eliceiri KW (2012) NIH Image to ImageJ: 25 years of image analysis. Nat Methods 9: 671–675 [DOI] [PMC free article] [PubMed] [Google Scholar]
- Schror K, Darius H, Matzky R, Ohlendorf R (1981) The antiplatelet and cardiovascular actions of a new carbacyclin derivative (ZK 36 374)–equipotent to PGI2 in vitro . Naunyn Schmiedebergs Arch Pharmacol 316: 252–255 [DOI] [PubMed] [Google Scholar]
- Schwank G, Koo BK, Sasselli V, Dekkers JF, Heo I, Demircan T, Sasaki N, Boymans S, Cuppen E, van der Ent CK, Nieuwenhuis EE, Beekman JM, Clevers H (2013) Functional repair of CFTR by CRISPR/Cas9 in intestinal stem cell organoids of cystic fibrosis patients. Cell Stem Cell 13: 653–658 [DOI] [PubMed] [Google Scholar]
- Seno H, Miyoshi H, Brown SL, Geske MJ, Colonna M, Stappenbeck TS (2009) Efficient colonic mucosal wound repair requires Trem2 signaling. Proc Natl Acad Sci USA 106: 256–261 [DOI] [PMC free article] [PubMed] [Google Scholar]
- Shaw PA, Catchpole IR, Goddard CA, Colledge WH (2008) Comparison of protein transduction domains in mediating cell delivery of a secreted CRE protein. Biochemistry 47: 1157–1166 [DOI] [PubMed] [Google Scholar]
- Singer AJ, Clark RA (1999) Cutaneous wound healing. N Engl J Med 341: 738–746 [DOI] [PubMed] [Google Scholar]
- Sivasubramaniam SD, Finch CC, Rodriguez MJ, Mahy N, Billett EE (2003) A comparative study of the expression of monoamine oxidase‐A and ‐B mRNA and protein in non‐CNS human tissues. Cell Tissue Res 313: 291–300 [DOI] [PubMed] [Google Scholar]
- Stappenbeck TS, Miyoshi H (2009) The role of stromal stem cells in tissue regeneration and wound repair. Science 324: 1666–1669 [DOI] [PubMed] [Google Scholar]
- Sun L, Miyoshi H, Origanti S, Nice TJ, Barger AC, Manieri NA, Fogel LA, French AR, Piwnica‐Worms D, Piwnica‐Worms H, Virgin HW, Lenschow DJ, Stappenbeck TS (2015) Type I interferons link viral infection to enhanced epithelial turnover and repair. Cell Host Microbe 17: 85–97 [DOI] [PMC free article] [PubMed] [Google Scholar]
- Svanes K, Ito S, Takeuchi K, Silen W (1982) Restitution of the surface epithelium of the in vitro frog gastric mucosa after damage with hyperosmolar sodium chloride. Morphologic and physiologic characteristics. Gastroenterology 82: 1409–1426 [PubMed] [Google Scholar]
- Tuloup‐Minguez V, Hamai A, Greffard A, Nicolas V, Codogno P, Botti J (2013) Autophagy modulates cell migration and beta1 integrin membrane recycling. Cell Cycle 12: 3317–3328 [DOI] [PMC free article] [PubMed] [Google Scholar]
- Turner JR (2009) Intestinal mucosal barrier function in health and disease. Nat Rev Immunol 9: 799–809 [DOI] [PubMed] [Google Scholar]
- VanDussen KL, Marinshaw JM, Shaikh N, Miyoshi H, Moon C, Tarr PI, Ciorba MA, Stappenbeck TS (2015) Development of an enhanced human gastrointestinal epithelial culture system to facilitate patient‐based assays. Gut 64: 911–920 [DOI] [PMC free article] [PubMed] [Google Scholar]
- Veeman MT, Slusarski DC, Kaykas A, Louie SH, Moon RT (2003) Zebrafish prickle, a modulator of noncanonical Wnt/Fz signaling, regulates gastrulation movements. Curr Biol 13: 680–685 [DOI] [PubMed] [Google Scholar]
- Walker MR, Brown SL, Riehl TE, Stenson WF, Stappenbeck TS (2010) Growth factor regulation of prostaglandin‐endoperoxide synthase 2 (Ptgs2) expression in colonic mesenchymal stem cells. J Biol Chem 285: 5026–5039 [DOI] [PMC free article] [PubMed] [Google Scholar]
- Watanabe Y, Murata T, Amakawa M, Miyake Y, Handa T, Konishi K, Matsumura Y, Tanaka T, Takeuchi K (2015) KAG‐308, a newly‐identified EP4‐selective agonist shows efficacy for treating ulcerative colitis and can bring about lower risk of colorectal carcinogenesis by oral administration. Eur J Pharmacol 754: 191–201 [DOI] [PubMed] [Google Scholar]
- Whiting JL, Nygren PJ, Tunquist BJ, Langeberg LK, Seternes OM, Scott JD (2015) Protein kinase A opposes the phosphorylation‐dependent recruitment of glycogen synthase kinase 3 beta to A‐kinase anchoring protein 220. J Biol Chem 290: 19445–19457 [DOI] [PMC free article] [PubMed] [Google Scholar]
- Wilson AJ, Gibson PR (1997) Epithelial migration in the colon: filling in the gaps. Clin Sci 93: 97–108 [DOI] [PubMed] [Google Scholar]
- Wong MH, Hermiston ML, Syder AJ, Gordon JI (1996) Forced expression of the tumor suppressor adenomatosis polyposis coli protein induces disordered cell migration in the intestinal epithelium. Proc Natl Acad Sci USA 93: 9588–9593 [DOI] [PMC free article] [PubMed] [Google Scholar]
- Wong MH, Rubinfeld B, Gordon JI (1998) Effects of forced expression of an NH2‐terminal truncated beta‐Catenin on mouse intestinal epithelial homeostasis. J Cell Biol 141: 765–777 [DOI] [PMC free article] [PubMed] [Google Scholar]
Associated Data
This section collects any data citations, data availability statements, or supplementary materials included in this article.
Supplementary Materials
Appendix
Expanded View Figures PDF
Review Process File