
Fig. 4. 3D directional variance identifies layered collagen organization in articular cartilage.
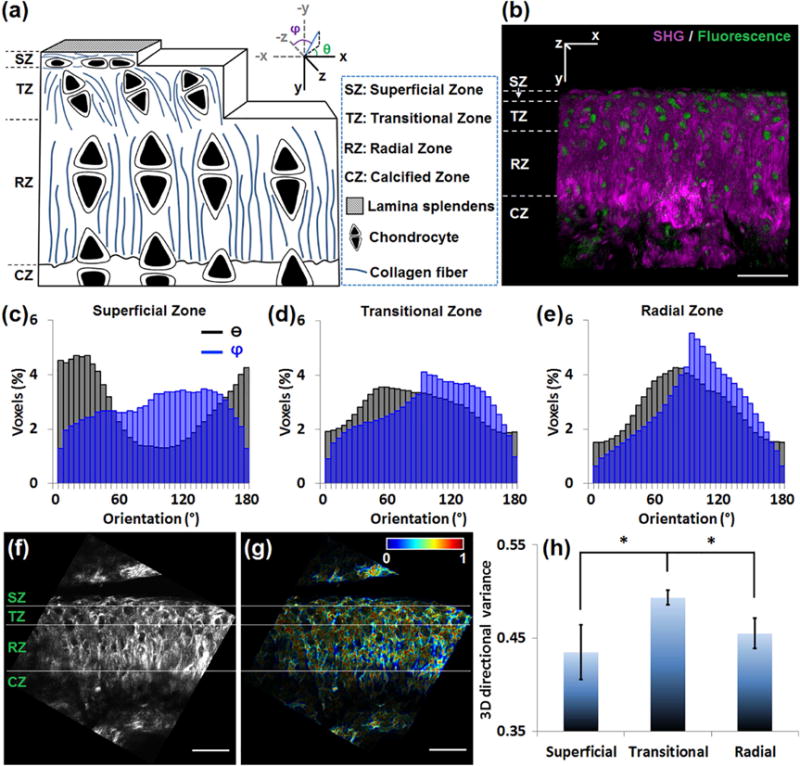
(a) Schematic of mouse articular cartilage showing the alignment of chondrocytes and collagen fibers in different histological zones. The picture does not reflect the actual sizes and spacing of the collagen fibers and the cells. In the coordinate system, the θ and φ angles of a fiber (blue line) are indicated. (b) 3D reconstruction of cartilage from 47 images recorded 1 μm apart. Simultaneous SHG (purple) and TPEF (green) images reveal the distinct localization of the collagen fibers and chondrocytes, respectively. (c–e) The θ (black) and φ (blue) distribution histograms of the (c) superficial, (d) transitional and (e) radial zone, reveal that the collagen fibers in the superficial zone are parallel to the surface (θ peaked near 0° or 180°), while those in the radial zone are perpendicular to the surface (θ peaked near 90°). (f) A representative SHG image of cartilage. (g) The corresponding voxel-wise 3D directional variance map, acquired based on a window size of 4.2×4.2×5.0 μm. (h) Mean and standard deviation of the 3D directional variance of the 3 different zones. *, p < 0.05. Scale bar, 50 μm.