

Abstract
Background
Atherosclerosis is a chronic inflammatory disorder whose development is inversely correlated with high‐density lipoprotein concentration. Current therapies involve pharmaceuticals that significantly elevate plasma high‐density lipoprotein cholesterol concentrations. Our studies were conducted to investigate the effects of low‐dose lipid‐free apolipoprotein A‐I (apoA‐I) on chronic inflammation. The aims of these studies were to determine how subcutaneously injected lipid‐free apoA‐I reduces accumulation of lipid and immune cells within the aortic root of hypercholesterolemic mice without sustained elevations in plasma high‐density lipoprotein cholesterol concentrations.
Methods and Results
Ldlr −/− and Ldlr −/− apoA‐I −/− mice were fed a Western diet for a total of 12 weeks. After 6 weeks, a subset of mice from each group received subcutaneous injections of 200 μg of lipid‐free human apoA‐I 3 times a week, while the other subset received 200 μg of albumin, as a control. Mice treated with lipid‐free apoA‐I showed a decrease in cholesterol deposition and immune cell retention in the aortic root compared with albumin‐treated mice, regardless of genotype. This reduction in atherosclerosis appeared to be directly related to a decrease in the number of CD131 expressing cells and the esterified cholesterol to total cholesterol content in several immune cell compartments. In addition, apoA‐I treatment altered microdomain cholesterol composition that shifted CD131, the common β subunit of the interleukin 3 receptor, from lipid raft to nonraft fractions of the plasma membrane.
Conclusions
ApoA‐I treatment reduced lipid and immune cell accumulation within the aortic root by systemically reducing microdomain cholesterol content in immune cells. These data suggest that lipid‐free apoA‐I mediates beneficial effects through attenuation of immune cell lipid raft cholesterol content, which affects numerous types of signal transduction pathways that rely on microdomain integrity for assembly and activation.
Keywords: apolipoprotein, apolipoprotein A‐I, cholesterol, chronic inflammation, high‐density lipoprotein, inflammation, lipid rafts, microdomains, signaling pathways
Subject Categories: Atherosclerosis, Lipids and Cholesterol, Cell Signalling/Signal Transduction, Basic Science Research, Vascular Biology
Introduction
Atherosclerosis is a chronic inflammatory disease characterized by accumulation of cholesterol within immune cells located in the artery wall. Several decades of observational studies have shown that the concentration of plasma high‐density lipoprotein (HDL) cholesterol (HDL‐C) is inversely associated with risk of myocardial infarction (MI),1 spurring the belief that pharmacotherapeutics aimed at raising plasma HDL concentrations could prevent or reduce the rate of MI.2 Recently, a study using Mendelian randomization analyses found that a genetic score derived from 14 variants known to change HDL‐C concentration showed no statistical association with MI.3 This study challenges the established view of plasma HDL‐C concentration as a biomarker, as it has been unconditionally accepted that raising plasma concentrations would directly translate into reductions in MI rates. Although this study emphasizes the potential constraints of using plasma HDL‐C concentration as a surrogate measure for risk of MI, its own limitations include suitable genetic variants, reliable genotype to disease estimates, and the possibility of pleiotropic effects of the genetic variants of interest. Combining this study with numerous reports documenting a general lack of efficacy of drugs that raise HDL‐C by inhibiting movement of cholesteryl ester (CE) out of HDL4 has fostered a number of new ideas to explain the protective properties of HDL. These concepts are based on the hypothesis that not all particles comprising plasma HDL are created equal, as well as whether total HDL‐C concentration in all cases reflects HDL particle number.5, 6, 7, 8 To address these concepts, the term HDL particle functionality has replaced HDL‐C concentration. With time, these ideas will be thoroughly tested and evaluated to determine whether they provide a more reliable biomarker for predicting the risk of MI9, 10, 11, 12, 13 than plasma HDL‐C concentrations alone.
HDL functionality follows seamlessly from recent studies showing that plasma HDL can stimulate cellular cholesterol removal and is referred to as cholesterol efflux capacity. These studies demonstrate that an individual's plasma HDL stimulates cholesterol removal from cells and that the rate of removal is a better predictive measure of MI risk than total HDL‐C concentration.14, 15, 16, 17 Since the majority (≈98%) of HDL particles in plasma are cholesterol enriched, it is not entirely clear which fraction(s) are responsible for driving cholesterol efflux capacity from artery wall cells. Most studies suggest that ABCA1 effluxes cholesterol most efficiently to lipid‐free or lipid‐poor apolipoprotein A‐I (apoA‐I); however, only ≈2% of plasma HDL can be considered lipid‐poor,18, 19 leaving a less than adequate explanation of how lipid‐poor apoA‐I is generated at the artery wall. It is possible that since plasma HDL particles are highly heterogeneous, they participate in dynamic processes and are remodeled at the artery wall.13, 20, 21, 22, 23 It is known that a variety of molecules carried on plasma HDL impact the development of atherosclerosis, and cholesterol is undoubtedly one, if not the most, important. Thus, when HDL particles are functional they remove excess arterial cholesterol that is eventually carried to the liver for excretion, completing the reverse cholesterol transport pathway. Reverse cholesterol transport depends in large part on the unique properties of apoA‐I, the main protein constituent of plasma HDL. ApoA‐I has been extensively studied and is known to possess structural properties that allow it to efficiently package large amounts of cholesterol24, 25 through its interaction with ABCA126, 27 at the cell surface.
A number of different approaches have been attempted in both animal models and in humans to employ apoA‐I as a therapeutic agent. These studies aim to reduce arterial cholesterol accumulation via infusion of homologous HDL28 or delipidated HDL,29 while the majority of studies have focused on infusing recombinant HDL, a stable complex of phospholipid and apoA‐I.30, 31, 32, 33, 34, 35, 36, 37, 38, 39 Overall, HDL‐directed therapeutics appear to be promising but have continued to rely on the concept that raising plasma HDL concentrations is consistent with efficacy, despite the complications that arise from infusion of large amounts of phospholipid reconstituted with apoA‐I.40
Previous studies from our laboratory have focused on the administration of lipid‐free human apoA‐I to reverse the autoimmune‐like phenotype that develops in diet‐fed low‐density lipoprotein (LDL) receptor, apoA‐I (Ldlr −/− apoA‐I −/−) double knockout mice.41, 42, 43, 44, 45 Under these conditions, plasma HDL‐C concentrations were not appreciably increased following injection, yet significant reductions in excess cellular cholesterol, as well as significant changes in regulatory T‐cell numbers, were documented.42, 44 In the current studies, we sought to explore the mechanistic basis explaining the apparent protective effects of subcutaneously administered low‐dose apoA‐I treatment without increasing HDL‐C concentrations.
Methods
Animals and Diet
Ldlr −/− and Ldlr −/− apoA‐I −/− male mice41 were put on a Western diet (42% calories from fat, 0.2% calories from cholesterol) (Envigo‐Teklad, #TD 88137) at 4 weeks of age. At the time of necropsy, the mice were fasted for 3 hours prior to being anesthetized with ketamine/xylazine. Euthanasia and blood collection were by cardiac puncture. Numbers of specific genotype used for each study/assay are indicated in each of the figure legends. All mice were bred and housed in microisolator cages in a pathogen‐free animal facility of the Medical College of Wisconsin (MCW). All experiments followed guidelines of the MCW Animal Care and Use Committee and the approval of the use of rodents was obtained from MCW according to criteria outlined in the Guide for the Care and Use of Laboratory Animals from the National Institutes of Health.
Purification of Human Plasma ApoA‐I, LDL, and Treatment Study Design
Human plasma apoA‐I was purified, as previously described.42, 44, 46 Human LDL for use in tissue culture experiments, a byproduct from the isolation of human apoA‐I, was dialyzed and then filtered through 45 μm Spin‐X centrifuge filters (Costar) and stored at 4°C. Groups of mice from each genotype received either 200 μg of lipid‐free apoA‐I or 200 μg of bovine serum albumin (BSA; Sigma, St. Louis, MO). Both were prepared at the same concentration and the filter sterilized. After feeding the mice a Western diet for 6 weeks, they were injected subcutaneously 3 times a week for 6 weeks with either BSA or apoA‐I while still consuming the Western diet.
Plasma Lipoprotein Isolation, Characterization, and ELISA
Blood was collected in tubes containing EDTA then centrifuged at 2000 g for 10 minutes at 4°C. Total plasma cholesterol (TPC) and HDL‐C were determined using an enzymatic assay kit (Wako Diagnostics Cholesterol E) after lipoprotein class separation on a Superose 6 10/300GL column (GE Healthcare), as previously described.47 Human apoA‐I in mouse plasma was determined using an Abcam human ApoA‐I ELISA kit.
Histology and Immunofluorescence Microscopy
At the time of sacrifice, a 21G butterfly needle was inserted into the left ventricle, the atrium was clipped, the heart and aorta were perfused with saline for 5 minutes, and then the heart was removed and cleaned of fat and adventitia. Mouse heart and aorta were embedded in optimal cutting temperature medium and then sectioned for staining and immunohistochemistry. For quantification of total and percent lesion area, optimal cutting temperature–embedded aortas were cut into sequential 6‐μm sections using a Leica cryostat at −50°C. Tissue sections were stained in 0.5% Oil Red O (ORO) dissolved in propylene glycol overnight, then counterstained with hemotoxylin. Masson's trichrome stain was used to assess the connective tissue content of the aortic root. Quantification of staining was performed after sections were digitized using a Nikon microscope and Image‐Pro Plus 6.2 software and quantified using NIS Elements software (Nikon Instruments Inc). Eight to 10 sections from intervals of 30 μm were used for morphological analyses and averaged to obtain a value for each animal. Results are expressed as both the percentage of lesion area and absolute lesion area, as previously described.47
For immunofluorescence microscopy, purified rat anti‐mouse CD68 (AbD FA‐11‐Serotec) at a 1:100 dilution was used as the primary antibody. Slides were incubated for 1 hour in PBS containing 2% fetal calf serum, washed with PBS, and then incubated with a 1:300 dilution of Cy3‐conjugated goat anti‐rat IgG antibody (Rockland) for 30 minutes at room temperature. After briefly washing the slides with PBS, they were stained with DAPI to visualize nuclei and then mounted with Fluoro‐Gel (Electron Microscopy Sciences). Immunofluorescence was visualized using a Nikon Eclipse TE2000‐S microscope and the total and percent of CD68 staining was quantified using Nikon Elements Software, as previously described.47
Isolation of Mouse Immune Cells, PBMC, and Flow Cytometry
Whole blood (≈800 μL) was collected via cardiac puncture using a heparinized syringe and placed into a 15‐mL tube containing 5 μL of 100 mmol/L EDTA and then mixed to prevent coagulation. Added to this tube was 10 mL of prechilled ACK (Lonza) buffer mixed thoroughly by inversion and allowed to sit on ice for 5 minutes. The sample was spun for 5 minutes at 2000 rpm in a swinging bucket rotor at 10°C. Following the spin, the entire supernatant was removed, the peripheral blood mononuclear cells (PBMCs) resuspended in 1 mL of PBS pH 7.4 without Ca2+ and Mg2+, transferred to a 1.5‐mL tube, and then spun at 2000 rpm for 5 minutes at 4°C. The pellet was washed 1 or 2 more times with PBS to remove residual platelets and the PBMC was resuspended and then counted before FACS.
Mouse spleen and bone marrow cells were passed through a 40‐μm cell strainer, washed with ice‐cold PBS, and then lysed once with cold ACK lysis buffer as described for the PBMCs. Aortas were explanted after perfusion with ice‐fold PBS, cleaned and digested with DNase I, collagenase type I, collagenase type XI, and hyaluronidase type I, as previously described.48 All staining protocols were carried out for 30 minutes on ice. Antibodies were purchased from eBioscience (CD115), Biolegend (lin [lineage]), and BD Bioscience (TCRb, CD11b, CD131, GR‐1, Ly6C, Ly6G, CD45, CD11c, F4/80, CD117 [c‐kit], Ly‐6A/E [sca‐1]). Anti‐Mouse Ig, k/Negative and Positive control compensation beads were purchased from BD Bioscience. Samples were stained with LIVE/DEAD fixable dye (Life Technologies). Samples were acquired on an LSRII (BD Bioscience) and data were analyzed using FlowJo X 10.0.7r2 software (FlowJo, LLC, Ashland, OR).
Human PBMC Samples
Peripheral blood cells and plasma were isolated from the blood of 56 healthy donors who were part of the Take Off Pounds Sensibly (TOPS Club, Inc) program. All procedures were approved by the MCW's institutional review board and conform to the relevant ethical guidelines for human research. Each participant provided informed consent. Criteria for participants recruited for membership in TOPS Club, Inc, has been previously described.49, 50 Families with at least 2 obese siblings (body mass index ≥30 kg/m2) and at least 1 nonobese sibling and/or parent (body mass index ≤27 kg/m2) from Wisconsin, Illinois, Kentucky, and West Virginia were invited to participate in the study. Participation was voluntary. Patients with a history of type 1 diabetes mellitus, cancer, renal or hepatic disease, active coronary artery disease, substance abuse, corticosteroids, thyroid medications above the replacement dose (either for goiter or thyroid cancer), or history of weight loss of more than 10% of body weight in the preceding 12 months were excluded from the study. All procedures were approved by the MCW's institutional review board and conform to the relevant ethical guidelines for human research. Informed consent was provided by each participant (both for questionnaires and the actual study). Blood was drawn into Vacutainer EDTA tubes (BD Bioscience), spun, and the top plasma layer collected and frozen at −80°C until analyzed. Thawed plasma samples were assayed for total cholesterol (TC). LDL and HDL cholesterol was determined following precipitation with MgCl2 51 using cholesterol kits from Roche‐Boehringer (Indianapolis, IN). PBMCs were isolated from plasma‐depleted blood with Ficoll‐Paque PLUS (GE Healthcare). PBMCs were washed to remove platelets then stored in FBS medium containing 10% dimethyl sulfoxide.
Ex Vivo Unloading and Loading Assays
Whole blood (≈800 μL) was collected via cardiac puncture using a heparinized syringe and placed into a 15‐mL tube containing 5 μL of 100 mmol/L EDTA, then mixed to prevent coagulation. Added to this tube was 10 mL of prechilled ACK (Lonza) buffer mixed thoroughly by inversion and allowed to sit on ice for 5 minutes. The sample was spun for 5 minutes at 2000 g in a swinging bucket rotor at 10°C. Following the spin, the entire supernatant was removed, the PBMCs resuspended in 1 mL of PBS pH 7.4, transferred to a 1.5‐mL tube, and then spun at 2000 g for 5 minutes at 4°C. The cell pellet was washed 1 or 2 more times with PBS to remove residual platelets and the PBMCs were resuspended and then counted before incubation of 3×10⁵ cells with the indicated amount of LDL or HDL at 37°C, 5% CO2, in a 1 mL final volume of serum‐free RPMI medium. Following incubation for 30 minutes to 6 hours, cells were washed extensively with PBS to remove residual lipoproteins by centrifugation at 2000 g for 5 minutes then stored at −80°C.
Tissue Culture
T75 flasks of J774 cells were cultured in RPMI with 10% FBS until confluent. Cells were lifted using Versene (Lonza), then seeded into 12‐well plates at a density of 7×10⁵ cells per well. The next day, confluent wells were washed 2 or 3 times with PBS and then human LDL protein in RPMI was added at a concentration of 20 to 150 μg/mL per well. The cells were incubated for 2 to 3 days with human LDL at 37°C, 5% CO2, washed 3 times with serum‐free RPMI, and then incubated with a final protein concentration with 40 μg/mL of lipid‐free human apoA‐I or BSA overnight. The next day, the medium was removed and the cells were washed with PBS then lifted with Versene. Cell pellets were spun down, washed, and then resuspended and counted. Lowry assay52 was conducted on extract aliquots for protein concentration and the remaining cells were used directly for lipid raft isolations or used for preparation of protein extracts used in Western analyses.
Detergent‐Free Lipid Raft Isolation
Subcellular fractions were prepared from freshly isolated J774 cell pellets pooled from 15‐ to 100‐mm dishes for each treatment. The cells were washed prior to harvest with 10 mmol/L Tris pH 8, then released from the plate using Versene (Lonza). The combined cell pellets for each treatment group were taken up in 900 μL of detergent‐free lysis buffer containing protease inhibitors (10 mmol/L Tris, pH 8, 1 mmol/L MgCl2, 1 mmol/L PMSF, 1 mmol/L Na3VO4, 5 mmol/L NaF) and passed through a 23G syringe needle for at least 20 to 40 times. Cell lysate was centrifuged for 5 minutes at 1000 g at 4°C to obtain the postnuclear supernatant (PNS). The postnuclear supernatant was adjusted to 1.6 mL with lysis buffer, of which 0.1 mL was saved and the remaining 1.5 mL mixed with 3.3 mL of 65% sucrose dissolved in 10 mmol/L Tris, pH8, to obtain a 45% sucrose solution (density=1202.5 kg/m3) and then transferred to a centrifuge tube. On top of the 45% sucrose solution, 4.8 mL of a 35% sucrose solution (d=1390.2 kg/m3) was carefully overlaid, followed by 2.4 mL of a 5% sucrose solution (d=1340.3 kg/m3). The samples were spun overnight at 40 000 rpm in a Beckman SW40 rotor maintained at 15°C. The next day, each tube was fractionated into 8 or 9 sequential fractions using an autosampler pumping FluorInert (Sigma) at a constant rate. The fractions were immediately frozen and stored at −80°C until assayed.
Immunoblotting
Western blot was performed following total protein isolation following extraction using RIPA buffer (Cell Signaling Technologies) as described47 or using detergent‐free lipid raft fractions. All blots were run after separation on 12% SDS‐PAGE. Protein aliquots were diluted with 4X LDS buffer (Novex) to which DTT had been added to achieve a final concentration of 100 mmol/L. Samples were heated to 70°C for 20 minutes. Transfer to PVDF membrane (Perkin‐Elmer) was accomplished after treatment with Tris‐glycine pH8.3 buffer using a semi‐dry blot (BioRad) apparatus running for 30 minutes at 10 V. Membranes were blocked with 5% nonfat dry milk in 10 mmol/L Tris‐glycine, pH7.4 buffer, and processed. The membrane was incubated with the primary antibodies, flotillin (BD Biosciences), tubulin (Abcam), and interleukin (IL)‐3Rb (Santa Curz), overnight at 4°C. Blots were washed and then incubated with an HRP‐conjugated anti‐mouse or rabbit IgG secondary antibody (GE Healthcare) at a 1:5000 dilution for 1 hour at room temperature. Blots were washed again and then incubated with Supersignal West Pico chemiluminescence substrate (Pierce). Blots were exposed to x‐ray film (MidSci) and intensities quantified using Image J software.
Lipid Composition
TC and free cholesterol (FC) determinations were performed on cell extracts or fractions from lipid raft isolations, which had been spiked with the internal standard, cholesterol‐3,4‐13C2 (Sigma‐Aldrich), and subjected to lipid extraction, as previously described.44 To measure FC, an aliquot was removed, evaporated under argon, dissolved in hexane, and then injected on a Thermo Scientific TSQ 8000 tandem mass spectrometer interfaced to a Trace 1310 gas chromatograph (GC/MS/MS) equipped with a Triplus RSH autoinjector. The following parameters were employed in the positive ion mode: scan time 0.1 second, collision energy 10 V, emission current 25 μA, electron energy 42 eV, source and transfer line temperature 280°C, and flow rate=2.5E‐8 m3/s. Analysis was carried out using a TG‐SQC column (15 m×0.25 mm I.D.) with a 0.25‐μm film thickness. For quantifying TC, the remaining sample was dried under a stream of nitrogen, redissolved in 1 mL of ethanol, mixed with 100 μL of 50% (w/w) aqueous potassium hydroxide, and then saponified for 1 hour at 65°C. After extraction, TC was measured and CE calculated as the difference between FC and TC. Phospholipid content was determined on raft fractions, as previously described.27, 53
Statistical Analysis
GraphPad Prism version 5 was used for statistical analysis and the data are reported as mean±SD. Differences between groups were evaluated by independent t tests and by ANOVA with Tukey's post hoc test.
Results
Previous studies from our laboratory have focused on elucidating mechanism(s) responsible for the atheroprotective properties of HDL apoA‐I. In those studies, we first used subcutaneous (SC) injections of 500 μg of lipid‐free human apoA‐I to treat diet‐fed Ldlr −/− apoA‐I −/− mice and reverse the symptoms associated with an autoimmune phenotype developing in mice fed a Western diet.41, 43 In these studies, injections of BSA, an irrelevant protein, at the same concentration did not reduce or suppress cholesterol loading and subsequent autoimmune phenotype.44 Despite the reversal of cholesterol deposition in the skin and skin‐draining lymph nodes, diet‐fed Ldlr −/− apoA‐I −/− mouse plasma showed only a small transient increase in HDL or apoA‐I concentration ≈3 to 4 hours following injection.44 Taken together, these observations suggested that apoA‐I delivered in small, consistent amounts would prevent and/or regress lipid deposition in peripheral tissues without sustained elevation of plasma HDL or apoA‐I concentrations. This conclusion, however, appears to be inconsistent with current perceptions regarding plasma HDL as a therapeutic agent, since it is believed that efficacy towards reducing atherosclerosis is best achieved when HDL‐C concentrations are elevated.
Study Design and SC Administration of Lipid‐Free ApoA‐I
The design of the current study is illustrated in Figure 1A. Groups of age‐matched male Ldlr −/− and Ldlr −/− apoA‐I −/− mice were fed a Western diet for a total of 12 weeks. Starting at 6 weeks of the diet, a group (n=10) from each genotype began receiving injections of 200 μg lipid‐free human apoA‐I (≈4 mg/kg) 3 times a week for the remainder of the 12 weeks of study. Another group representing the control group underwent the same treatment regimen but received 200 μg of BSA instead of apoA‐I. In a previous study, we found that ≈10% of the lipid‐free apoA‐I that was subcutaneously injected reached the plasma compartment, peaking ≈3 to 4 hours post‐injection and resided on plasma HDL particles.44 We again examined the time course appearance of human apoA‐I in plasma following SC injection of lipid‐free apoA‐I in diet‐fed Ldlr −/− mice, as shown in Figure S1. These data indicate that ≈6% to 8% of the injected human apoA‐I appears and peaks in plasma by 3.5 hours post‐SC injection. We next examined the effect of this small amount of lipid‐free human apoA‐I on TPC and HDL‐C concentrations. Figure 1B and 1C shows the TPC and HDL‐C concentrations for each genotype and treatment group, respectively, and suggests that neither the TPC or the HDL‐C concentrations were significantly elevated by the apoA‐I or BSA treatments over the course of the study, as previously reported.44 We also show in Figure 1D that the ratio of esterified cholesterol (EC) to TC in plasma was similar between groups, suggesting that serum LCAT activity and/or the rate of FC to EC conversion was not affected by the apoA‐I or BSA treatment.24 It should be noted that the plasma cholesterol concentrations in diet‐fed Ldlr −/− apoA‐I −/− mice averages ≈600 mg/dL, nearly half as that seen for Ldlr −/− mice (1200 mg/dL). Interestingly, this difference is largely due to differences in very LDL and LDL cholesterol.41 The mechanism(s) behind this genotype‐specific response to Western diet consumption remains unclear but appears to involve aspects of the autoimmune‐like phenotype associated with the profound disruption in cholesterol homeostasis.41, 43
Figure 1.
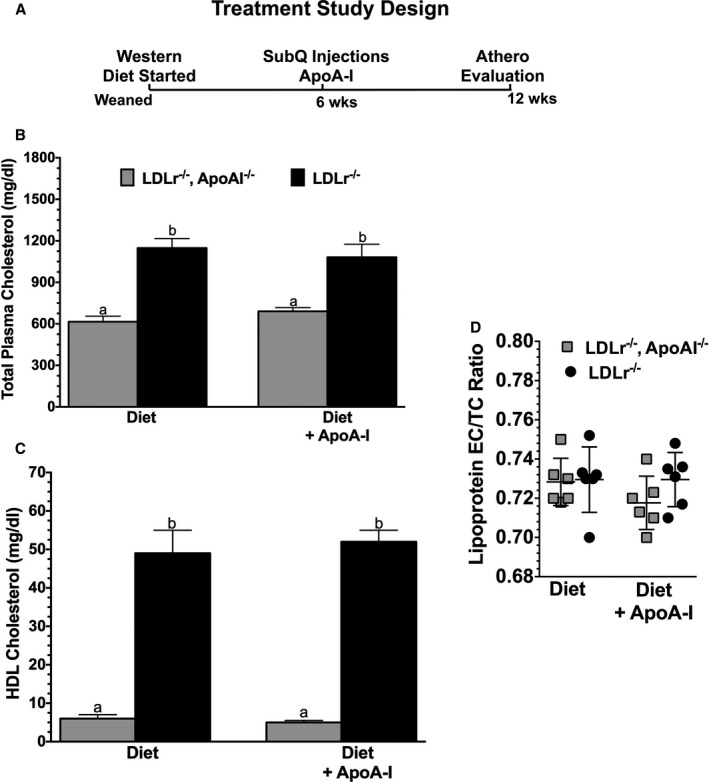
Study design and plasma lipoprotein cholesterol. A, The experimental design used throughout the course of these studies. At the time of weaning, male Ldlr −/− and Ldlr −/− apoA‐I −/− mice began a Western diet (Envigo‐Teklad) containing 42% of calories as fat and 0.2% cholesterol. After 6 weeks, the mice were divided into two groups. One group received subcutaneous (SubQ) injections of 200 μg of lipid‐free apolipoprotein A‐I (apoA‐I) 3 times a week, while the other group received 200 μg of bovine serum albumin 3 times a week. Both groups were maintained on the Western diet during the treatment phase of the study. After a total of 12 weeks on the diet, the mice were evaluated. B, The total plasma cholesterol concentration and (C) high‐density lipoprotein (HDL) cholesterol concentration in each of the groups. D, The ratio of ester cholesterol (EC) to total cholesterol (TC) in plasma lipoproteins. Data shown are the mean±SD of 5 to 10 male mice for each genotype condition. Unlike letters indicate statistical significance at P<0.02.
ApoA‐I Treatment Reduces Aortic Lipid and Immune Cell Deposition
We next examined the effect of lipid‐free apoA‐I treatment on the extent of atherosclerosis in both genotypes of mice. Figure 2A and 2C show representative slides of the atherosclerotic burden assessed after staining aortic root sections with ORO shown in Figure 2A and CD68 immunofluorescence shown in Figure 2C, respectively. In Figure 2B and 2D, the results of ORO quantification and CD68 staining are expressed as total lesion area, respectively. Figure 2A shows representative aortic root sections for both genotypes, ±apoA‐I treatment (starting at top left to right: BSA‐treated Ldlr −/− apoA‐I −/− and Ldlr −/− mice, then bottom left to right: apoA‐I–treated Ldlr −/− apoA‐I −/− and Ldlr −/− mice). Quantitation of neutral lipid staining was expressed as total ORO area in μm2, as shown in Figure 2B. These data indicate that 6 weeks of lipid‐free apoA‐I treatment during Western diet consumption reduced neutral lipid content by ≈65% in Ldlr −/− apoA‐I −/− mice and ≈50% in Ldlr −/− mice.
Figure 2.
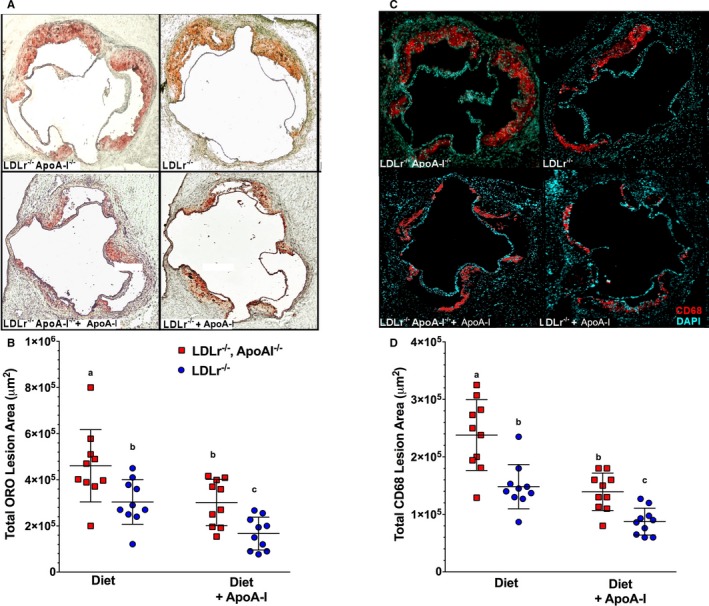
Atherosclerosis was reduced by administration of subcutaneous lipid‐free apolipoprotein A‐I (apoA‐I). A, Representative aortic root sections stained with Oil Red O (ORO) from Ldlr −/− and Ldlr −/− apoA‐I −/− mice fed a Western diet for 12 weeks from each treatment group, while (B) shows the quantification of the atherosclerotic lesion area as a percent of the total aortic area for the ORO‐stained aortic roots. Data show the mean±SD of 10 male mice per group. C, Representative aortic root sections stained with fluorescently labeled antibodies to CD68 from Ldlr −/− and Ldlr −/− apoA‐I −/− mice fed a Western diet for 12 weeks from each treatment group, while (D) shows quantification of the CD68+ staining over background as a percent of the total lesion area. Unlike letters indicate statistical significance at P<0.05. The fluorescence background threshold was set to the intensity of sections receiving the fluorescent‐tagged secondary antibody minus CD68 primary antibody.
Staining the aortic root for CD68 is commonly used as a marker for macrophage infiltration. Figure 2C shows representative CD68+‐stained sections for both genotypes, ±apoA‐I treatment (starting at top left to right: BSA‐treated Ldlr −/− apoA‐I −/− and Ldlr −/− mice, then bottom left to right apoA‐I–treated, Ldlr −/− apoA‐I −/− and Ldlr −/− mice). Quantitation of CD68+ immunofluorescence staining was expressed as total CD68+ area in μm2, as shown in Figure 2D. These data indicate that 6 weeks of lipid‐free apoA‐I treatment during Western diet consumption reduced CD68+ infiltration by ≈50% in Ldlr −/− apoA‐I −/− mice and ≈35% in Ldlr −/− mice. Thus, it appeared that the effects of apoA‐I treatment on neutral lipid staining of aortic roots sections appeared to parallel the effects of apoA‐I treatment on aortic CD68+ deposition.
ApoA‐I Treatment Reduces CD131 Expressing PBMCs Correlating With Reduction in EC/TC Ratio
Atherosclerosis data suggest that treatment with lipid‐free apoA‐I reduces both lipid and immune cell infiltrates into mouse aorta, so we next investigated whether these treatments might also reduce the numbers or types of circulating immune cells in blood. To do this, we isolated PBMCs from Ldlr −/− mice that had been part of the same study design as illustrated in Figure 1A. In these studies, PBMCs were purified then stained using fluorescent antibodies to surface receptor markers and then analyzed by FACS. Figure 3A shows representative flow cytometry plots of forward and side scatter for live PBMCs isolated from Ldlr −/− mice fed chow, a Western diet, or Western diet±apoA‐I treatment, respectively. From each of these plots of forward and side scatter, CD45+ cells were gated, as shown in Figure 3C. Cells positive for CD45+ were then quantified, as shown in Figure 3D, for both their percentage and their total number of CD45+ PBMCs in each treatment group. As noted in previous reports, cholesterol‐containing diets tend to expand the number of immune cells in peripheral blood of hypercholesterolic mice54, 55, 56, 57, 58 while increased expression of apoA‐I reduces their expansion.31, 59 In the present study, CD45+ PBMCs showed only a trend towards a change in their total numbers in response to apoA‐I treatments, while no difference in the percentages among groups was observed. On the other hand, the effect of apoA‐I treatment was found to be highly significant with respect to the expression of CD131 surface receptor. Figure 3E and 3F shows representative histograms of CD45+ PBMCs expressing CD131+ in each of the 3 treatment groups along with their quantitation, respectively. CD131 is known as the common β subunit of the IL‐3 receptor, which binds and binds the ligands, IL‐3, granulocyte‐macrophage colony‐stimulating factor (GM‐CSF), and IL‐5 and has been shown to be associated with stimulation of stem cell expansion in apoE −/− mice.60 Here we see a significant increase in both the percentage and number of PBMCs expressing CD45+ CD131+ in response to the Western diet and a decrease in response to apoA‐I treatment in Ldlr −/− mice. Reductions in the number of CD131 expressing cells in apoA‐I–treated Ldlr −/− apoA‐I −/− mice were similar to that seen in Ldlr −/− mice (data not shown). Interestingly, this reduction in CD131 expressing PBMCs was mirrored by changes in the ratio of EC to TC measured in PBMCs from the same mice as used for FACS analyses, as shown in Figure 3B. These data suggest that Western diet consumption elevates PBMC EC/TC content, likely a signal of excess cellular cholesterol and, thus, foam cell formation, while the supplemented apoA‐I stimulates the removal of cholesterol via efflux and the formation of nascent HDL particles.27, 44
Figure 3.
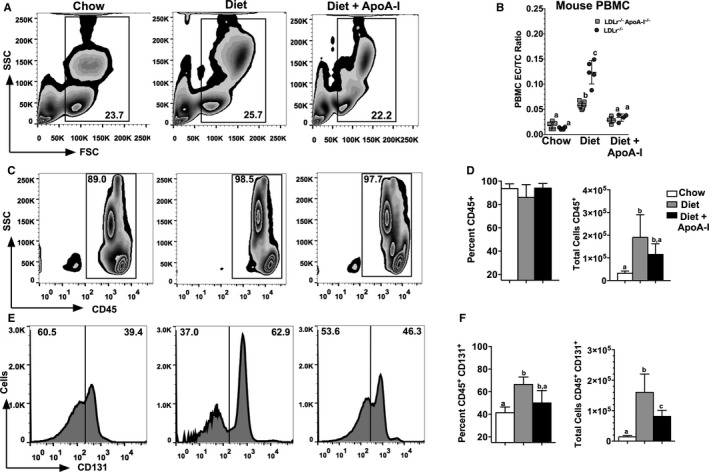
CD131 expressing cells in peripheral blood decrease in response to apolipoprotein A‐I (apoA‐I) treatment. Schematic diagrams showing representative flow cytometry plots of peripheral blood mononuclear cells (PBMCs) isolated from 3 different treatment groups of Ldlr −/− mice fed either chow, Western diet, or Western diet+subcutaneously administered apoA‐I. A, Forward and side scatter of total live PBMCs from Ldlr −/− mice. B, The PBMC ester cholesterol to total cholesterol (EC/TC) ratio for individual mice of each of the indicated genotypes for each of the 3 treatment groups. C, Gating of side scatter versus for CD45+ cells from the corresponding gate above for Ldlr −/− mice fed either chow, Western diet, or Western diet±subcutaneously administered apoA‐I. D, The percentage of CD45+ cells of the total cells (left) and the total number of CD45+ cells (right) for Ldlr −/− mice fed either chow, Western diet, or Western diet±subcutaneously administered apoA‐I. E, Histograms for cells double positive for CD45+ and CD131+. F, The percent of cells expressing both CD45+ and CD131+ and the total number of CD45+, CD131+ expressing cells from Ldlr −/− mice fed either chow, Western diet, or Western diet±subcutaneously administered apoA‐I. Results shown in (B) are the average of 5 to 8 individual PBMC samples for each genotype and treatment group. The results displayed in (D and F) are the mean±SD for 10 to 15 mice per group. Unlike letters indicate statistical significance at P<0.05.
To determine whether the changes seen in the EC/TC ratio in mouse PBMCs translated to human blood cells we obtained 56 PBMC samples from human participants in the TOPS Club, Inc, study. Cells were subjected to mass spectrometry and each individual's PBMC EC/TC ratio was plotted versus their HDL‐C concentration, as shown in Figure S2. Interestingly, a significant inverse correlation was observed (P<0.009) between PBMC EC/TC ratio and plasma HDL‐C concentration, suggesting that the PBMC EC/TC ratio is significantly influenced by the plasma HDL concentration and may be linked to determining the functionality of the HDL particles in promoting efflux from circulating immune cells.
To identify PBMC subsets expressing CD131 that were affected by apoA‐I treatment, PBMCs from diet‐fed Ldlr −/− mice±apoA‐I treatment were stained for monocyte and neutrophil surface markers and analyzed by FACS. Figure 4A shows representative plots for CD115+ Ly6C+ expressing cells, which are thought to represent markers of inflammatory monocytes in circulation. Figure 4C shows representative plots for CD11b+ Ly6G+ expressing neutrophils. All plots shown were first gated for live CD45+ cells for each of the respective treatments indicated. To determine the level of CD131 expression, histograms were created from the CD115+ Ly6C+ monocytes population for mice fed diet±apoA‐I treatment as well as for the CD11b+ Ly6G+ neutrophil population. Representative histograms show that after mice were treated with apoA‐I, a reduction in the number of CD131 cells were observed. Quantification of data is shown in Figure 4B and 4D for monocytes and neutrophils, respectively. Reductions in the number of CD131 expressing cells in apoA‐I–treated Ldlr −/− apoA‐I −/− mice were similar to that seen in Ldlr −/− mice (data not shown). Overall, these data show both PBMC subsets display a significant reduction in numbers of CD131+ expressing cells following apoA‐I treatment of Ldlr −/− mice fed a Western diet.
Figure 4.
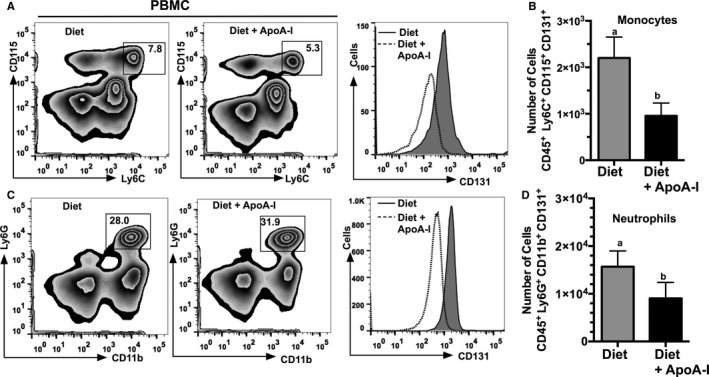
Numbers of CD131 expressing monocytes and neutrophils are reduced in response to apolipoprotein A‐I (apoA‐I) treatment. Schematic diagrams showing representative flow cytometry plots and histogram of peripheral blood mononuclear cells (PBMCs) isolated from Ldlr −/− mice fed either a Western diet or Western diet+subcutaneously administered apoA‐I. A, Gating for CD45+ cells that express CD115 and Ly6C and a histogram of CD131 expressing cells. B, The total number of inflammatory monocytes, eg, cells positive for CD45 CD131 Ly6C and CD115. C, Gating for CD45+ cells expressing Ly6G and CD11b and a histogram of CD131 expressing cells. D, The total number of neutrophils, eg, cells positive for CD45 CD131 Ly6G and CD11b+. A and C, Representative plots from Ldlr −/− mice fed either Western diet or Western diet+subcutaneously administered apoA‐I. Results shown in (B and D) are expressed as the mean±SD for 10 to 15 mice per group. Unlike letters indicate statistical significance at P<0.05.
ApoA‐I Reduces EC/TC Ratio and CD131 Expressing Cells in Spleen, Bone Marrow, and Artery
We next examined the EC/TC ratio from single‐cell suspensions isolated from mouse spleen, bone marrow, and artery and then compared them with the number of CD131 expressing cells in these compartments. Figure 5A and 5D show the EC/TC ratio for cells isolated from spleen and bone marrow cells, respectively, from Ldlr −/− and Ldlr −/− apoA‐I −/− mice fed either chow, Western diet, or Western diet±apoA‐I. In addition to these immune cell compartments, cells isolated from arterial explants, shown in Figure S3, also showed a decrease in their EC/TC ratio. As seen with mouse PBMCs, apoA‐I treatment significantly reduced the EC/TC ratio in these immune cell compartments and this change correlates with a reduction in the number of cells expressing CD131+, as shown by the histogram and its quantification in Figure 5B and 5C for Ldlr −/− mice treated with apoA‐I, respectively. These same analyses were performed on single‐cell suspensions from bone marrow (shown in Figure 5E and 5F) in which a similar reduction in cell numbers in mice treated with apoA‐I was observed. Results obtained from Ldlr −/− apoA‐I −/− mice were similar to those shown for Ldlr −/− (data not shown). Overall, these data suggest that small continuous doses of lipid‐free apoA‐I have a dramatic impact on all immune cell compartments stimulating a reduction in cellular EC content increased by the hypercholesterolemia but have little to no effect on bulk plasma cholesterol concentrations.
Figure 5.
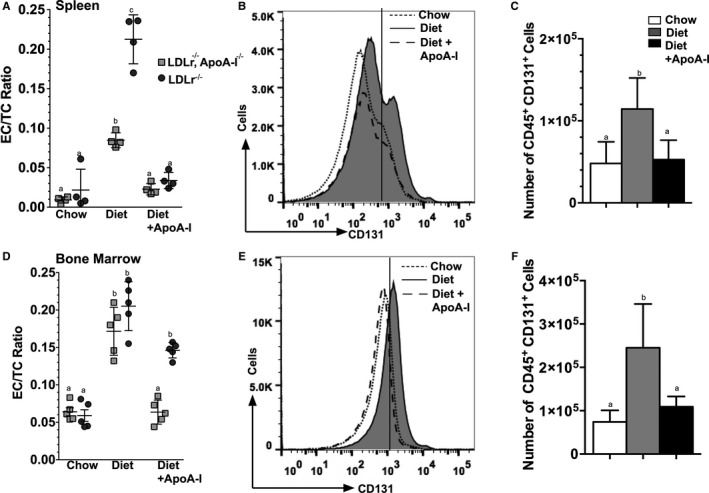
Apolipoprotein A‐I (apoA‐I) treatment reduces CD131 expressing cells in mouse spleen and bone marrow of Ldlr −/− mice. A and D, ester cholesterol to total cholesterol (EC/TC) ratios for single‐cell suspensions prepared from Ldlr −/− and Ldlr −/− apoA‐I −/− mouse spleen and bone marrow, respectively, which were assayed for free and total cholesterol by mass spectrometry. In both genotypes and in both immune cell compartments, treatment with apoA‐I reduced the EC/TC ratio. Aliquots of cells from the same mice were analyzed for surface markers using FACS. B, Representative histogram for spleen cells expressing CD131 from Ldlr −/− mice fed chow, Western diet, or Western diet±apoA‐I, while (C) shows the quantification of the total number of CD131+ spleen cells from each of the 3 treatment groups. E, Representative histogram for bone marrow cells expressing CD131+ from Ldlr −/− mice fed chow, Western diet, or Western diet±apoA‐I, while (F) shows the quantification of the total number of CD131+ bone marrow cells from each of the 3 treatment groups. Results are expressed as the mean±SD for 4 to 15 mice per group. Unlike letters indicate statistical significant at P<0.05.
Based on the effect of apoA‐I on the number of CD131 expressing cells in mouse bone marrow, we next determined whether apoA‐I treatment affected hematopoietic stem and multipotential progenitor cells (HSPCs) expressing CD131. Figure 6 shows bone marrow analyzed by FACS gated for live lineage negative cells that were sca‐1+ c‐kit+ from diet and diet+apoA‐I–treated Ldlr −/− mice, respectively. A significant reduction in the percent of LSK cells is seen in apoA‐I–treated mouse bone marrow while a histogram further shows that the number of CD131 expressing cells were also reduced following apoA‐I treatment. These data agree with a previous publication showing that apoA‐I reduced the number of LSK cells by reducing their proliferation in diet‐fed Ldlr −/− apoA‐I −/− mice treated with apoA‐I.46
Figure 6.
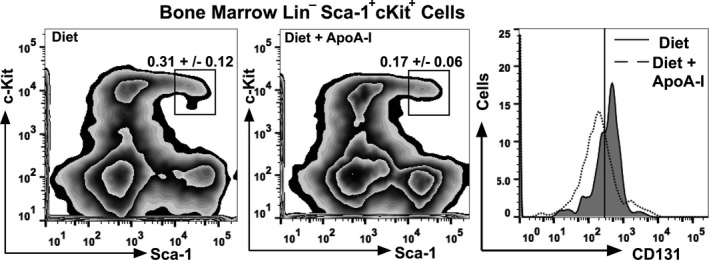
Apolipoprotein A‐I (apoA‐I) treatment reduces LSK cells expressing CD131 in the bone marrow of Ldlr −/− mice. Single‐cell suspensions were prepared from Ldlr −/− bone marrow and analyzed for surface markers using FACS. The left panel shows representative plots indicating gating of live bone marrow cells from diet‐fed Ldlr −/− mice that were linage negative (Lin−) and expressing c‐Kit and Sca‐1 (LSK cells). The middle panel shows representative plots indicating gating of live bone marrow cells from diet+apoA‐I–treated Ldlr −/− mice that were linage negative (Lin−) and expressing c‐Kit and Sca‐1 (LSK cells). The right panel shows representative histograms of LSK cells expressing CD131 for Ldlr −/− mice fed diet (solid line‐shaded) and diet+apoA‐I treatment (dotted line). The data are expressed as the percentage of total bone marrow cells and reflect the mean±SD for 6 to 8 mice per group.
ApoA‐I Modulates Immune Cell Microdomain Cholesterol Composition
Results suggest that apoA‐I administered to diet‐fed Ldlr −/− mice decrease the number of CD131+ expressing cells regardless of immune cell compartment. These data also suggest a cause and effect relationship between apoA‐I administration and reductions in the EC/TC ratio. We next investigated whether we could deplete cellular cholesterol in ex vivo PBMCs following incubation with lipid‐free apoA‐I. Figure 7A shows the EC/TC, FC, EC, and TC content in freshly isolated ex vivo PBMCs isolated from diet‐fed Ldlr −/− mice incubated with 40 μg/mL of lipid‐free human apoA‐I for 4 hours at 37°C, 5% CO2. Following the incubation, cells were gently spun and washed with PBS then stored at −80°C until mass spectrometry was performed. These data show that lipid‐free apoA‐I promotes a significant removal of EC stored in PBMCs from hypercholesterolemic mice. Alternatively, ex vivo PBMCs from chow‐fed Ldlr −/− mice were incubated with human LDL and found to become cholesterol enriched, as shown in Figure 7B. A significant increase in EC/TC ratio was observed only when PBMCs were incubated with 150 μg/mL of human LDL protein. These data suggest that cholesterol loading and unloading of PBMCs may occur in circulation as these cells are in contact with plasma lipoproteins, which, in turn, may alter their activation status. Similar loading/unloading experiments have been conducted on spleen cells and bone marrow cells (data not shown) showing similar changes in cholesterol content in response to incubation with either LDL or apoA‐I.
Figure 7.
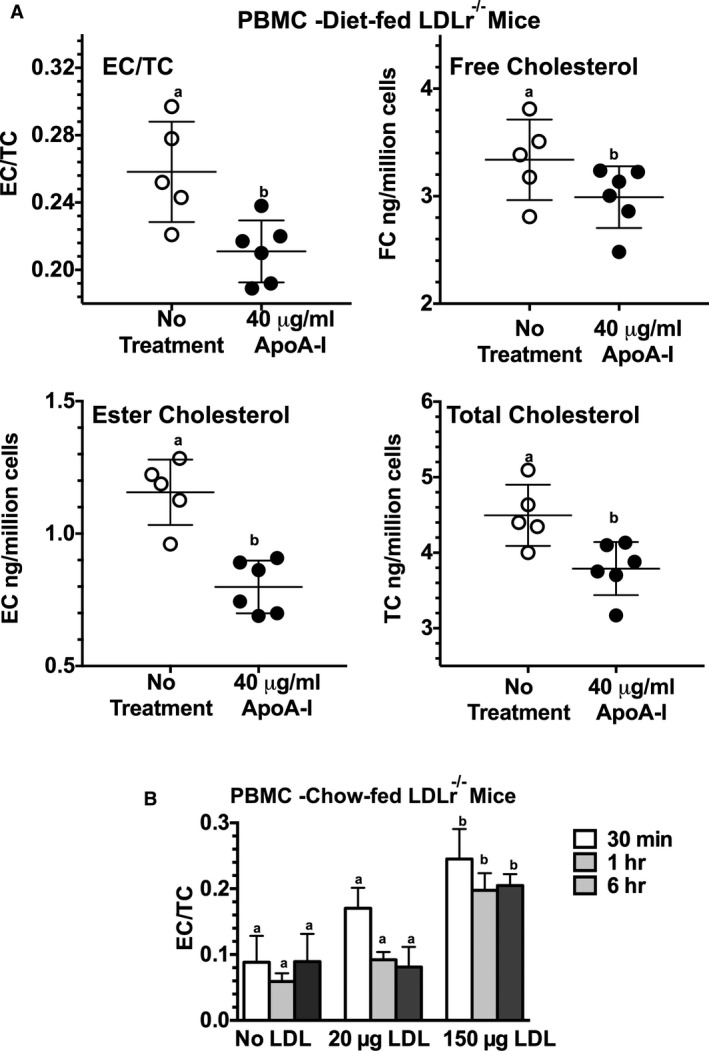
Apolipoprotein A‐I (apoA‐I) reduces cholesterol content in ex vivo peripheral blood mononuclear cells (PBMCs), while incubation with low‐density lipoprotein (LDL) increase the EC/TC ratio. A, The ester cholesterol (EC) to total cholesterol (TC) ratio, free cholesterol (FC), EC, and TC content in freshly isolated ex vivo PBMCs from diet‐fed Ldlr −/− mice expressed as ng/million cells. Approximately 3×10⁵ cells were incubated with 40 μg/mL of lipid‐free human apoA‐I in serum‐free medium for 4 hours at 37°C. Following the incubation, the cells were washed with PBS then stored at −80°C until mass spectrometry was performed, as described in the Methods section. B, The EC/TC ratio following incubation of ≈3×10⁵ PBMCs from chow‐fed Ldlr −/− mice incubated with 150 μg/mL of human LDL protein for 30 minutes, 1 hour, or 6 hours in a final volume of 1 mL of serum‐free medium. Following incubation, the cells were washed extensively with PBS then stored at −80°C until mass spectrometry was performed as described in the Methods section. Results are expressed as the mean±SD for 4 to 6 mice per group. Unlike letters indicate statistical significance at P<0.05.
Given the limited number of PBMCs for lipid raft isolation/Western analyses, we turned to a mouse macrophage tissue culture model in order to investigate the effects of cholesterol loading and unloading on the composition of lipid rafts or microdomains. Since the CD131, or the common β subunit for IL‐3, GM‐CSF, and IL‐5 receptors, has been shown to be activated when localized to lipid rafts56, 61 we sought to determine whether apoA‐I altered its distribution within microdomains. To test this hypothesis, an in vitro model of mouse monocytes, J774 cells were utilized. First, cells were incubated with or without 100 μg/mL LDL to elicit cholesterol loading, after which the medium was removed and the cells were washed and incubated with serum‐free medium containing either 40 μg/mL of apoA‐I or BSA. Figure 8A shows the changes in the EC/TC ratio±preincubation with LDL after which the medium was replaced with either lipid‐free apoA‐I or BSA. These data show that incubation with lipid‐free apoA‐I resulted in a decrease in the cellular EC/TC ratio, while BSA did not, regardless of whether the cells were preloaded. We next examined the composition of the J774 microdomains after each of the various treatments. To do this we performed a nondetergent extraction on J774 cells followed by sucrose density gradient centrifugation and fractionation. Figure 8B shows the results of Western blots of individual density fractions run on 12% SDS PAGE for each of the indicated treatments of J774 cells. For each treatment, blots were probed for flotillin to identify fractions associated with lipid rafts, and tubulin to identify fraction associated with nonraft fractions. In addition, blots were also probed with antibodies to IL‐3β receptor to determine its localization within the sucrose gradient. Lipid rafts typically migrate in a density range between ≈15% to 25% sucrose, corresponding to fractions 2 to 4, while the nonraft fractions migrate to fractions with sucrose densities of ≈35% and higher, typically residing in fractions 6 to 8. Here we see that in J774 cells that were not preloaded with LDL, the lipid raft marker, flotillin resides mainly in fractions 2 and 3 with a small amount in a nonraft fraction 6, while tubulin is mainly located in fractions 7 and 8. Also under these basal conditions, the L3b receptor shows a signal in fraction 3 with the majority of the receptor migrating to nonraft fractions. However, when the J774 cells were preloaded with LDL, we saw a more intense flotillin signal in fraction 3 and a greater signal of IL‐3β receptor in fractions 2, 3, and 4, with corresponding less in the nonraft fractions. Finally, when preloaded J774 cells were treated with apoA‐I, there was a reduction in the flotillin signal in fraction 3, with a greater signal in fraction 7, and a similar shift in signal from raft to nonrafts for IL‐3β receptor.
Figure 8.
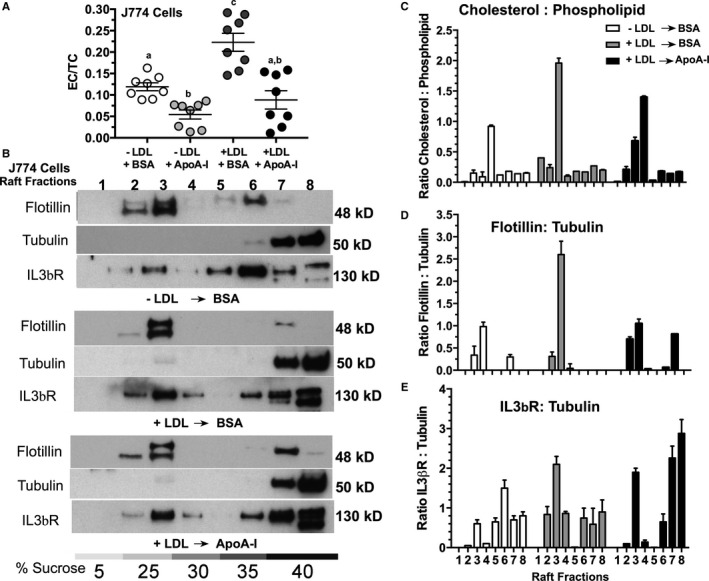
Apolipoprotein A‐I (apoA‐I) treatment changed the cholesterol distribution in J774 cells and modulated lipid raft composition. Confluent J774 cells were incubated in the presence or absence of 100 μg/mL of human low‐density lipoprotein (LDL) protein for 72 hours. After pretreatment of the cells, the monolayers were washed with serum‐free medium and then incubated overnight with either 40 μg/mL of lipid‐free apoA‐I or 40 μg/mL of bovine serum albumin (BSA). The next day, cells were removed from the wells with Versene and washed, and aliquots were used for either lipid extraction or for nondetergent lipid raft isolation. A, The esterified cholesterol/total cholesterol (EC/TC) ratio in J774 cells treated with the indicated conditions showing that incubation with lipid‐free apoA‐I reduces the cellular EC even when the cells were not preloaded with LDL cholesterol. B, Western blot analysis of lipid rafts fractions from each of the indicated treatments of J774 cells following sucrose density gradient centrifugation of nondetergent extracted cells. The top panel shows lipid raft fractions from untreated J774 cells (−LDL, −apoA‐I); the middle panel shows lipid raft fractions from J774 cells treated with 100 μg/mL of LDL for 72 hours, washed and then incubated overnight with 40 μg/mL of BSA (+LDL, −apoA‐I); (B) the bottom panel shows lipid raft fractions from J774 cells treated with 100 μg/mL LDL, washed and then incubated overnight with 40 μg/mL apoA‐I (+LDL, +apoA‐I). C, The cholesterol to phospholipid ratio for each fraction from each of the indicated treatments, as determined by mass spectrometry analyses. D, The intensity ratio of flotillin normalized to the intensity of nonraft tubulin fraction #7, as determined from scans of the corresponding Western blot. E, The intensity ratio of IL‐3β receptor normalized to the intensity of nonraft tubulin fraction #7 from scans of the corresponding Western blot. These ratios are the mean±SD of 3 different raft preparations from plates of J774 cells under each of the indicated conditions.
Confirming the separation of lipid raft from nonraft, Figure 8C shows the compositional analysis by mass spectrometry of the cholesterol to phospholipid ratio for individual fractions following sucrose density gradient centrifugation. In J774 cells, treatment with LDL results in a significant increase in the fraction 3 ratio of cholesterol to phospholipid, which is significantly reduced when preloaded J774 cells are incubated with apoA‐I, but not BSA. In J774 cells that have not been preloaded with LDL, a lower cholesterol to phospholipid ratio is seen in fraction 3, indicating that the lipid raft content is highly sensitive to LDL‐associated cholesterol loading in the culture medium. Finally, to confirm and quantify the distribution of signal intensity for the different Western blot probes, exposed film was scanned and the signal intensities for each band compared for each of the 3 conditions, as shown in Figure 8D and 8E. J774 cells incubated with LDL showed a marked increase in the ratio of signal intensity of flotillin (lipid raft) to tubulin (nonraft) when compared with nonloaded cells. This intensity was reduced when LDL‐treated cells were incubated with apoA‐I, as shown in Figure 8D. The intensity of the IL‐3β receptor signal in rafts fractions 2 to 4 increased significantly in cells preloaded with LDL, over nonloaded cells. Interestingly, when the preloaded cells were treated with apoA‐I, a reduction in the IL‐3β signal was seen in fractions 2 and 4 with a large corresponding shift in intensity to nonraft fractions 7 and 8. Overall, these data strongly support the concept that apoA‐I modulates lipid raft or microdomain cholesterol levels by removing the cholesterol from the cells in the form of nascent HDL particles.27
Discussion
The current studies demonstrate that low‐dose, but continuous, treatment of diet‐fed Ldlr −/− and Ldlr −/− apoA‐I −/− mice with lipid‐free apoA‐I reverses immune cell expansion and the development of atherosclerosis that was induced by hypercholesterolemia. Interestingly, treatments with apoA‐I did not significantly alter plasma cholesterol concentrations, eg, LDL or HDL‐C concentrations, suggesting rather than affecting whole body cholesterol balance, the main effect is on immune cell cholesterol balance as shown by the changes in the cellular EC/TC ratio. This unique ability of lipid‐free apoA‐I to first stimulate removal of cellular cholesterol and secondly to structurally support formation of soluble cholesterol–containing particles, termed nascent HDL, destined for catabolism underlies its protective function in coronary heart disease. Because atherosclerosis is considered a chronic inflammatory disorder, excess intracellular cholesterol within the immune cells stimulate cellular proliferation causing an increase in their production and presence in circulating blood. Our studies represent an extension of work first reported by Yvan‐Charvet et al59 who showed that mice deficient in both ABCA1 and ABCG1 develop increased myeloid cells (Gr‐1+ CD11b+) monocytosis and neutrophilia in blood and bone marrow. These investigators transplanted double knockout mouse bone marrow in transgenic mice expressing apoA‐I and showed that the myeloproliferative disorder was reversed. These studies further showed that enhanced myelopoiesis in the bone marrow was dependent on the hematopoietic growth factor IL‐362 and suggested that HDL suppressed proliferation of myeloid progenitor cells by promoting cholesterol efflux in progenitor cells within the bone marrow. Continued work in this area has further shown that apoE −/− mice develop monocytosis contributing to their aortic lesions56, 63 and that IL‐3 and GM‐CSF receptor promotes stem cell expansion.
Our data also demonstrate that hypercholesterolemia in Ldlr −/− mice, replete with HDL apoA‐I, cellular cholesterol influx exceeds the ability of endogenous HDL apoA‐I to remove it. A consequence of this excess cellular cholesterol is accumulation in membrane lipid rafts. Given the importance of lipid rafts or microdomains as a platform for organizing the signaling of receptors and proteins, including the B‐cell receptor, T‐cell receptor,64, 65, 66 and major histocompatibility class receptors,67, 68 it follows that their cholesterol composition must be carefully regulated. The cholesterol needed for lipid raft formation and maintenance can be derived from exogenous sources such as lipoproteins, especially LDL, or from cellular synthesis via the mevalonate pathway in the endoplasmic reticulum followed by transport to the plasma membrane,69, 70 or from intracellular CE droplets. Movement of cholesterol out of lipid droplet relies on extrinsic signals promoting the hydrolysis of CE by cholesterol ester hydrolases.71, 72 FC can either be utilized for cellular membrane maintenance or moved to a substrate pool for export via ABCA1.73, 74 ABCA1 under the control of the liver X receptor is the uniquely sensitive master controller of membrane cholesterol that regulates lipid raft composition.75 ABCA1 was originally discovered while investigating the molecular defect in individuals with Tangier disease who lacked normal levels of plasma HDL.76 It was quickly realized that the cholesterol transport function of ABCA1 was essential in maintaining lipid raft composition and function.77, 78, 79, 80, 81, 82, 83, 84, 85 To remove cholesterol efficiently from the cell, ABCA1 requires the assistance of proteins that solubilize and organize hydrophobic cholesterol molecules into lipoprotein particles and target them to the liver for elimination.25 One such protein, apoA‐I, the principal protein constituent of HDL,24 is uniquely capable of these functions and is also one of the most abundant proteins present in plasma17 and lymph.86 Further recognition that cholesterol efflux and lipid raft cholesterol maintenance were one and the same process followed after discovering that the lipid composition of nascent HDL was similar to that typically found in microdomains from cell membranes.27, 87 SC injection of microgram amounts of lipid‐free apoA‐I into mice has resulted in improved immune cell function and reduced atherosclerosis while not appreciably changing the plasma HDL‐C concentration.42, 44 These results demonstrate that critical changes in cholesterol concentrations associated with the artery may be accomplished with moderate or no change in the total plasma HDL‐C concentration.
Net accumulation of immune cells in aortic plaques is proportional to monocyte recruitment from bone marrow along with peripheral proliferation, including within the plaque,73, 88 that is counterbalanced by the emigration and death of macrophages. A new focus on this process57, 89 has examined how cholesterol loading of macrophages increased the expression of netrin 1 and semaphorin 3E, which inhibit migration causing retention of macrophages in atherosclerotic lesions,90, 91, 92 a process that involves lipid raft microdomains where both receptors are located.92, 93, 94, 95 Activation and proliferation of immune cells drives atherosclerosis and is characterized in hypercholesterolemic animal models by a sharp increase in the number of Ly‐6Chi monocytes in circulation that are recruited to plaques.54, 55, 96 Cholesterol accumulation by monocytes significantly affects the recruitment and proliferation of these inflammatory monocytes.57, 97 Interestingly, native, but not acetylated LDL, was found to support human lymphocyte proliferation when endogenous cholesterol synthesis was inhibited,98 suggesting that uptake of modified LDL markedly impairs intracellular regulation of lymphocyte cholesterol. The process by which immune cells respond to alterations in cholesterol homeostasis has been extensively studied in HSPCs in bone marrow, which give rise to monocytes and neutrophils.56, 59 HSPCs from both apoE −/− mice and Abca1 −/−, Abcg1 −/− mice display increased cell surface levels of the common β subunit of the GM‐CSF and IL‐3 receptors60 due to increased cellular cholesterol concentrations. Bone marrow HSPC expansion in response to hypercholesterolemia leads to neutrophilia and monocytosis, the latter leading to more inflammatory monocytes that are likely to infiltrate and remain in the artery wall.73 IL‐3 and GM‐CSF contribute to leukocyte proliferation, differentiation, and survival and share a common β‐chain receptor subunit CD131. IL‐3 binds to the heterodimer IL‐3 receptor α‐chain, CD123, and CD131, leading to excessive leukocyte proliferation and fueling a cytokine storm that has recently been linked to atherosclerosis, exacerbation of MI, heart failure, and sepsis.99, 100 Studies have shown that CD131 localizes to lipid rafts when stimulated with GM‐CSF, leading to activation of p38 mitogen‐activated protein kinases, which activate cytokine gene expression.101 Increased cholesterol content of the outer leaflet of the macrophage plasma membrane was associated with increased Rac1 signaling and activation and a decrease in chemotaxis,102 suggesting that both ABCA1 and ABCG1 are involved in regulating the microdomains in these cells. The central role of lipid microdomains in cell signaling and the constant necessity for regulating expansion and contraction of these microdomains attests to the importance of therapies that focus on the regulating cholesterol homeostasis. Although the use of statins can reduce plasma cholesterol levels, regulation of cellular lipid microdomains requires cholesterol efflux via apoA‐I– or apoE‐mediated pathways.
Conclusions
We conclude that apoA‐I treatment in hypercholesterolemic mice reduced lipid and immune cell accumulation within the aortic root by systemically reducing microdomain cholesterol content in immune cells. These data suggest that lipid‐free apoA‐I mediates beneficial effects through attenuation of immune cell lipid raft cholesterol content, which has the ability to affect numerous types of signal transduction pathways that rely on microdomain integrity for assembly and activation, without changing the levels of plasma HDL‐C. These studies have important implications as therapeutics are sought for the protection against the development of cholesterol accumulation within the artery wall.
Sources of Funding
This research was supported by grants from the National Institutes of Health R01HL112270 and R01HL127649 (Sorci‐Thomas). Analytical flow cytometry is supported by the Children's Research Institution Shared Flow Cytometry Resource located at the Medical College of Wisconsin. The TOPS study was supported by grants from the National Institutes of Health DK 071895 and DK65598 and by TOPS Club, Inc.
Disclosures
None.
Supporting information
Figure S1. Subcutaneous injections of lipid‐free Apolipoprotein A‐I (apoA‐I) and plasma lipoprotein concentrations. Western diet–fed Ldlr −/− mice were subcutaneously injected with either 200 μg of lipid‐free human apoA‐I or bovine serum albumin every other day. Data show the concentration of human apoA‐I in mouse plasma at each of the indicated times over a 48‐hour period following injection of lipid‐free human apoA‐I. Asterisks show significant differences at P<0.05 from time=0 after apoA‐I was injected. Data shown are the mean±SD of 5 mice.
Figure S2. Esterified cholesterol/total cholesterol (EC/TC) ratio in human peripheral blood mononuclear cells (PBMCs) shows an inverse correlation with high‐density lipoprotein (HDL) cholesterol concentration. PBMCs from 56 participants as part of the Take Off Pounds Sensibly (TOPS Club, Inc) were assayed for their EC/TC and correlated with each individual's HDL cholesterol concentration. Linear regression analysis of the EC/TC ratio versus HDL cholesterol concentration gave r=−0.432 with P=0.0093 for 56 participants.
Figure S3. Apolipoprotein A‐I (ApoA‐I) treatment modulates the esterified cholesterol/total cholesterol (EC/TC) ratio in mouse artery cells. Western diet–fed Ldlr −/− mice were subcutaneously injected with either 200 μg of lipid‐free human apoA‐I or bovine serum albumin every other day. Arterial explants were cleaned and digested, as described in the Methods section, and then the EC/TC ratio was determined by mass spectrometry. Data show mean±SD from 3 to 5 mice.
Acknowledgments
We would like to thank Daniel Ferguson for his help with atherosclerotic evaluations and Tamara Nelson for help with FACS analysis. We also thank Jacqueline Marks (Medical College of Wisconsin) for her supervision of all biochemical procedures, and finally all of the members of TOPS Club, Inc, and their families who volunteered for this study.
(J Am Heart Assoc. 2016;5:e004401 doi: 10.1161/JAHA.116.004401)
References
- 1. Emerging Risk Factors Collaboration , Di Angelantonio E, Sarwar N, Perry P, Kaptoge S, Ray KK, Thompson A, Wood AM, Lewington S, Sattar N, Packard CJ, Collins R, Thompson SG, Danesh J. Major lipids, apolipoproteins, and risk of vascular disease. JAMA. 2009;302:1993–2000. [DOI] [PMC free article] [PubMed] [Google Scholar]
- 2. Degoma EM, Rader DJ. Novel HDL‐directed pharmacotherapeutic strategies. Nat Rev Cardiol. 2011;8:266–277. [DOI] [PMC free article] [PubMed] [Google Scholar]
- 3. Voight BF, Peloso GM, Orho‐Melander M, Frikke‐Schmidt R, Barbalic M, Jensen MK, Hindy G, Holm H, Ding EL, Johnson T, Schunkert H, Samani NJ, Clarke R, Hopewell JC, Thompson JF, Li M, Thorleifsson G, Newton‐Cheh C, Musunuru K, Pirruccello JP, Saleheen D, Chen L, Stewart AF, Schillert A, Thorsteinsdottir U, Thorgeirsson G, Anand S, Engert JC, Morgan T, Spertus J, Stoll M, Berger K, Martinelli N, Girelli D, McKeown PP, Patterson CC, Epstein SE, Devaney J, Burnett MS, Mooser V, Ripatti S, Surakka I, Nieminen MS, Sinisalo J, Lokki ML, Perola M, Havulinna A, de Faire U, Gigante B, Ingelsson E, Zeller T, Wild P, de Bakker PI, Klungel OH, Maitland‐van der Zee AH, Peters BJ, de Boer A, Grobbee DE, Kamphuisen PW, Deneer VH, Elbers CC, Onland‐Moret NC, Hofker MH, Wijmenga C, Verschuren WM, Boer JM, van der Schouw YT, Rasheed A, Frossard P, Demissie S, Willer C, Do R, Ordovas JM, Abecasis GR, Boehnke M, Mohlke KL, Daly MJ, Guiducci C, Burtt NP, Surti A, Gonzalez E, Purcell S, Gabriel S, Marrugat J, Peden J, Erdmann J, Diemert P, Willenborg C, Konig IR, Fischer M, Hengstenberg C, Ziegler A, Buysschaert I, Lambrechts D, Van de Werf F, Fox KA, El Mokhtari NE, Rubin D, Schrezenmeir J, Schreiber S, Schafer A, Danesh J, Blankenberg S, Roberts R, McPherson R, Watkins H, Hall AS, Overvad K, Rimm E, Boerwinkle E, Tybjaerg‐Hansen A, Cupples LA, Reilly MP, Melander O, Mannucci PM, Ardissino D, Siscovick D, Elosua R, Stefansson K, O'Donnell CJ, Salomaa V, Rader DJ, Peltonen L, Schwartz SM, Altshuler D, Kathiresan S. Plasma HDL cholesterol and risk of myocardial infarction: a Mendelian randomisation study. Lancet. 2012;380:564. [DOI] [PMC free article] [PubMed] [Google Scholar]
- 4. Barter PJ, Rye KA. Cholesteryl ester transfer protein inhibition is not yet dead‐pro. Arterioscler Thromb Vasc Biol. 2016;36:439–441. [DOI] [PubMed] [Google Scholar]
- 5. Heinecke JW. Small HDL promotes cholesterol efflux by the ABCA1 pathway in macrophages: implications for therapies targeted to HDL. Circ Res. 2015;116:1101–1103. [DOI] [PMC free article] [PubMed] [Google Scholar]
- 6. Du X, Kim MJ, Hou L, Le Goff W, Chapman MJ, van Eck M, Curtiss LK, Burnett J, Cartland SP, Quinn CM, Kockx M, Kontush A, Rye KA, Kritharides L, Jessup W. HDL particle size is a critical determinant of ABCA1‐mediated macrophage cellular cholesterol export. Circ Res. 2015;116:1133–1142. [DOI] [PubMed] [Google Scholar]
- 7. Mendivil CO, Furtado J, Morton AM, Wang L, Sacks FM. Novel pathways of apolipoprotein A‐I metabolism in high‐density lipoprotein of different sizes in humans. Arterioscler Thromb Vasc Biol. 2016;36:156–165. [DOI] [PMC free article] [PubMed] [Google Scholar]
- 8. Yamauchi Y, Yokoyama S, Chang TY. ABCA1‐dependent sterol release: sterol molecule specificity and potential membrane domain for HDL biogenesis. J Lipid Res. 2016;57:77–88. [DOI] [PMC free article] [PubMed] [Google Scholar]
- 9. Rader DJ, Hovingh GK. HDL and cardiovascular disease. Lancet. 2014;384:618–625. [DOI] [PubMed] [Google Scholar]
- 10. Rosenson RS, Brewer HB Jr, Ansell BJ, Barter P, Chapman MJ, Heinecke JW, Kontush A, Tall AR, Webb NR. Dysfunctional HDL and atherosclerotic cardiovascular disease. Nat Rev Cardiol. 2016;13:48–60. [DOI] [PMC free article] [PubMed] [Google Scholar]
- 11. Hafiane A, Genest J. High density lipoproteins: measurement techniques and potential biomarkers of cardiovascular risk. BBA Clin. 2015;3:175–188. [DOI] [PMC free article] [PubMed] [Google Scholar]
- 12. Remaley AT, Norata GD, Catapano AL. Novel concepts in HDL pharmacology. Cardiovasc Res. 2014;103:423–428. [DOI] [PMC free article] [PubMed] [Google Scholar]
- 13. Hutchins PM, Heinecke JW. Cholesterol efflux capacity, macrophage reverse cholesterol transport and cardioprotective HDL. Curr Opin Lipidol. 2015;26:388–393. [DOI] [PMC free article] [PubMed] [Google Scholar]
- 14. Khera AV, Cuchel M, de la Llera‐Moya M, Rodrigues A, Burke MF, Jafri K, French BC, Phillips JA, Mucksavage ML, Wilensky RL, Mohler ER, Rothblat GH, Rader DJ. Cholesterol efflux capacity, high‐density lipoprotein function, and atherosclerosis. N Engl J Med. 2011;364:127–135. [DOI] [PMC free article] [PubMed] [Google Scholar]
- 15. Rohatgi A, Khera A, Berry JD, Givens EG, Ayers CR, Wedin KE, Neeland IJ, Yuhanna IS, Rader DR, de Lemos JA, Shaul PW. HDL cholesterol efflux capacity and incident cardiovascular events. N Engl J Med. 2014;371:2383–2393. [DOI] [PMC free article] [PubMed] [Google Scholar]
- 16. Feig JE, Hewing B, Smith JD, Hazen SL, Fisher EA. High‐density lipoprotein and atherosclerosis regression: evidence from preclinical and clinical studies. Circ Res. 2014;114:205–213. [DOI] [PMC free article] [PubMed] [Google Scholar]
- 17. Kingwell BA, Chapman MJ, Kontush A, Miller NE. HDL‐targeted therapies: progress, failures and future. Nat Rev Drug Discov. 2014;13:445–464. [DOI] [PubMed] [Google Scholar]
- 18. de la Llera‐Moya M, Drazul‐Schrader D, Asztalos BF, Cuchel M, Rader DJ, Rothblat GH. The ability to promote efflux via ABCA1 determines the capacity of serum specimens with similar high‐density lipoprotein cholesterol to remove cholesterol from macrophages. Arterioscler Thromb Vasc Biol. 2010;30:796–801. [DOI] [PMC free article] [PubMed] [Google Scholar]
- 19. Asztalos BF, de la Llera‐Moya M, Dallal GE, Horvath KV, Schaefer EJ, Rothblat GH. Differential effects of HDL subpopulations on cellular ABCA1‐ and SR‐BI‐mediated cholesterol efflux. J Lipid Res. 2005;46:2246–2253. [DOI] [PubMed] [Google Scholar]
- 20. Curtiss LK, Valenta DT, Hime NJ, Rye KA. What is so special about apolipoprotein AI in reverse cholesterol transport? Arterioscler Thromb Vasc Biol. 2006;26:12–19. [DOI] [PubMed] [Google Scholar]
- 21. Hoofnagle AN, Heinecke JW. Lipoproteomics: using mass spectrometry‐based proteomics to explore the assembly, structure, and function of lipoproteins. J Lipid Res. 2009;50:1967–1975. [DOI] [PMC free article] [PubMed] [Google Scholar]
- 22. Pamir N, Hutchins P, Ronsein G, Vaisar T, Reardon CA, Getz GS, Lusis AJ, Heinecke JW. Proteomic analysis of HDL from inbred mouse strains implicates APOE associated with HDL in reduced cholesterol efflux capacity via the ABCA1 pathway. J Lipid Res. 2016;57:246–257. [DOI] [PMC free article] [PubMed] [Google Scholar]
- 23. Kontush A, Lindahl M, Lhomme M, Calabresi L, Chapman MJ, Davidson WS. Structure of HDL: particle subclasses and molecular components. Handb Exp Pharmacol. 2015;224:3–51. [DOI] [PubMed] [Google Scholar]
- 24. Sorci‐Thomas MG, Thomas MJ. The effects of altered apolipoprotein A‐I structure on plasma HDL concentration. Trends Cardiovasc Med. 2002;12:121–128. [DOI] [PubMed] [Google Scholar]
- 25. Sorci‐Thomas MG, Thomas MJ. Why targeting HDL should work as a therapeutic tool, but has not. J Cardiovasc Pharmacol. 2013;62:239–246. [DOI] [PMC free article] [PubMed] [Google Scholar]
- 26. Sorci‐Thomas MG, Thomas MJ. Microdomains, inflammation, and atherosclerosis. Circ Res. 2016;118:679–691. [DOI] [PMC free article] [PubMed] [Google Scholar]
- 27. Sorci‐Thomas MG, Owen JS, Fulp B, Bhat S, Zhu X, Parks JS, Shah D, Jerome WG, Gerelus M, Zabalawi M, Thomas MJ. Nascent high density lipoproteins formed by ABCA1 resemble lipid rafts and are structurally organized by three apoA‐I monomers. J Lipid Res. 2012;53:1890–1909. [DOI] [PMC free article] [PubMed] [Google Scholar]
- 28. Badimon JJ, Badimon L, Fuster V. Regression of atherosclerotic lesions by high density lipoprotein plasma fraction in the cholesterol‐fed rabbit. J Clin Invest. 1990;85:1234–1241. [DOI] [PMC free article] [PubMed] [Google Scholar]
- 29. Waksman R, Torguson R, Kent KM, Pichard AD, Suddath WO, Satler LF, Martin BD, Perlman TJ, Maltais JA, Weissman NJ, Fitzgerald PJ, Brewer HB Jr. A first‐in‐man, randomized, placebo‐controlled study to evaluate the safety and feasibility of autologous delipidated high‐density lipoprotein plasma infusions in patients with acute coronary syndrome. J Am Coll Cardiol. 2010;55:2727–2735. [DOI] [PubMed] [Google Scholar]
- 30. Nissen SE, Tsunoda T, Tuzcu EM, Schoenhagen P, Cooper CJ, Yasin M, Eaton GM, Lauer MA, Sheldon WS, Grines CL, Halpern S, Crowe T, Blankenship JC, Kerensky R. Effect of recombinant ApoA‐I Milano on coronary atherosclerosis in patients with acute coronary syndromes: a randomized controlled trial. JAMA. 2003;290:2292–2300. [DOI] [PubMed] [Google Scholar]
- 31. Bursill CA, Castro ML, Beattie DT, Nakhla S, van der Vorst E, Heather AK, Barter PJ, Rye KA. High‐density lipoproteins suppress chemokines and chemokine receptors in vitro and in vivo. Arterioscler Thromb Vasc Biol. 2010;30:1773–1778. [DOI] [PubMed] [Google Scholar]
- 32. Chen Z, O'Neill EA, Meurer RD, Gagen K, Luell S, Wang SP, Ichetovkin M, Frantz‐Wattley B, Eveland S, Strack AM, Fisher TS, Johns DG, Sparrow CP, Wright SD, Hubbard BK, Carballo‐Jane E. Reconstituted HDL elicits marked changes in plasma lipids following single‐dose injection in C57Bl/6 mice. J Cardiovasc Pharmacol Ther. 2012;17:315–323. [DOI] [PubMed] [Google Scholar]
- 33. Shaw JA, Bobik A, Murphy A, Kanellakis P, Blombery P, Mukhamedova N, Woollard K, Lyon S, Sviridov D, Dart AM. Infusion of reconstituted high‐density lipoprotein leads to acute changes in human atherosclerotic plaque. Circ Res. 2008;103:1084–1091. [DOI] [PubMed] [Google Scholar]
- 34. Darabi M, Guillas‐Baudouin I, Le Goff W, Chapman MJ, Kontush A. Therapeutic applications of reconstituted HDL: when structure meets function. Pharmacol Ther. 2016;157:28–42. [DOI] [PubMed] [Google Scholar]
- 35. Kempen HJ, Schranz DB, Asztalos BF, Otvos J, Jeyarajah E, Drazul‐Schrader D, Collins HL, Adelman SJ, Wijngaard PL. Incubation of MDCO‐216 (Apoa‐Imilano/POPC) with human serum potentiates ABCA1‐mediated cholesterol efflux capacity, generates new prebeta‐1 HDL, and causes an increase in HDL size. J Lipids. 2014;2014:923903. [DOI] [PMC free article] [PubMed] [Google Scholar]
- 36. Kempen HJ, Asztalos BF, Moerland M, Jeyarajah E, Otvos J, Kallend DG, Bellibas SE, Wijngaard PL. High‐density lipoprotein subfractions and cholesterol efflux capacities after infusion of MDCO‐216 (apolipoprotein A‐IMilano/palmitoyl‐oleoyl‐phosphatidylcholine) in healthy volunteers and stable coronary artery disease patients. Arterioscler Thromb Vasc Biol. 2016;36:736–742. [DOI] [PubMed] [Google Scholar]
- 37. Chiesa G, Monteggia E, Marchesi M, Lorenzon P, Laucello M, Lorusso V, Di Mario C, Karvouni E, Newton RS, Bisgaier CL, Franceschini G, Sirtori CR. Recombinant apolipoprotein A‐I(Milano) infusion into rabbit carotid artery rapidly removes lipid from fatty streaks. Circ Res. 2002;90:974–980. [DOI] [PubMed] [Google Scholar]
- 38. Parolini C, Marchesi M, Lorenzon P, Castano M, Balconi E, Miragoli L, Chaabane L, Morisetti A, Lorusso V, Martin BJ, Bisgaier CL, Krause B, Newton RS, Sirtori CR, Chiesa G. Dose‐related effects of repeated ETC‐216 (recombinant apolipoprotein A‐I Milano/1‐palmitoyl‐2‐oleoyl phosphatidylcholine complexes) administrations on rabbit lipid‐rich soft plaques: in vivo assessment by intravascular ultrasound and magnetic resonance imaging. J Am Coll Cardiol. 2008;51:1098–1103. [DOI] [PubMed] [Google Scholar]
- 39. Tardif JC, Gregoire J, L'Allier PL, Ibrahim R, Lesperance J, Heinonen TM, Kouz S, Berry C, Basser R, Lavoie MA, Guertin MC, Rodes‐Cabau J; Effect of r HDLoA‐S, Efficacy I . Effects of reconstituted high‐density lipoprotein infusions on coronary atherosclerosis: a randomized controlled trial. JAMA. 2007;297:1675–1682. [DOI] [PubMed] [Google Scholar]
- 40. Herzog E, Pragst I, Waelchli M, Gille A, Schenk S, Mueller‐Cohrs J, Diditchenko S, Zanoni P, Cuchel M, Seubert A, Rader DJ, Wright SD. Reconstituted high‐density lipoprotein can elevate plasma alanine aminotransferase by transient depletion of hepatic cholesterol: role of the phospholipid component. J Appl Toxicol. 2016;36:1038–1047. [DOI] [PubMed] [Google Scholar]
- 41. Zabalawi M, Bhat S, Loughlin T, Thomas MJ, Alexander E, Cline M, Bullock B, Willingham M, Sorci‐Thomas MG. Induction of fatal inflammation in LDL receptor and ApoA‐I double‐knockout mice fed dietary fat and cholesterol. Am J Pathol. 2003;163:1201–1213. [DOI] [PMC free article] [PubMed] [Google Scholar]
- 42. Wilhelm AJ, Zabalawi M, Grayson JM, Weant AE, Major AS, Owen J, Bharadwaj M, Walzem R, Chan L, Oka K, Thomas MJ, Sorci‐Thomas MG. Apolipoprotein A‐I and its role in lymphocyte cholesterol homeostasis and autoimmunity. Arterioscler Thromb Vasc Biol. 2009;29:843–849. [DOI] [PMC free article] [PubMed] [Google Scholar]
- 43. Zabalawi M, Bharadwaj M, Horton H, Cline M, Willingham M, Thomas MJ, Sorci‐Thomas MG. Inflammation and skin cholesterol in LDLr−/−, apoA‐I−/− mice: link between cholesterol homeostasis and self‐tolerance? J Lipid Res. 2007;48:52–65. [DOI] [PubMed] [Google Scholar]
- 44. Wilhelm AJ, Zabalawi M, Owen JS, Shah D, Grayson JM, Major AS, Bhat S, Gibbs DP Jr, Thomas MJ, Sorci‐Thomas MG. Apolipoprotein A‐I modulates regulatory T cells in autoimmune LDLr−/−, ApoA‐I−/− mice. J Biol Chem. 2010;285:36158–36169. [DOI] [PMC free article] [PubMed] [Google Scholar]
- 45. Tavori H, Su YR, Yancey PG, Giunzioni I, Wilhelm AJ, Blakemore JL, Zabalawi M, Linton MF, Sorci‐Thomas MG, Fazio S. Macrophage apoAI protects against dyslipidemia‐induced dermatitis and atherosclerosis without affecting HDL. J Lipid Res. 2015;56:635–643. [DOI] [PMC free article] [PubMed] [Google Scholar]
- 46. Gao M, Zhao D, Schouteden S, Sorci‐Thomas MG, Van Veldhoven PP, Eggermont K, Liu G, Verfaillie CM, Feng Y. Regulation of high‐density lipoprotein on hematopoietic stem/progenitor cells in atherosclerosis requires scavenger receptor type BI expression. Arterioscler Thromb Vasc Biol. 2014;34:1900–1909. [DOI] [PMC free article] [PubMed] [Google Scholar]
- 47. Sorci‐Thomas MG, Pollard RD, Thomas MJ. What does procollagen C‐endopeptidase enhancer protein 2 have to do with HDL‐cholesteryl ester uptake? Or how I learned to stop worrying and love reverse cholesterol transport? Curr Opin Lipidol. 2015;26:420–425. [DOI] [PMC free article] [PubMed] [Google Scholar]
- 48. Galkina E, Kadl A, Sanders J, Varughese D, Sarembock IJ, Ley K. Lymphocyte recruitment into the aortic wall before and during development of atherosclerosis is partially L‐selectin dependent. J Exp Med. 2006;203:1273–1282. [DOI] [PMC free article] [PubMed] [Google Scholar]
- 49. Kissebah AH, Krakower GR. Regional adiposity and morbidity. Physiol Rev. 1994;74:761–811. [DOI] [PubMed] [Google Scholar]
- 50. Kissebah AH, Sonnenberg GE, Myklebust J, Goldstein M, Broman K, James RG, Marks JA, Krakower GR, Jacob HJ, Weber J, Martin L, Blangero J, Comuzzie AG. Quantitative trait loci on chromosomes 3 and 17 influence phenotypes of the metabolic syndrome. Proc Natl Acad Sci USA. 2000;97:14478–14483. [DOI] [PMC free article] [PubMed] [Google Scholar]
- 51. Talameh Y, Wei R, Naito H. Measurement of total HDL, HDL2 and HDL3 by dextran sulfate‐MgCl2 precipitation technique in human serum. Clin Chim Acta. 1986;158:33–41. [DOI] [PubMed] [Google Scholar]
- 52. Lowry OH, Rosebrough NJ, Farr AL, Randall RJ. Protein measurement with the folin phenol reagent. J Biol Chem. 1951;193:265–275. [PubMed] [Google Scholar]
- 53. Rouser G, Siakotos AN, Fleischer S. Quantitative analysis of phospholipids by thin‐layer chromatography and phosphorus analysis of spots. Lipids. 1966;1:85–86. [DOI] [PubMed] [Google Scholar]
- 54. Robbins CS, Chudnovskiy A, Rauch PJ, Figueiredo JL, Iwamoto Y, Gorbatov R, Etzrodt M, Weber GF, Ueno T, van Rooijen N, Mulligan‐Kehoe MJ, Libby P, Nahrendorf M, Pittet MJ, Weissleder R, Swirski FK. Extramedullary hematopoiesis generates Ly‐6C(high) monocytes that infiltrate atherosclerotic lesions. Circulation. 2012;125:364–374. [DOI] [PMC free article] [PubMed] [Google Scholar]
- 55. Swirski FK, Libby P, Aikawa E, Alcaide P, Luscinskas FW, Weissleder R, Pittet MJ. Ly‐6Chi monocytes dominate hypercholesterolemia‐associated monocytosis and give rise to macrophages in atheromata. J Clin Invest. 2007;117:195–205. [DOI] [PMC free article] [PubMed] [Google Scholar]
- 56. Murphy AJ, Akhtari M, Tolani S, Pagler T, Bijl N, Kuo CL, Wang M, Sanson M, Abramowicz S, Welch C, Bochem AE, Kuivenhoven JA, Yvan‐Charvet L, Tall AR. ApoE regulates hematopoietic stem cell proliferation, monocytosis, and monocyte accumulation in atherosclerotic lesions in mice. J Clin Invest. 2011;121:4138–4149. [DOI] [PMC free article] [PubMed] [Google Scholar]
- 57. Potteaux S, Gautier EL, Hutchison SB, van Rooijen N, Rader DJ, Thomas MJ, Sorci‐Thomas MG, Randolph GJ. Suppressed monocyte recruitment drives macrophage removal from atherosclerotic plaques of Apoe−/− mice during disease regression. J Clin Invest. 2011;121:2025–2036. [DOI] [PMC free article] [PubMed] [Google Scholar]
- 58. Combadiere C, Potteaux S, Rodero M, Simon T, Pezard A, Esposito B, Merval R, Proudfoot A, Tedgui A, Mallat Z. Combined inhibition of CCL2, CX3CR1, and CCR5 abrogates Ly6C(hi) and Ly6C(lo) monocytosis and almost abolishes atherosclerosis in hypercholesterolemic mice. Circulation. 2008;117:1649–1657. [DOI] [PubMed] [Google Scholar]
- 59. Yvan‐Charvet L, Pagler T, Gautier EL, Avagyan S, Siry RL, Han S, Welch CL, Wang N, Randolph GJ, Snoeck HW, Tall AR. ATP‐binding cassette transporters and HDL suppress hematopoietic stem cell proliferation. Science. 2010;328:1689–1693. [DOI] [PMC free article] [PubMed] [Google Scholar]
- 60. Wang M, Subramanian M, Abramowicz S, Murphy AJ, Gonen A, Witztum J, Welch C, Tabas I, Westerterp M, Tall AR. Interleukin‐3/granulocyte macrophage colony‐stimulating factor receptor promotes stem cell expansion, monocytosis, and atheroma macrophage burden in mice with hematopoietic ApoE deficiency. Arterioscler Thromb Vasc Biol. 2014;34:976–984. [DOI] [PMC free article] [PubMed] [Google Scholar]
- 61. Murphy AJ, Dragoljevic D, Tall AR. Cholesterol efflux pathways regulate myelopoiesis: a potential link to altered macrophage function in atherosclerosis. Front Immunol. 2014;5:490. [DOI] [PMC free article] [PubMed] [Google Scholar]
- 62. Tall AR, Yvan‐Charvet L, Westerterp M, Murphy AJ. Cholesterol efflux: a novel regulator of myelopoiesis and atherogenesis. Arterioscler Thromb Vasc Biol. 2012;32:2547–2552. [DOI] [PubMed] [Google Scholar]
- 63. Soehnlein O, Swirski FK. Hypercholesterolemia links hematopoiesis with atherosclerosis. Trends Endocrinol Metab. 2013;24:129–136. [DOI] [PMC free article] [PubMed] [Google Scholar]
- 64. Foks AC, Lichtman AH, Kuiper J. Treating atherosclerosis with regulatory T cells. Arterioscler Thromb Vasc Biol. 2015;35:280–287. [DOI] [PMC free article] [PubMed] [Google Scholar]
- 65. Subramanian M, Thorp E, Hansson GK, Tabas I. Treg‐mediated suppression of atherosclerosis requires MYD88 signaling in DCs. J Clin Invest. 2013;123:179–188. [DOI] [PMC free article] [PubMed] [Google Scholar]
- 66. Ait‐Oufella H, Sage AP, Mallat Z, Tedgui A. Adaptive (T and B cells) immunity and control by dendritic cells in atherosclerosis. Circ Res. 2014;114:1640–1660. [DOI] [PubMed] [Google Scholar]
- 67. Dixon AM, Drake L, Hughes KT, Sargent E, Hunt D, Harton JA, Drake JR. Differential transmembrane domain GXXXG motif pairing impacts major histocompatibility complex (MHC) class II structure. J Biol Chem. 2014;289:11695–11703. [DOI] [PMC free article] [PubMed] [Google Scholar]
- 68. Anderson HA, Roche PA. MHC class II association with lipid rafts on the antigen presenting cell surface. Biochim Biophys Acta. 2015;1853:775–780. [DOI] [PMC free article] [PubMed] [Google Scholar]
- 69. Jelinek D, Patrick SM, Kitt KN, Chan T, Francis GA, Garver WS. Physiological and coordinate downregulation of the NPC1 and NPC2 genes are associated with the sequestration of LDL‐derived cholesterol within endocytic compartments. J Cell Biochem. 2009;108:1102–1116. [DOI] [PubMed] [Google Scholar]
- 70. Dubland JA, Francis GA. Lysosomal acid lipase: at the crossroads of normal and atherogenic cholesterol metabolism. Front Cell Dev Biol. 2015;3:3. [DOI] [PMC free article] [PubMed] [Google Scholar]
- 71. Ghosh S. Early steps in reverse cholesterol transport: cholesteryl ester hydrolase and other hydrolases. Curr Opin Endocrinol Diabetes Obes. 2012;19:136–141. [DOI] [PubMed] [Google Scholar]
- 72. Ghosh S. Macrophage cholesterol homeostasis and metabolic diseases: critical role of cholesteryl ester mobilization. Expert Rev Cardiovasc Ther. 2011;9:329–340. [DOI] [PMC free article] [PubMed] [Google Scholar]
- 73. Moore KJ, Sheedy FJ, Fisher EA. Macrophages in atherosclerosis: a dynamic balance. Nat Rev Immunol. 2013;13:709–721. [DOI] [PMC free article] [PubMed] [Google Scholar]
- 74. Neufeld EB, O'Brien K, Walts AD, Stonik JA, Malide D, Combs CA, Remaley AT. The human ABCG1 transporter mobilizes plasma membrane and late endosomal non‐sphingomyelin‐associated‐cholesterol for efflux and esterification. Biology (Basel). 2014;3:866–891. [DOI] [PMC free article] [PubMed] [Google Scholar]
- 75. Ito A, Hong C, Rong X, Zhu X, Tarling EJ, Hedde PN, Gratton E, Parks J, Tontonoz P. LXRs link metabolism to inflammation through Abca1‐dependent regulation of membrane composition and TLR signaling. Elife. 2015;4:e08009. [DOI] [PMC free article] [PubMed] [Google Scholar]
- 76. Marcil M, Yu L, Krimbou L, Boucher B, Oram JF, Cohn JS, Genest J Jr. Cellular cholesterol transport and efflux in fibroblasts are abnormal in subjects with familial HDL deficiency. Arterioscler Thromb Vasc Biol. 1999;19:159–169. [DOI] [PubMed] [Google Scholar]
- 77. Ma L, Dong F, Zaid M, Kumar A, Zha X. ABCA1 protein enhances Toll‐like receptor 4 (TLR4)‐stimulated interleukin‐10 (IL‐10) secretion through protein kinase a (PKA) activation. J Biol Chem. 2012;287:40502–40512. [DOI] [PMC free article] [PubMed] [Google Scholar]
- 78. Liu Y, Tang C. Regulation of ABCA1 functions by signaling pathways. Biochim Biophys Acta. 2012;1821:522–529. [DOI] [PMC free article] [PubMed] [Google Scholar]
- 79. Yin K, Chen WJ, Zhou ZG, Zhao GJ, Lv YC, Ouyang XP, Yu XH, Fu Y, Jiang ZS, Tang CK. Apolipoprotein A‐I inhibits CD40 proinflammatory signaling via ATP‐binding cassette transporter A1‐mediated modulation of lipid raft in macrophages. J Atheroscler Thromb. 2012;19:823–836. [DOI] [PubMed] [Google Scholar]
- 80. Dong F, Mo Z, Eid W, Courtney KC, Zha X. AKT inhibition promotes ABCA1‐mediated cholesterol efflux to ApoA‐I through suppressing mTORC1. PLoS One. 2014;9:e113789. [DOI] [PMC free article] [PubMed] [Google Scholar]
- 81. Reboulleau A, Robert V, Vedie B, Doublet A, Grynberg A, Paul JL, Fournier N. Involvement of cholesterol efflux pathway in the control of cardiomyocytes cholesterol homeostasis. J Mol Cell Cardiol. 2012;53:196–205. [DOI] [PubMed] [Google Scholar]
- 82. Nofer JR. Signal transduction by HDL: agonists, receptors, and signaling cascades. Handb Exp Pharmacol. 2015;224:229–256. [DOI] [PubMed] [Google Scholar]
- 83. Bocchetta S, Maillard P, Yamamoto M, Gondeau C, Douam F, Lebreton S, Lagaye S, Pol S, Helle F, Plengpanich W, Guerin M, Bourgine M, Michel ML, Lavillette D, Roingeard P, le Goff W, Budkowska A. Up‐regulation of the ATP‐binding cassette transporter A1 inhibits hepatitis C virus infection. PLoS One. 2014;9:e92140. [DOI] [PMC free article] [PubMed] [Google Scholar]
- 84. Landry YD, Denis M, Nandi S, Bell S, Vaughan AM, Zha X. ATP‐binding cassette transporter A1 expression disrupts raft membrane microdomains through its ATPase‐related functions. J Biol Chem. 2006;281:36091–36101. [DOI] [PubMed] [Google Scholar]
- 85. Zarubica A, Plazzo AP, Stockl M, Trombik T, Hamon Y, Muller P, Pomorski T, Herrmann A, Chimini G. Functional implications of the influence of ABCA1 on lipid microenvironment at the plasma membrane: a biophysical study. FASEB J. 2009;23:1775–1785. [DOI] [PubMed] [Google Scholar]
- 86. Randolph GJ, Miller NE. Lymphatic transport of high‐density lipoproteins and chylomicrons. J Clin Invest. 2014;124:929–935. [DOI] [PMC free article] [PubMed] [Google Scholar]
- 87. Sorci‐Thomas MG, Thomas MJ. High density lipoprotein biogenesis, cholesterol efflux, and immune cell function. Arterioscler Thromb Vasc Biol. 2012;32:2561–2565. [DOI] [PMC free article] [PubMed] [Google Scholar]
- 88. Randolph GJ. Mechanisms that regulate macrophage burden in atherosclerosis. Circ Res. 2014;114:1757–1771. [DOI] [PMC free article] [PubMed] [Google Scholar]
- 89. Feig JE, Parathath S, Rong JX, Mick SL, Vengrenyuk Y, Grauer L, Young SG, Fisher EA. Reversal of hyperlipidemia with a genetic switch favorably affects the content and inflammatory state of macrophages in atherosclerotic plaques. Circulation. 2011;123:989–998. [DOI] [PMC free article] [PubMed] [Google Scholar]
- 90. Ly NP, Komatsuzaki K, Fraser IP, Tseng AA, Prodhan P, Moore KJ, Kinane TB. Netrin‐1 inhibits leukocyte migration in vitro and in vivo. Proc Natl Acad Sci USA. 2005;102:14729–14734. [DOI] [PMC free article] [PubMed] [Google Scholar]
- 91. van Gils JM, Derby MC, Fernandes LR, Ramkhelawon B, Ray TD, Rayner KJ, Parathath S, Distel E, Feig JL, Alvarez‐Leite JI, Rayner AJ, McDonald TO, O'Brien KD, Stuart LM, Fisher EA, Lacy‐Hulbert A, Moore KJ. The neuroimmune guidance cue netrin‐1 promotes atherosclerosis by inhibiting the emigration of macrophages from plaques. Nat Immunol. 2012;13:136–143. [DOI] [PMC free article] [PubMed] [Google Scholar]
- 92. Tassew NG, Mothe AJ, Shabanzadeh AP, Banerjee P, Koeberle PD, Bremner R, Tator CH, Monnier PP. Modifying lipid rafts promotes regeneration and functional recovery. Cell Rep. 2014;8:1146–1159. [DOI] [PubMed] [Google Scholar]
- 93. Moretti S, Procopio A, Lazzarini R, Rippo MR, Testa R, Marra M, Tamagnone L, Catalano A. Semaphorin3A signaling controls Fas (CD95)‐mediated apoptosis by promoting Fas translocation into lipid rafts. Blood. 2008;111:2290–2299. [DOI] [PubMed] [Google Scholar]
- 94. Salikhova A, Wang L, Lanahan AA, Liu M, Simons M, Leenders WP, Mukhopadhyay D, Horowitz A. Vascular endothelial growth factor and semaphorin induce neuropilin‐1 endocytosis via separate pathways. Circ Res. 2008;103:e71–e79. [DOI] [PMC free article] [PubMed] [Google Scholar]
- 95. Maisse C, Rossin A, Cahuzac N, Paradisi A, Klein C, Haillot ML, Herincs Z, Mehlen P, Hueber AO. Lipid raft localization and palmitoylation: identification of two requirements for cell death induction by the tumor suppressors UNC5H. Exp Cell Res. 2008;314:2544–2552. [DOI] [PubMed] [Google Scholar]
- 96. Tacke F, Alvarez D, Kaplan TJ, Jakubzick C, Spanbroek R, Llodra J, Garin A, Liu J, Mack M, van Rooijen N, Lira SA, Habenicht AJ, Randolph GJ. Monocyte subsets differentially employ CCR2, CCR5, and CX3CR1 to accumulate within atherosclerotic plaques. J Clin Invest. 2007;117:185–194. [DOI] [PMC free article] [PubMed] [Google Scholar]
- 97. Martel C, Li W, Fulp B, Platt AM, Gautier EL, Westerterp M, Bittman R, Tall AR, Chen SH, Thomas MJ, Kreisel D, Swartz MA, Sorci‐Thomas MG, Randolph GJ. Lymphatic vasculature mediates macrophage reverse cholesterol transport in mice. J Clin Invest. 2013;123:1571–1579. [DOI] [PMC free article] [PubMed] [Google Scholar]
- 98. Cuthbert JA, Lipsky PE. Provision of cholesterol to lymphocytes by high density and low density lipoproteins. Requirement for low density lipoprotein receptors. J Biol Chem. 1987;262:7808–7818. [PubMed] [Google Scholar]
- 99. Swirski FK, Nahrendorf M. Leukocyte behavior in atherosclerosis, myocardial infarction, and heart failure. Science. 2013;339:161–166. [DOI] [PMC free article] [PubMed] [Google Scholar]
- 100. Weber GF, Chousterman BG, He S, Fenn AM, Nairz M, Anzai A, Brenner T, Uhle F, Iwamoto Y, Robbins CS, Noiret L, Maier SL, Zonnchen T, Rahbari NN, Scholch S, Klotzsche‐von Ameln A, Chavakis T, Weitz J, Hofer S, Weigand MA, Nahrendorf M, Weissleder R, Swirski FK. Interleukin‐3 amplifies acute inflammation and is a potential therapeutic target in sepsis. Science. 2015;347:1260–1265. [DOI] [PMC free article] [PubMed] [Google Scholar]
- 101. Saulle E, Riccioni R, Coppola S, Parolini I, Diverio D, Riti V, Mariani G, Laufer S, Sargiacomo M, Testa U. Colocalization of the VEGF‐R2 and the common IL‐3/GM‐CSF receptor beta chain to lipid rafts leads to enhanced p38 activation. Br J Haematol. 2009;145:399–411. [DOI] [PubMed] [Google Scholar]
- 102. Pagler TA, Wang M, Mondal M, Murphy AJ, Westerterp M, Moore KJ, Maxfield FR, Tall AR. Deletion of ABCA1 and ABCG1 impairs macrophage migration because of increased Rac1 signaling. Circ Res. 2011;108:194–200. [DOI] [PMC free article] [PubMed] [Google Scholar]
Associated Data
This section collects any data citations, data availability statements, or supplementary materials included in this article.
Supplementary Materials
Figure S1. Subcutaneous injections of lipid‐free Apolipoprotein A‐I (apoA‐I) and plasma lipoprotein concentrations. Western diet–fed Ldlr −/− mice were subcutaneously injected with either 200 μg of lipid‐free human apoA‐I or bovine serum albumin every other day. Data show the concentration of human apoA‐I in mouse plasma at each of the indicated times over a 48‐hour period following injection of lipid‐free human apoA‐I. Asterisks show significant differences at P<0.05 from time=0 after apoA‐I was injected. Data shown are the mean±SD of 5 mice.
Figure S2. Esterified cholesterol/total cholesterol (EC/TC) ratio in human peripheral blood mononuclear cells (PBMCs) shows an inverse correlation with high‐density lipoprotein (HDL) cholesterol concentration. PBMCs from 56 participants as part of the Take Off Pounds Sensibly (TOPS Club, Inc) were assayed for their EC/TC and correlated with each individual's HDL cholesterol concentration. Linear regression analysis of the EC/TC ratio versus HDL cholesterol concentration gave r=−0.432 with P=0.0093 for 56 participants.
Figure S3. Apolipoprotein A‐I (ApoA‐I) treatment modulates the esterified cholesterol/total cholesterol (EC/TC) ratio in mouse artery cells. Western diet–fed Ldlr −/− mice were subcutaneously injected with either 200 μg of lipid‐free human apoA‐I or bovine serum albumin every other day. Arterial explants were cleaned and digested, as described in the Methods section, and then the EC/TC ratio was determined by mass spectrometry. Data show mean±SD from 3 to 5 mice.