

Abstract
Background
Low body mass index (BMI) and serum creatinine are surrogate markers of frailty and sarcopenia. Their relationship with cause‐specific mortality in elderly patients undergoing percutaneous coronary intervention is not well studied.
Methods and Results
We determined long‐term cardiovascular and noncardiovascular mortality in 9394 consecutive patients aged ≥65 years who underwent percutaneous coronary intervention from 2000 to 2011. BMI and serum creatinine were divided into 4 categories. During a median follow‐up of 4.2 years (interquartile range 1.8–7.3 years), 3243 patients (33.4%) died. In the multivariable model, compared with patients with normal BMI, patients with low BMI had significantly increased all‐cause mortality (hazard ratio [HR] 1.4, 95% CI 1.1–1.7), which was related to both cardiovascular causes (HR 1.4, 95% CI 1.0–1.8) and noncardiovascular causes (HR 1.4, 95% CI 1.06–1.9). Compared with normal BMI, significant reduction was noted in patients who were overweight and obese in terms of cardiovascular mortality (overweight: HR 0.77, 95% CI 0.67–0.88; obese: HR 0.80, 95% CI 0.70–0.93) and noncardiovascular mortality (overweight: HR 0.85, 95% CI 0.74–0.97; obese: HR 0.82, 95% CI 0.72–0.95). In a multivariable model, in patients with normal BMI, low creatinine (≤0.70 mg/dL) was significantly associated with increased all‐cause mortality (HR 1.8, 95% CI 1.3–2.5) and cardiovascular mortality (HR 2.3, 95% CI 1.4–3.8) compared with patients with normal creatinine (0.71–1.0 mg/dL); however, this was not observed in other BMI categories.
Conclusions
We identified a new subgroup of patients with low serum creatinine and normal BMI that was associated with increased all‐cause mortality and cardiovascular mortality in elderly patients undergoing percutaneous coronary intervention. Low BMI was associated with increased cardiovascular and noncardiovascular mortality. Nutritional support, resistance training, and weight‐gain strategies may have potential roles for these patients undergoing percutaneous coronary intervention.
Keywords: body mass index, cause of death, creatinine, frailty, percutaneous coronary intervention
Subject Categories: Percutaneous Coronary Intervention, Mortality/Survival, Obesity
Introduction
More than 250 000 adults aged >65 years underwent percutaneous coronary intervention (PCI) in the United States in 2010.1 Because this number is expected to increase with the changing demographics, it is important to ascertain the factors related to cause of death in patients undergoing high‐risk procedures. Sarcopenia, which is age‐related decline in skeletal muscle mass,2 and frailty, which is a biological syndrome of decreased reserve and resistance to stressors,3 are associated with adverse outcomes in older adults.4
Both low body mass index (BMI; in kg/m2) and low serum creatinine are surrogate markers of frailty and sarcopenia in older adults.4, 5, 6, 7 No study, to our knowledge, has explored their combined association with cause‐specific mortality in elderly patients with coronary artery disease (CAD). The inverse association of BMI and all‐cause mortality in patients with CAD8 and those undergoing PCI9, 10 has been recognized as the “obesity paradox.” Low serum creatinine has been noted to be associated with higher all‐cause mortality in critically ill patients11; however, prior studies in these patients have either excluded or included few patients with low BMI (<20 kg/m2) and with low creatinine (<0.7 mg/dL).9, 10
A possible explanation for the nonlinear relationship of BMI and serum creatinine to mortality is higher prevalence of sarcopenia, frailty, and other comorbidities in elderly patients. Consequently, we explored the association of low serum creatinine and BMI with cause‐specific mortality and cardiovascular outcomes in elderly patients undergoing PCI.
Methods
Patient Population
The Mayo Clinic PCI registry contains prospectively collected data since 1979 on all patients undergoing PCI at the Mayo Clinic in Rochester, Minnesota.12 For the present study, we included consecutive patients aged ≥65 years who underwent PCI at the Mayo Clinic in Rochester from January 1, 2000, to December 31, 2011, and had serum creatinine level available within 1 month prior to PCI. If patients had >1 PCI during the study period at our institution, only the first PCI was used. All participants gave consent to use their medical records for research purposes. Of the 10 399 patients aged ≥65 years that had PCI during the study time frame, 1005 patients were excluded because of unavailable serum creatinine levels, leaving 9394 for the current study. Demographic, clinical, angiographic, procedural, and medication data available in the data registry were assessed for all patients, as described previously.12 The study was approved by the Mayo Clinic institutional review board.
Definitions
The patient population was divided into 4 groups according to serum creatinine levels: low (≤0.7 mg/dL), normal (0.71–1.0 mg/dL), high (1.01–1.4 mg/dL), and very high (>1.4 mg/dL). BMI categories were defined as low (<20 kg/m2), normal (20–25 kg/m2), overweight (25–30 kg/m2), and obese (>30 kg/m2).
Outcomes
The primary outcome was all‐cause mortality classified into cardiovascular and noncardiovascular deaths. Cardiovascular deaths included causes that were cardiac (myocardial infarction [MI], sudden cardiac death, congestive heart failure or structural heart disease, interventional or surgical procedure related, and other cardiac) and vascular (hemorrhagic stroke, ischemic or undefined stroke, abdominal aortic aneurysm rupture, and other vascular). Noncardiovascular deaths were from cancer (solid organ, hematologic), infection, chronic diseases (neurological, pulmonary, renal failure, liver or multiorgan failure, natural causes), hemorrhage (gastrointestinal, other), pulmonary embolus, iatrogenic causes (noncardiac procedure or surgery related), trauma (accident or trauma, suicide), acute surgical noncardiac causes, and other noncardiac causes. The details of the classification of mortality and ascertainment of deaths were described previously.13 Secondary outcomes included in the study were MI and target vessel revascularization (TVR), as defined previously.14 The composite end point for long‐term outcomes was all‐cause mortality or MI or TVR. Postdischarge follow‐up was obtained by a centralized telephone interview conducted by an experienced data technician 6 and 12 months after the index procedure and annually thereafter. The details of the follow‐up have been mentioned previously.14
Statistical Analysis
Continuous variables were summarized as mean (standard deviation), and categorical variables were summarized as frequencies (percentages). Differences in clinical and angiographic characteristics between the 4 creatinine and BMI groups were compared using 1‐way ANOVA for continuous variables, the Kruskal–Wallis test for ordinal variables, and the Pearson chi‐square test for categorical variables. The Spearman correlation coefficient was used to assess the relationship between serum creatinine and BMI. Long‐term follow‐up started after discharge for participants who survived to discharge. Only 2.6% of these participants had <30 days of follow‐up and were treated as censored on the last day that vital status was available. Unadjusted competing risk plots were made for cardiovascular and noncardiovascular mortality by serum creatinine and BMI groups. Cox proportional hazards models were used to estimate the association of BMI and creatinine groups with all‐cause mortality, cardiovascular mortality, noncardiovascular mortality, recurrent MI, TVR, and the composite end point. These models were adjusted for age; sex; BMI group; diabetes mellitus; hypertension; smoking; history of MI; peripheral vascular disease; cerebrovascular accident; chronic obstructive pulmonary disease; congestive heart failure; hypercholesterolemia; Canadian heart class; unstable angina; history of tumor, lymphoma, or leukemia; metastatic cancer; prior PCI; prior coronary artery bypass grafting; ejection fraction; pre‐PCI shock; use of intra‐aortic balloon pump; presence of thrombus; type C lesions; use of drug‐eluting stents; and number of diseased vessels. Sensitivity analysis after including the procedure date in our Cox model changed the parameter estimates by <0.025, so time variable was not included in the final models. Missing values were imputed using the median values for continuous variables and the most common value for binary variables. Because all imputed variables had <4% missing values except for number of diseased vessels (7%), thrombus in any lesion (6%), congestive heart failure (6%), history of cholesterol (5%), and type C lesion (5%), simple imputation was used instead of multiple imputation.15 All models were fit with and without an interaction term between creatinine group and BMI group. All tests were 2‐sided, and P<0.05 was considered statistically significant. SAS version 9.3 or higher (SAS Institute) was used for all analyses.
Results
Descriptive Characteristics
The mean age of the study population was 75.7±6.6 years, and 66% were male (n=6217). Mean BMI was 29.3±5.4. Table 1 summarizes the clinical and angiographic characteristics stratified by the 4 groups of serum creatinine. Mean BMI in the patients with low serum creatinine was significantly lower than other groups (P<0.001); however, the correlation between BMI and creatinine was very weak (r=0.065; P<0.001). Patients with low serum creatinine were also younger, more frequently women, and current smokers and presented more frequently with MI compared with patients with very high serum creatinine. Traditional cardiovascular risk factors were less prevalent in patients with low serum creatinine compared with patients with high serum creatinine. History of tumor, lymphoma, or leukemia was similar in patients with low and higher creatinine levels. Angiographic characteristics such as presence of thrombus and bifurcation lesions were significantly more common in patients with low serum creatinine. Patients with low creatinine levels had a significantly higher frequency of emergency PCI (P=0.02), use of drug‐eluting stents (P<0.001), and glycoprotein IIb/IIIa inhibitors (P<0.001) compared with other creatinine groups.
Table 1.
Clinical and Angiographic Characteristics Stratified by Serum Creatinine
| Variable | Serum Creatinine, mg/dL | P Value | |||
|---|---|---|---|---|---|
| ≤0.7 (n=498) | 0.71–1.0 (n=2923) | 1.01–1.4 (n=4302) | >1.4 (n=1669) | ||
| Demographics and risk factors | |||||
| Age, y, mean (SD) | 75.3 (6.6) | 74.9 (6.3) | 75.8 (6.6) | 77.2 (6.7) | <0.001 |
| Male, n (%) | 116 (23) | 1575 (54) | 3230 (75) | 1295 (78) | <0.001 |
| BMI, mean (SD) | 28.7 (6.1) | 29.0 (5.5) | 29.4 (5.2) | 29.9 (5.7) | <0.001 |
| MI <24 hours, n (%) | 108 (22) | 508 (18) | 654 (15) | 243 (15) | <0.001 |
| Preprocedural shock, n (%) | 14 (3) | 63 (2) | 159 (4) | 102 (6) | <0.001 |
| Canadian Heart Class (III, IV, V), n (%) | 259 (52) | 1649 (56) | 2365 (55) | 877 (53) | 0.044 |
| Current CHF status, n (%) | 68 (14) | 316 (11) | 698 (17) | 566 (36) | <0.001 |
| Diabetes mellitus, n (%) | 145 (29) | 740 (25) | 1235 (29) | 703 (42) | <0.001 |
| Hypertension, n (%) | 412 (85) | 2323 (82) | 3472 (83) | 1485 (91) | <0.001 |
| History of cholesterol ≥240 mg/dL, n (%) | 379 (81) | 2413 (87) | 3524 (87) | 1368 (87) | 0.002 |
| Current smokers, n (%) | 53 (11) | 226 (8) | 224 (5) | 80 (5) | <0.001 |
| Prior PTCA, n (%) | 155 (31) | 1027 (35) | 1723 (40) | 700 (42) | <0.001 |
| Prior CABG, n (%) | 67 (13) | 699 (24) | 1321 (31) | 647 (39) | <0.001 |
| Peripheral vascular disease, n (%) | 54 (11) | 315 (11) | 610 (15) | 462 (28) | <0.001 |
| CVA/TIA, n (%) | 56 (11) | 414 (14) | 669 (16) | 377 (23) | <0.001 |
| Moderate or severe renal disease, n (%) | 1 (0) | 12 (0) | 65 (2) | 321 (20) | <0.001 |
| COPD, n (%) | 82 (16) | 357 (12) | 584 (14) | 339 (21) | <0.001 |
| Peptic ulcer disease, n (%) | 42 (8) | 213 (7) | 306 (7) | 144 (9) | 0.19 |
| Tumor, lymphoma, or leukemia, n (%) | 90 (18) | 504 (17) | 772 (18) | 312 (19) | 0.66 |
| Metastatic cancer, n (%) | 8 (2) | 24 (1) | 65 (2) | 27 (2) | 0.041 |
| Cardiac arrest before procedure, n (%) | 1 (0) | 5 (0) | 5 (0) | 2 (0) | 0.91 |
| LVEF ≤40%, n (%) | 37 (7) | 298 (10) | 556 (13) | 326 (20) | <0.001 |
| Procedural characteristics | |||||
| Multivessel disease, n (%) | 291 (62) | 1859 (67) | 2884 (71) | 1167 (74) | <0.001 |
| Type C lesion, n (%) | 241 (51) | 1420 (51) | 2096 (51) | 912 (58) | <0.001 |
| Thrombus, n (%) | 138 (29) | 671 (24) | 925 (23) | 339 (22) | 0.009 |
| Bifurcation in any lesion, n (%) | 98 (21) | 521 (19) | 672 (17) | 246 (16) | 0.006 |
| TIMI flow 0–1 before procedure, n (%) | 90 (21) | 435 (18) | 606 (18) | 216 (17) | 0.30 |
| PCI, n (%) | 0.023 | ||||
| Elective | 166 (33) | 1035 (35) | 1563 (36) | 548 (33) | |
| Urgent | 236 (47) | 1431 (49) | 2093 (49) | 844 (51) | |
| Emergency | 96 (19) | 457 (16) | 645 (15) | 275 (16) | |
| Use of drug‐eluting stents, n (%) | 318 (64) | 1693 (58) | 2053 (48) | 739 (44) | <0.001 |
| TIMI 3 after procedure in all lesions, n (%) | 457 (94) | 2679 (96) | 3877 (94) | 1495 (94) | 0.07 |
| Prophylactic intra‐aortic balloon pump, n (%) | 11 (2) | 49 (2) | 80 (2) | 37 (2) | 0.58 |
| GP IIb/IIIa use, n (%) | 306 (61) | 1662 (57) | 2335 (54) | 795 (48) | <0.001 |
| Discharge medications | |||||
| Aspirin, n (%) | 476 (97) | 2822 (97) | 4076 (95) | 1542 (94) | 0.001 |
| Beta blocker, n (%) | 426 (86) | 2481 (85) | 3555 (83) | 1352 (83) | 0.14 |
| Calcium channel blocker, n (%) | 101 (20) | 542 (19) | 769 (18) | 438 (27) | <0.001 |
| Lipid‐lowering agent, n (%) | 139 (28) | 1314 (45) | 2437 (57) | 916 (56) | <0.001 |
| Clopidogrel, n (%) | 471 (95) | 2795 (96) | 4043 (94) | 1527 (92) | <0.001 |
| In‐hospital outcomes | |||||
| In‐hospital death, n (%) | 9 (2) | 28 (1) | 69 (2) | 61 (4) | <0.001 |
| In‐hospital any MI, n (%) | 20 (4) | 123 (4) | 219 (5) | 99 (6) | 0.047 |
The following variables had <2% missing: moderate or severe renal disease; history of MI; MI <24 hours; tumor, lymphoma, or leukemia; cardiac arrest preprocedure; body mass index; use of drug‐eluting stents; diabetes mellitus; GP IIb/IIIa use; metastatic cancer; multivessel disease; prior CABG; preprocedural shock; PCI (elective, urgent, or emergency); aspirin; beta blocker; calcium channel blocker; lipid‐lowering agent; and clopidogrel. The following variables had other percentages missing: current CHF status, 5.4%; COPD, 2.1%; CVA/TIA, 2.1%; history of cholesterol ≥240 mg/dL, 5.5%; hypertension, 2.7%; peptic ulcer disease, 2.9%; peripheral vascular disease, 2.5%; current smokers, 2.7%; TIMI 3 after procedure, 4.5%. All other variables did not have any missing data. BMI indicates body mass index; CABG, coronary artery bypass surgery; CHF, congestive heart failure; COPD, chronic obstructive pulmonary disease; CVA, cerebrovascular accident; GP, glycoprotein; LVEF, left ventricular ejection fraction; MI, myocardial infarction; PCI, percutaneous coronary intervention; PTCA, percutaneous transluminal coronary angioplasty; TIA, transient ischemic attack; TIMI, Thrombolysis in Myocardial Infarction.
The number of patients in various BMI categories was as follows: <20 kg/m2, n=193; 20 to 25 kg/m2, n=1775; 25.1 to 30.0 kg/m2, n=3644; >30 kg/m2, n=3754. Patients with low BMI were significantly older; were more often female; had higher incidence of preprocedural shock, history of cerebrovascular accident or transient ischemic attack, chronic obstructive pulmonary disease, or tumor, lymphoma, or leukemia; and had higher use of prophylactic intra‐aortic balloon pump (Table 2).
Table 2.
Clinical and Angiographic Characteristics Stratified by BMI
| Variable | BMI, kg/m2 | P Value | |||
|---|---|---|---|---|---|
| <20 (n=193) | 20–25 (n=1775) | 25–30 (n=3644) | >30 (n=3754) | ||
| Demographics and risk factors | |||||
| Age, y, mean (SD) | 79.5 (7.8) | 77.7 (7.0) | 75.9 (6.5) | 74.4 (6.1) | <0.001 |
| Male, n (%) | 68 (35) | 1001 (56) | 2650 (73) | 2483 (66) | <0.001 |
| BMI, mean (SD) | 18.7 (1.1) | 23.2 (1.3) | 27.5 (1.4) | 34.5 (4.2) | <0.001 |
| MI <24 hours, n (%) | 45 (24) | 376 (21) | 574 (16) | 505 (14) | <0.001 |
| Preprocedural shock, n (%) | 14 (7) | 98 (6) | 129 (4) | 92 (2) | <0.001 |
| Canadian Heart Class (III, IV, V), n (%) | 95 (49) | 894 (50) | 1975 (54) | 2178 (58) | <0.001 |
| Diabetes mellitus, n (%) | 26 (13) | 321 (18) | 866 (24) | 1603 (43) | <0.001 |
| Hypertension, n (%) | 157 (83) | 1338 (78) | 2889 (81) | 3287 (90) | <0.001 |
| History of cholesterol ≥240, n (%) | 131 (73) | 1356 (82) | 2963 (87) | 3218 (90) | <0.001 |
| Current smokers, n (%) | 29 (15) | 158 (9) | 220 (6) | 172 (5) | 0.008 |
| History of MI (>7 days), n (%) | 69 (37) | 575 (33) | 1206 (34) | 1333 (36) | 0.034 |
| Prior PTCA, n (%) | 59 (31) | 602 (34) | 1387 (38) | 1545 (41) | <0.001 |
| Prior CABG, n (%) | 33 (17) | 455 (26) | 1091 (30) | 1148 (31) | <0.001 |
| Peripheral vascular disease, n (%) | 42 (22) | 278 (16) | 534 (15) | 579 (16) | 0.08 |
| CVA/TIA, n (%) | 52 (27) | 291 (17) | 602 (17) | 570 (15) | <0.001 |
| Moderate or severe renal disease, n (%) | 14 (7) | 81 (5) | 145 (4) | 158 (4) | 0.15 |
| COPD, n (%) | 50 (26) | 280 (16) | 494 (14) | 532 (15) | <0.001 |
| Peptic ulcer disease, n (%) | 23 (12) | 129 (8) | 273 (8) | 278 (8) | 0.17 |
| Tumor, lymphoma, or leukemia, n (%) | 39 (20) | 342 (20) | 672 (19) | 620 (17) | 0.028 |
| Metastatic cancer, n (%) | 3 (2) | 26 (1) | 49 (1) | 44 (1) | 0.80 |
| Cardiac arrest before procedure, n (%) | 0 (0) | 5 (0) | 5 (0) | 3 (0) | 0.28 |
| LVEF ≤40%, n (%) | 41 (21) | 280 (16) | 465 (13) | 425 (11) | <0.001 |
| Procedural characteristics | |||||
| Multivessel disease, n (%) | 127 (71) | 1189 (71) | 2400 (69) | 2467 (70) | 0.83 |
| Type C lesion, n (%) | 100 (56) | 893 (54) | 1808 (52) | 1852 (52) | 0.41 |
| Thrombus, n (%) | 49 (28) | 455 (27) | 790 (23) | 768 (22) | <0.001 |
| TIMI 0–1 before procedure in any lesion, n (%) | 35 (23) | 297 (21) | 504 (18) | 500 (17) | 0.002 |
| PCI, n (%) | <0.001 | ||||
| Elective | 50 (26) | 553 (31) | 1323 (36) | 1378 (37) | |
| Urgent | 96 (50) | 849 (48) | 1767 (49) | 1890 (50) | |
| Emergency | 47 (24) | 373 (21) | 552 (15) | 485 (13) | |
| Use of drug‐eluting stents, n (%) | 88 (46) | 837 (47) | 1857 (51) | 2009 (54) | <0.001 |
| TIMI 3 after procedure in all lesions, n (%) | 175 (96) | 1604 (95) | 3334 (95) | 3376 (94) | 0.07 |
| Prophylactic intra‐aortic balloon pump, n (%) | 8 (4) | 48 (3) | 65 (2) | 54 (1) | 0.001 |
| Discharge medications | |||||
| Aspirin at discharge, n (%) | 179 (95) | 1658 (95) | 3456 (95) | 3601 (97) | 0.08 |
| Beta blocker at discharge, n (%) | 160 (85) | 1422 (81) | 3023 (83) | 3186 (85) | 0.006 |
| Lipid lowering agent at discharge, n (%) | 77 (41) | 859 (49) | 1931 (53) | 1932 (52) | 0.002 |
| Clopidogrel at discharge n (%) | 180 (93) | 1649 (93) | 3440 (94) | 3545 (94) | 0.30 |
| In‐hospital outcomes | |||||
| In‐hospital death, n (%) | 7 (4) | 50 (3) | 58 (2) | 50 (1) | <0.001 |
| In‐hospital any MI, n (%) | 13 (7) | 101 (6) | 169 (5) | 177 (5) | 0.21 |
BMI indicates body mass index; CABG, coronary artery bypass grafting; COPD, chronic obstructive pulmonary disease; CVA, cerebrovascular accident; LVEF, left ventricular ejection fraction; MI, myocardial infarction; PCI, percutaneous coronary intervention; PTCA, percutaneous transluminal coronary angioplasty; TIA, transient ischemic attack; TIMI, Thrombolysis in Myocardial Infarction.
In‐Hospital Outcomes
The rate of in‐hospital death was 4%, 3%, 2%, and 1% in patients with low, normal, overweight, and obese BMI, respectively (P<0.001). There was no difference in the rate of in‐hospital MI between these groups (P=0.21) (Table 2).
The rate of in‐hospital death was 2%, 1%, 2%, and 4% in patients with serum creatinine of ≤0.7, 0.7 to 1.0, 1.01 to 1.4, and >1.4 mg/dL, respectively (P<0.001). The rate of in‐hospital MI was 4%, 4%, 5%, and 6%, respective to the 4 creatinine groups (P=0.047) (Table 1).
Long‐Term Outcomes
During a median follow‐up of 4.2 years (interquartile range 1.8–7.3 years), 3243 deaths (1510 cardiovascular deaths, 1631 noncardiovascular deaths), 1229 recurrent MIs, 1416 TVRs, and 4464 composite events of death, MI, or TVR occurred. In the multivariable adjusted model, low BMI was associated with a significantly increased risk of all‐cause mortality (hazard ratio [HR] 1.37, 95% CI 1.12–1.68) compared with those with normal BMI (Figure 1), which was due to both increased cardiovascular mortality (HR 1.35, 95% CI 1.01–1.80) and noncardiovascular mortality (HR 1.42, 95% CI 1.06–1.89). The composite end point of death, MI, or TVR was also significantly increased in patients with low BMI (HR 1.28, 95% CI 1.06–1.55). Compared with normal BMI, overweight or obese BMI (>25) was associated with a ≈20% reduction in cardiovascular mortality, a 15% reduction in noncardiovascular mortality, and a 15% reduction in the composite end point (Table 3).
Figure 1.
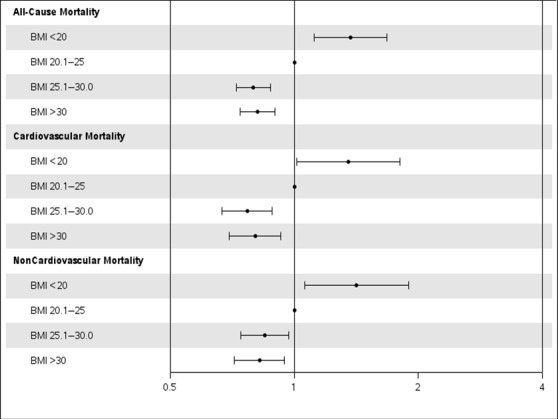
Adjusted association of BMI with cause‐specific mortality in elderly patients undergoing PCI. The gray line corresponds to a hazard ratio of 1. Hazard ratios (circles) and 95% CIs (error bars) are shown after adjusting for age; sex; BMI; diabetes mellitus; hypertension; smoking; history of myocardial infarction; peripheral vascular disease; cerebrovascular accident; chronic obstructive pulmonary disease; congestive heart failure; hypercholesterolemia; Canadian heart class; unstable angina; history of tumor, lymphoma, or leukemia; metastatic cancer; prior PCI; prior coronary artery bypass grafting; ejection fraction; pre‐PCI shock; use of intra‐aortic balloon pump; presence of thrombus; type C lesions; use of drug‐eluting stents; and number of diseased vessels. BMI indicates body mass index; PCI, percutaneous coronary intervention.
Table 3.
Adjusted Multivariable Analysis for Long‐Term Outcomes
| Outcomes | BMI | P Value | |||
|---|---|---|---|---|---|
| <20 (n=193) | 20–25 (n=1775) | 25–30 (n=3644) | >30 (n=3754) | ||
| Serum Creatinine | |||||
| ≤0.7 | 0.71–1.0 | 1.01–1.4 | >1.4 | ||
| All‐cause mortality | 1.37 (1.12–1.68) | Reference | 0.80 (0.72–0.87) | 0.82 (0.74–0.90) | <0.001 |
| Cardiovascular mortality | 1.35 (1.01–1.80) | Reference | 0.77 (0.67–0.88) | 0.80 (0.70–0.93) | <0.001 |
| Noncardiovascular mortality | 1.42 (1.06–1.89) | Reference | 0.85 (0.74–0.97) | 0.82 (0.72–0.95) | <0.001 |
| Recurrent MI | 1.56 (1.06–2.30) | Reference | 1.03 (0.87–1.22) | 0.95 (0.80–1.13) | 0.071 |
| TVR | 0.75 (0.44–1.26) | Reference | 0.98 (0.84–1.14) | 0.90 (0.77–1.06) | 0.36 |
| Composite end point (death/MI/TVR) | 1.28 (1.06–1.55) | Reference | 0.87 (0.80–0.94) | 0.84 (0.77–0.91) | <0.001 |
| All‐cause mortality | 1.09 (0.88–1.35) | Reference | 1.19 (1.09–1.31) | 1.78 (1.60–1.98) | <0.001 |
| Cardiovascular mortality | 1.17 (0.83–1.64) | Reference | 1.44 (1.24–1.66) | 1.97 (1.68–2.32) | <0.001 |
| Noncardiovascular mortality | 1.01 (0.76–1.35) | Reference | 1.02 (0.90–1.16) | 1.72 (1.49–1.99) | <0.001 |
| Recurrent MI | 0.97 (0.69–1.36) | Reference | 1.18 (1.03–1.37) | 1.33 (1.12–1.59) | 0.010 |
| TVR | 1.26 (0.96–1.67) | Reference | 1.19 (1.05–1.36) | 1.03 (0.87–1.23) | 0.018 |
| Composite end point (death/MI/CABG/TVR) | 1.15 (0.98–1.37) | Reference | 1.19 (1.10–1.28) | 1.54 (1.40–1.68) | <0.001 |
BMI was measured as kg/m2, and serum creatinine was measured as mg/dL. Results are presented as hazard ratio (95% CI). BMI indicates body mass index; CABG, coronary artery bypass grafting; MI, myocardial infarction; TVR, target vessel revascularization.
Low serum creatinine was not associated with increased risk of outcomes compared with normal serum creatinine (Figure 2). Groups with high and very high serum creatinine were associated with worse outcomes compared with normal serum creatinine (Table 3).
Figure 2.
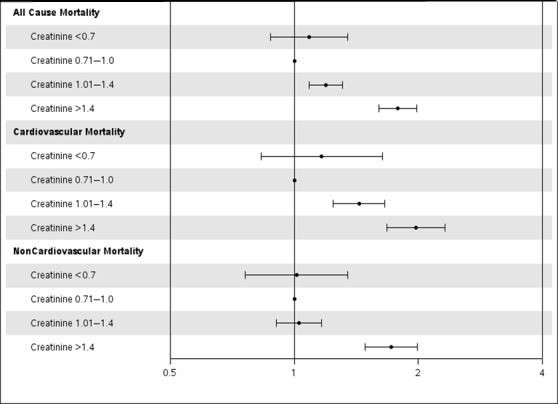
Adjusted association of serum creatinine with cause‐specific mortality in elderly patients undergoing PCI. The gray line corresponds to a hazard ratio of 1. Hazard ratios (circles) and 95% CIs (error bars) are shown after adjusting for age; sex; body mass index; diabetes mellitus; hypertension; smoking; history of myocardial infarction; peripheral vascular disease; cerebrovascular accident; chronic obstructive pulmonary disease; congestive heart failure; hypercholesterolemia; Canadian heart class; unstable angina; history of tumor, lymphoma, or leukemia; metastatic cancer; prior PCI; prior coronary artery bypass grafting; ejection fraction; pre‐PCI shock; use of intra‐aortic balloon pump; presence of thrombus; type C lesions; use of drug‐eluting stents; and number of diseased vessels. PCI indicates percutaneous coronary intervention.
Stratified Analysis
A significant interaction was noted between creatinine and BMI for all‐cause mortality and cardiovascular mortality (P=0.013); however, there was nonsignificant evidence of an interaction for noncardiovascular mortality (P=0.076). Table 3 summarizes the association of creatinine groups with outcomes stratified by low, normal, overweight, and obese BMI groups. In patients with normal BMI, low creatinine was significantly associated with increased all‐cause mortality (HR 1.80, 95% CI 1.28–2.52) and cardiovascular mortality (HR 2.29, 95% CI 1.37–3.83) compared with normal creatinine (Figure 3). There was no significant association between low creatinine and noncardiovascular mortality (HR 1.35, 95% CI 0.84–2.19) in patients with normal BMI. High creatinine was significantly associated with worse outcomes in all BMI groups except those with BMI <20 kg/m2. In patients with BMI <20 kg/m2, no significant association was noted between serum creatinine and cause of death, possibly secondary to a small sample size and reduced power (Table 4).
Figure 3.
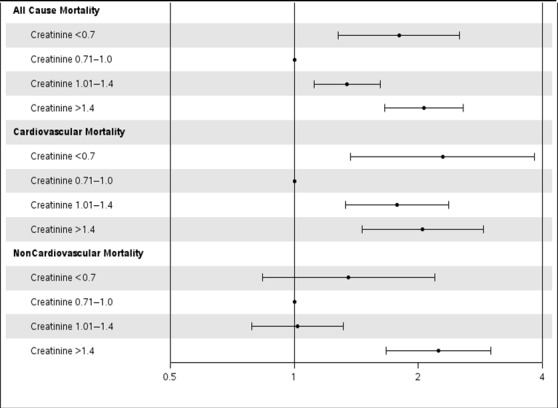
Adjusted association of serum creatinine with cause‐specific mortality in patients with normal BMI. The gray line corresponds to a hazard ratio of 1. Hazard ratios (circles) and 95% CIs (error bars) are shown after adjusting for age; sex; BMI; diabetes mellitus; hypertension; smoking; history of myocardial infarction; peripheral vascular disease; cerebrovascular accident; chronic obstructive pulmonary disease; congestive heart failure; hypercholesterolemia; Canadian heart class; unstable angina; history of tumor, lymphoma, or leukemia; metastatic cancer; prior PCI; prior coronary artery bypass grafting; ejection fraction; pre‐PCI shock; use of intra‐aortic balloon pump; presence of thrombus; type C lesions; use of drug‐eluting stents; and number of diseased vessels. BMI indicates body mass index; PCI, percutaneous coronary intervention.
Table 4.
Association Between Serum Creatinine and Long‐Term Outcomes Within BMI Strata
| Outcomes | Serum Creatinine | |||
|---|---|---|---|---|
| ≤0.7 | 0.71–1.0 | 1.01–1.4 | ≥1.4 | |
| BMI <20 | n=18 | n=76 | n=64 | n=35 |
| All‐cause mortality | 1.05 (0.52–2.13) | Reference | 0.75 (0.47–1.19) | 1.32 (0.80–2.16) |
| Cardiovascular mortality | 0.90 (0.26–3.13) | Reference | 0.98 (0.51–1.89) | 1.14 (0.54–2.39) |
| Noncardiovascular mortality | 1.15 (0.50–2.73) | Reference | 0.52 (0.25–1.05) | 1.46 (0.74–2.88) |
| BMI 20–25 | n=128 | n=631 | n=755 | n=261 |
| All‐cause mortality | 1.80 (1.28–2.52) | Reference | 1.34 (1.12–1.62) | 2.07 (1.66–2.57) |
| Cardiovascular mortality | 2.29 (1.37–3.83) | Reference | 1.77 (1.33–2.37) | 2.05 (1.46–2.88) |
| Noncardiovascular mortality | 1.35 (0.84–2.19) | Reference | 1.02 (0.79–1.31) | 2.24 (1.67–3.00) |
| BMI 25.1–30 | n=165 | n=1094 | n=1721 | n=664 |
| All‐cause mortality | 0.84 (0.57–1.25) | Reference | 1.06 (0.91–1.23) | 1.43 (1.21–1.69) |
| Cardiovascular mortality | 0.76 (0.39–1.45) | Reference | 1.18 (0.94–1.49) | 1.54 (1.20–1.98) |
| Noncardiovascular mortality | 0.91 (0.55–1.49) | Reference | 0.98 (0.80–1.20) | 1.42 (1.13–1.79) |
| BMI ≥30 | n=181 | n=1114 | n=1752 | n=706 |
| All‐cause mortality | 0.70 (0.43–1.15) | Reference | 1.29 (1.10–1.50) | 2.07 (1.75–2.45) |
| Cardiovascular mortality | 0.76 (0.35–1.65) | Reference | 1.57 (1.23–2.01) | 2.50 (1.93–3.24) |
| Noncardiovascular mortality | 0.70 (0.37–1.33) | Reference | 1.11 (0.90–1.37) | 1.86 (1.47–2.35) |
Serum creatinine was measured as mg/dL. Results are presented as hazard ratio (95% CI). BMI indicates body mass index.
Discussion
The major findings of this study were: 1), In elderly patients undergoing PCI, low BMI was associated with increased long‐term cardiovascular and noncardiovascular mortality, whereas overweight and obesity BMIs were associated with reduced cardiovascular and noncardiovascular mortality, demonstrating a J‐shaped curve. Second, in patients with normal BMI, low serum creatinine was associated with increased long‐term cardiovascular mortality. Third, high creatinine was associated with increased mortality and cardiovascular events.
It is expected that by 2030, every fifth person in the United States will be aged >65 years and represents the fastest growing demographic group. We and others have demonstrated a shift in the burden of CAD toward older persons in the past 2 decades, and during the same period, novel therapeutic approaches have improved their survival. These 2 concomitant forces—displacement of the burden of disease toward older persons and improved survival—led to a fundamental change in the epidemiology of CAD, and survivors are now older persons with substantial comorbidity that presents enormous societal and economic challenges. Consequently, prognostic determination of surrogate variables linked to aging such as low BMI and serum creatinine becomes important.3 Previous studies were limited by the number of elderly patients with low BMI and serum creatinine10 and did not have details of cause of death.16 The present study is one of the largest studies including elderly patients who underwent PCI with an adequate number of patients with low BMI and/or low serum creatinine.
BMI and Outcomes
A meta‐analysis of 10 studies in patients undergoing PCI reported that low BMI (<20 kg/m2) was associated with increased total and cardiac mortality compared with those with normal BMI.17 Another study including 23 604 participants pooled from 11 PCI clinical studies reported that low BMI (<18.5) was associated with a significantly increased risk of all‐cause mortality.16 A recent study of elderly patients with acute MI also found that low BMI was associated with increased long‐term mortality after adjusting for markers of cachexia, frailty, and nutritional status.18 None of these studies, however, had detailed assessment of noncardiovascular mortality, and some of them assumed that mortality after PCI was from cardiovascular causes only.16 Because of the availability of cause‐specific mortality in our database, we found that increased all‐cause mortality in patients with low BMI was not only secondary to cardiovascular causes but also for noncardiovascular reasons. A higher prevalence of smoking, chronic lung disease, and leukemia or lymphoma and other unrecognized factors such as frailty, disability, poor nutritional intake, and sarcopenia4, 5, 18 may account for the increased risk of noncardiovascular death in patients with low BMI. This finding is similar to the general population of the United States in the National Health and Nutrition Examination Survey (NHANES) database, for which low BMI was associated with increased noncardiovascular mortality primarily from noncancerous etiologies like chronic respiratory diseases, infectious diseases, or injuries.19 Patients with low BMI had >50% higher relative risk of recurrent MI compared with those with normal BMI, translating into increased cardiovascular mortality. These patients had a higher frequency of pre‐PCI shock, intra‐aortic balloon pump use, low ejection fraction at presentation, and left anterior descending artery obstruction, placing them at a higher risk of recurrent cardiovascular events during follow‐up. Furthermore, previous studies have reported that patients with low BMI are also less likely to receive guideline‐based medical therapies.18, 20
An obesity paradox has been reported among CAD patients wherein overweight and obese patients have reduced all‐cause mortality compared with patients with normal BMI.8, 9, 21, 22 In a recent meta‐analysis, Sharma et al reported that overweight BMI was associated with reduced cardiac mortality; however, obese BMI was not.17 In the present study, overweight and obese patients had significantly reduced cardiovascular and noncardiovascular mortality compared with those with normal BMI. Reduced cardiovascular mortality in these patients is likely explained by several factors including misclassification of lean and fat mass by BMI,21 more aggressive risk factor management in obese patients,23 increased production of soluble tumor necrosis factor α receptors in the adipose tissue neutralizing the deleterious effects of tumor necrosis factor α on the myocardium,24 lower atrial natriuretic peptides, and improved endothelial function.21, 22 Overweight and obese patients also have higher metabolic reserve and less cachexia, which may benefit them in critically ill states.25 Other factors that have been implicated include the presence of unadjusted confounding factors, selection and lead time bias, and genetic differences.21, 22 No significant differences were noted in the rate of recurrent MI or repeat revascularizations between patients with overweight/obese BMI and normal BMI.21, 26
Serum Creatinine and Outcomes
The association of very high serum creatinine with increased mortality and worse cardiovascular outcomes is known.27 Low serum creatinine is a surrogate marker for reduced muscle mass and sarcopenia.4, 5 Previous studies in critically ill patients have demonstrated that low serum creatinine was associated with increased mortality11, 28; however, limited studies have investigated this association in CAD patients, and there are no data on the association with cause‐specific mortality.4, 5, 6, 7 We identified a unique subgroup of patients with normal BMI and low serum creatinine, which was associated with increased cardiovascular mortality after PCI compared with patients with normal BMI and normal serum creatinine. Competing risk plots also suggested that the noncardiovascular mortality rate was higher in the first 2 years after PCI in patients with low serum creatinine and normal BMI compared with those with normal creatinine and normal BMI (Figure 4). The number of patients in this subgroup was small (n=128), so this finding is only hypothesis generating. Reduced muscle mass or sarcopenia is associated with frailty, metabolic derangements, and poor long‐term outcomes.4, 5, 29, 30 Previous studies have also shown that participants with normal BMI and central obesity may have reduced lean mass.31, 32 A combination of sarcopenia and obesity, termed “sarcopenic obesity,” may explain this association in patients with normal BMI because sarcopenic obesity is common in elderly persons33 and is associated with increased morbidity and mortality.34, 35, 36 Patients with low serum creatinine in our study had worse angiographic features like intracoronary thrombus and bifurcation lesions at presentation compared with patients with normal creatinine, and this could partly explain the increased long‐term cardiovascular mortality. This finding would need prospective measurement of muscle mass or body composition, stratification of this subset based on lifestyle and physical activity, and performance of serial measurements to account for changes over time of weight and BMI.
Figure 4.
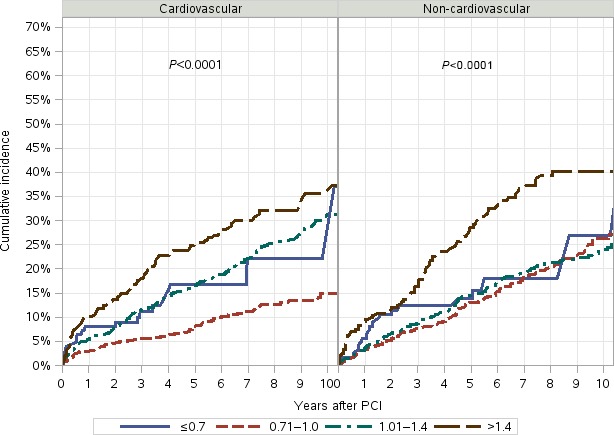
Unadjusted competing risk plots for cardiovascular and noncardiovascular mortality by serum creatinine in patients with normal body mass index. Creatinine levels are shown: Solid blue line: ≤0.7 mg/dL; dashed red line: 0.71 to 1.0 mg/dL; dash‐dot line: 1.01 to 1.4 mg/dL; long‐dash line: ≥1.4 mg/dL. Increased cardiovascular mortality was noted in the first year after PCI, and increased noncardiovascular mortality was noted in the first 2 years after PCI. PCI indicates percutaneous coronary intervention.
We did not find a significant association between low serum creatinine and mortality in patients with low BMI, possibly secondary to a very small sample size (n=18) and insufficient power. The association of low creatinine with outcomes in the overweight and obese groups is complex and is most likely modified by the obesity paradox. Other possible reasons include a poor correlation between BMI and serum creatinine and nonavailability of cardiorespiratory fitness. Prospective studies with data on cardiorespiratory fitness and central adiposity or national registry studies with more patients with low BMI and low serum creatinine may help elucidate this finding.
Clinical Implications
Unique prognostic markers need to be identified with aging of the population with CAD. In our study, low serum creatinine is associated with higher overall and cardiovascular mortality in patients with normal BMI undergoing PCI. Recognition of this simple laboratory variable can help refine the prognosis of patients with normal BMI. Future studies are needed to further characterize the patients with low serum creatinine and low BMI, especially as it relates to comorbidity, deficit accumulation, physical functioning, and frailty.
Limitations
Our study has several limitations. The patient population includes mainly white participants, and the results of our study may not be generalizable to other races and ethnic groups. In addition, the medical therapy and technologies evolved over the course of the study period, and factors such as these and other unknown factors might have confounded the results of the present study. The number of patients in the low BMI and low serum creatinine group were small, and a larger sample size is needed to confirm our findings. This study was retrospective, so the possibility of selection bias cannot be excluded, and no definitive causal relationships can be inferred. We did not have complete data on bleeding outcomes after PCI because patients with low BMI may have increased risk of procedure‐related bleeding.37 Serum creatinine levels in elderly persons may be misleading because the levels relate not only to skeletal mass but also to the hydration status of the patient and reflect factors relating to formation and clearance. Correlation and analyses of such data with creatinine clearance may be needed.
Conclusions
In elderly patients undergoing PCI, we identified a new subgroup with low serum creatinine and normal BMI that is associated with increased cardiovascular mortality. Low BMI was associated with both cardiovascular and noncardiovascular mortality. Nutritional support, resistance training, and weight‐gain strategies should be tested in these patients undergoing PCI.
Disclosures
None.
(J Am Heart Assoc. 2016;5:e003633 doi: 10.1161/JAHA.116.003633)
References
- 1. Mozaffarian D, Benjamin EJ, Go AS, Arnett DK, Blaha MJ, Cushman M, de Ferranti S, Despres JP, Fullerton HJ, Howard VJ, Huffman MD, Judd SE, Kissela BM, Lackland DT, Lichtman JH, Lisabeth LD, Liu S, Mackey RH, Matchar DB, McGuire DK, Mohler ER III, Moy CS, Muntner P, Mussolino ME, Nasir K, Neumar RW, Nichol G, Palaniappan L, Pandey DK, Reeves MJ, Rodriguez CJ, Sorlie PD, Stein J, Towfighi A, Turan TN, Virani SS, Willey JZ, Woo D, Yeh RW, Turner MB. Heart disease and stroke statistics—2015 update: a report from the American Heart Association. Circulation. 2015;131:e29–e322. [DOI] [PubMed] [Google Scholar]
- 2. Landi F, Liperoti R, Fusco D, Mastropaolo S, Quattrociocchi D, Proia A, Tosato M, Bernabei R, Onder G. Sarcopenia and mortality among older nursing home residents. J Am Med Dir Assoc. 2012;13:121–126. [DOI] [PubMed] [Google Scholar]
- 3. Singh M, Stewart R, White H. Importance of frailty in patients with cardiovascular disease. Eur Heart J. 2014;35:1726–1731. [DOI] [PMC free article] [PubMed] [Google Scholar]
- 4. Singh M, Rihal CS, Lennon RJ, Spertus JA, Nair KS, Roger VL. Influence of frailty and health status on outcomes in patients with coronary disease undergoing percutaneous revascularization. Circ Cardiovasc Qual Outcomes. 2011;4:496–502. [DOI] [PMC free article] [PubMed] [Google Scholar]
- 5. Fried TR, Mor V. Frailty and hospitalization of long‐term stay nursing home residents. J Am Geriatr Soc. 1997;45:265–269. [DOI] [PubMed] [Google Scholar]
- 6. Odden MC, Shlipak MG, Tager IB. Serum creatinine and functional limitation in elderly persons. J Gerontol A Biol Sci Med Sci. 2009;64:370–376. [DOI] [PMC free article] [PubMed] [Google Scholar]
- 7. Davison KK, Ford ES, Cogswell ME, Dietz WH. Percentage of body fat and body mass index are associated with mobility limitations in people aged 70 and older from NHANES III. J Am Geriatr Soc. 2002;50:1802–1809. [DOI] [PubMed] [Google Scholar]
- 8. Coutinho T, Goel K, Correa de Sa D, Kragelund C, Kanaya AM, Zeller M, Park JS, Kober L, Torp‐Pedersen C, Cottin Y, Lorgis L, Lee SH, Kim YJ, Thomas R, Roger VL, Somers VK, Lopez‐Jimenez F. Central obesity and survival in subjects with coronary artery disease: a systematic review of the literature and collaborative analysis with individual subject data. J Am Coll Cardiol. 2011;57:1877–1886. [DOI] [PubMed] [Google Scholar]
- 9. Oreopoulos A, Padwal R, Norris CM, Mullen JC, Pretorius V, Kalantar‐Zadeh K. Effect of obesity on short‐ and long‐term mortality postcoronary revascularization: a meta‐analysis. Obesity (Silver Spring). 2008;16:442–450. [DOI] [PubMed] [Google Scholar]
- 10. Gurm HS, Whitlow PL, Kip KE. The impact of body mass index on short‐ and long‐term outcomes inpatients undergoing coronary revascularization. Insights from the bypass angioplasty revascularization investigation (BARI). J Am Coll Cardiol. 2002;39:834–840. [DOI] [PubMed] [Google Scholar]
- 11. Cartin‐Ceba R, Afessa B, Gajic O. Low baseline serum creatinine concentration predicts mortality in critically ill patients independent of body mass index. Crit Care Med. 2007;35:2420–2423. [DOI] [PubMed] [Google Scholar]
- 12. Goel K, Lennon RJ, Tilbury RT, Squires RW, Thomas RJ. Impact of cardiac rehabilitation on mortality and cardiovascular events after percutaneous coronary intervention in the community. Circulation. 2011;123:2344–2352. [DOI] [PubMed] [Google Scholar]
- 13. Spoon DB, Psaltis PJ, Singh M, Holmes DR Jr, Gersh BJ, Rihal CS, Lennon RJ, Moussa ID, Simari RD, Gulati R. Trends in cause of death after percutaneous coronary intervention. Circulation. 2014;129:1286–1294. [DOI] [PubMed] [Google Scholar]
- 14. Singh M, Rihal CS, Gersh BJ, Roger VL, Bell MR, Lennon RJ, Lerman A, Holmes DR Jr. Mortality differences between men and women after percutaneous coronary interventions. A 25‐year, single‐center experience. J Am Coll Cardiol. 2008;51:2313–2320. [DOI] [PMC free article] [PubMed] [Google Scholar]
- 15. Harrell FE. Multivariable modeling strategies In: Harrell FE, ed. Regression Modeling Strategies. New York, NY: Spring‐Verlag; 2001:53–85. [Google Scholar]
- 16. Park DW, Kim YH, Yun SC, Ahn JM, Lee JY, Kim WJ, Kang SJ, Lee SW, Lee CW, Park SW, Park SJ. Association of body mass index with major cardiovascular events and with mortality after percutaneous coronary intervention. Circ Cardiovasc Interv. 2013;6:146–153. [DOI] [PubMed] [Google Scholar]
- 17. Sharma A, Vallakati A, Einstein AJ, Lavie CJ, Arbab‐Zadeh A, Lopez‐Jimenez F, Mukherjee D, Lichstein E. Relationship of body mass index with total mortality, cardiovascular mortality, and myocardial infarction after coronary revascularization: evidence from a meta‐analysis. Mayo Clin Proc. 2014;89:1080–1100. [DOI] [PubMed] [Google Scholar]
- 18. Bucholz EM, Krumholz HA, Krumholz HM. Underweight, markers of cachexia, and mortality in acute myocardial infarction: a prospective cohort study of elderly Medicare beneficiaries. PLoS Med. 2016;13:e1001998. [DOI] [PMC free article] [PubMed] [Google Scholar]
- 19. Flegal KM, Graubard BI, Williamson DF, Gail MH. Cause‐specific excess deaths associated with underweight, overweight, and obesity. JAMA. 2007;298:2028–2037. [DOI] [PubMed] [Google Scholar]
- 20. Steinberg BA, Cannon CP, Hernandez AF, Pan W, Peterson ED, Fonarow GC. Medical therapies and invasive treatments for coronary artery disease by body mass: the “obesity paradox” in the get with the guidelines database. Am J Cardiol. 2007;100:1331–1335. [DOI] [PubMed] [Google Scholar]
- 21. Goel K, Lopez‐Jimenez F, De Schutter A, Coutinho T, Lavie CJ. Obesity paradox in different populations: evidence and controversies. Future Cardiol. 2014;10:81–91. [DOI] [PubMed] [Google Scholar]
- 22. Lavie CJ, Milani RV, Ventura HO. Obesity and cardiovascular disease: risk factor, paradox, and impact of weight loss. J Am Coll Cardiol. 2009;53:1925–1932. [DOI] [PubMed] [Google Scholar]
- 23. Diercks DB, Roe MT, Mulgund J, Pollack CV Jr, Kirk JD, Gibler WB, Ohman EM, Smith SC Jr, Boden WE, Peterson ED. The obesity paradox in non‐ST‐segment elevation acute coronary syndromes: results from the can rapid risk stratification of unstable angina patients suppress adverse outcomes with early implementation of the American College of Cardiology/American Heart Association Guidelines Quality Improvement Initiative. Am Heart J. 2006;152:140–148. [DOI] [PubMed] [Google Scholar]
- 24. Feldman AM, Combes A, Wagner D, Kadakomi T, Kubota T, Li YY, McTiernan C. The role of tumor necrosis factor in the pathophysiology of heart failure. J Am Coll Cardiol. 2000;35:537–544. [DOI] [PubMed] [Google Scholar]
- 25. Engelman DT, Adams DH, Byrne JG, Aranki SF, Collins JJ Jr, Couper GS, Allred EN, Cohn LH, Rizzo RJ. Impact of body mass index and albumin on morbidity and mortality after cardiac surgery. J Thorac Cardiovasc Surg. 1999;118:866–873. [DOI] [PubMed] [Google Scholar]
- 26. Yancy WS Jr, Olsen MK, Curtis LH, Schulman KA, Cuffe MS, Oddone EZ. Variations in coronary procedure utilization depending on body mass index. Arch Intern Med. 2005;165:1381–1387. [DOI] [PubMed] [Google Scholar]
- 27. Best PJ, Lennon R, Ting HH, Bell MR, Rihal CS, Holmes DR, Berger PB. The impact of renal insufficiency on clinical outcomes in patients undergoing percutaneous coronary interventions. J Am Coll Cardiol. 2002;39:1113–1119. [DOI] [PubMed] [Google Scholar]
- 28. Udy AA, Scheinkestel C, Pilcher D, Bailey M. The association between low admission peak plasma creatinine concentration and in‐hospital mortality in patients admitted to intensive care in Australia and New Zealand. Crit Care Med. 2016;44:73–82. [DOI] [PubMed] [Google Scholar]
- 29. Lavie CJ, De Schutter A, Patel DA, Romero‐Corral A, Artham SM, Milani RV. Body composition and survival in stable coronary heart disease: impact of lean mass index and body fat in the “obesity paradox”. J Am Coll Cardiol. 2012;60:1374–1380. [DOI] [PubMed] [Google Scholar]
- 30. Sahakyan KR, Somers VK, Rodriguez‐Escudero JP, Hodge DO, Carter RE, Sochor O, Coutinho T, Jensen MD, Roger VL, Singh P, Lopez‐Jimenez F. Normal‐weight central obesity: implications for total and cardiovascular mortality. Ann Intern Med. 2015;163:827–835. [DOI] [PMC free article] [PubMed] [Google Scholar]
- 31. Chowdhury B, Lantz H, Sjostrom L. Computed tomography‐determined body composition in relation to cardiovascular risk factors in Indian and matched Swedish males. Metabolism. 1996;45:634–644. [DOI] [PubMed] [Google Scholar]
- 32. Seidell JC, Bjorntorp P, Sjostrom L, Sannerstedt R, Krotkiewski M, Kvist H. Regional distribution of muscle and fat mass in men–new insight into the risk of abdominal obesity using computed tomography. Int J Obes. 1989;13:289–303. [PubMed] [Google Scholar]
- 33. Batsis JA, Barre LK, Mackenzie TA, Pratt SI, Lopez‐Jimenez F, Bartels SJ. Variation in the prevalence of sarcopenia and sarcopenic obesity in older adults associated with different research definitions: dual‐energy X‐ray absorptiometry data from the National Health and Nutrition Examination Survey 1999–2004. J Am Geriatr Soc. 2013;61:974–980. [DOI] [PubMed] [Google Scholar]
- 34. Horwich TB, Fonarow GC. Measures of obesity and outcomes after myocardial infarction. Circulation. 2008;118:469–471. [DOI] [PubMed] [Google Scholar]
- 35. Atkins JL, Whincup PH, Morris RW, Lennon LT, Papacosta O, Wannamethee SG. Sarcopenic obesity and risk of cardiovascular disease and mortality: a population‐based cohort study of older men. J Am Geriatr Soc. 2014;62:253–260. [DOI] [PMC free article] [PubMed] [Google Scholar]
- 36. Batsis JA, Mackenzie TA, Barre LK, Lopez‐Jimenez F, Bartels SJ. Sarcopenia, sarcopenic obesity and mortality in older adults: results from the National Health and Nutrition Examination Survey III. Eur J Clin Nutr. 2014;68:1001–1007. [DOI] [PubMed] [Google Scholar]
- 37. Ndrepepa G, Fusaro M, Cassese S, Guerra E, Schunkert H, Kastrati A. Relation of body mass index to bleeding during percutaneous coronary interventions. Am J Cardiol. 2015;115:434–440. [DOI] [PubMed] [Google Scholar]