

Abstract
Background
People of South Asian (SAs) and African Caribbean (AC) origin have increased cardiovascular morbidity, but underlying mechanisms are poorly understood. Aging is the key predictor of deterioration in diastolic function, which can be assessed by echocardiography using E/e′ ratio as a surrogate of left ventricular (LV) filling pressure. The study aimed to assess a possibility of premature cardiac aging in SA and AC subjects.
Methods and Results
We studied 4540 subjects: 2880 SA and 1660 AC subjects. All participants underwent detailed echocardiography, including LV ejection fraction, average septal‐lateral E/e′, and LV mass index (LVMI). When compared to ACs, SAs were younger, with lower mean LVMI, systolic blood pressure (BP), diastolic BP, and body mass index (BMI), as well as a lower prevalence of hypertension and smoking (P≤0.001 for all). In a multivariate linear regression model including age, sex, ethnicity, BP, heart rate, BMI, waist circumference, LVMI, history of smoking, hypertension, coronary artery disease, diabetes mellitus, medications, SA origin was independently associated with higher E/e′ (regression coefficient±standard error, −0.66±0.10; P<0.001, adjusted R 2 for the model 0.21; P<0.001). Furthermore, SAs had significantly accelerated age‐dependent increase in E/e′ compared to ACs. On multivariable Cox regression analysis without adjustment for E/e′, SA ethnicity was independently predictive of mortality (P=0.04). After additional adjustment for E/e′, the ethnicity lost its significance value, whereas E/e′ was independently predictive of higher risk of death (P=0.008).
Conclusions
Premature cardiac aging is evident in SAs and may contribute to high cardiovascular morbidity in this ethnic group, compared to ACs.
Keywords: aging, diastolic dysfunction, ethnicity, hypertension, left ventricular mass index
Subject Categories: Aging, Cardiovascular Disease, Echocardiography
Introduction
South Asians (SAs) comprise one quarter of the world's population and represent a major minority ethnic group in many Western countries. Both native and migrant SAs have a high prevalence of cardiovascular disease and increased cardiovascular mortality.1, 2, 3, 4, 5 This is partly attributable to high frequency of cardiovascular risk factors, particularly diabetes mellitus.6 In the UK, SAs have a higher risk of coronary artery disease (CAD), compared to white Europeans, but an opposite trend is observed in people of African‐Caribbean (AC) origin.7 Of note, excess in cardiac morbidity in SAs is evident despite adjustment for conventional cardiovascular risk factors, and they typically present with heart failure and require coronary interventions at a younger age compared to white subjects.8, 9 Also, the Framingham score, which developed in the white US population, failed to predict excess in cardiovascular mortality in SAs in the UK.10, 11 Initially, this was deemed attributable to lack of socioeconomic adjustment in the score.12 However, a new QRISK2 score developed in the UK that accounts for deprivation was equally unreliable in ethnic minority groups.13 Whereas the Framingham score underestimates risk among SAs, it overestimates outcome in the AC community, thus indicating intrinsic ethnic differences in prognostication beyond conventional risk factors.13
E/e′, a ratio of peak early diastolic mitral flow velocity and peak early diastolic mitral annulus tissue velocity, has been established as a noninvasive surrogate for left ventricular (LV) diastolic pressures.14 E/e′ is widely used for grading LV diastolic function, and it has been uniformly shown to be reproducible in daily practice.15 Numerous clinical studies have produced convincing evidence of a positive, linear relation of E/e′ and invasively measured mean LV diastolic pressure regardless of heart rhythm, heart rate, and LV ejection fraction (LVEF).16, 17, 18, 19, 20, 21 Indeed, E/e′ was more accurate than natriuretic peptides for noninvasively determining LV diastolic pressures.20 Also, E/e′ parallels changes in LV diastolic pressures during exercise.22
In addition to its relationship with filling pressure, E/e′ has a clear association with aging, even in healthy individuals, and can serve as a surrogate measure of cardiac aging.23, 24, 25 However, no information is currently available on differences of age‐related changes in E/e′ and presence of accelerated ageing in ethnic minority groups, as well as its role in prognostication.
The Ethnic‐Echocardiographic Heart of England Screening Study (E‐ECHOES) study was a cross‐sectional population survey of subjects of SA origin (ie, from India, Pakistan, or Bangladesh) and AC origin age ≥45 years.26 Study individuals were recruited from September 2006 to August 2009 from 20 primary care centers in Birmingham, UK, and the collected data included comprehensive clinical assessment and echocardiography.26 In the present ancillary analysis to the E‐ECHOES study, we assessed the presence of accelerated cardiac aging in SAs using E/e′ as a surrogate and its role in all‐cause mortality, compared to AC subjects.
Methods
The analysis was performed using the E‐ECHOES study population. Exclusion criteria were conditions known to affect utility of E/e′ ratio as an estimate of LV filling pressure: (1) moderate‐severe aortic or mitral valve disease (stenosis or regurgitation), significant cardiac dyssynchrony attributed to LV conduction abnormalities (ie, QRS ≥140 ms). The analysis only included patients who had no missing data in the parameters used to establish the regression model described below. The E‐ECHOES database has 5353 entries, of whom 813 met the exclusion criteria and 4540 patients have been included in the analysis.
The vast majority of the study participants were first‐generation migrants who lived most of their life in the UK. Among the 2880 South Asian patients, 2625 (91%) were born in India, Pakistan, or Bangladesh, only 50 (1.7%) were born in the UK, with the rest (205; 7%) of the patients born in other parts of the world (mostly from East Africa). Mean age of settling in the UK was 26±13 years, and mean duration since coming to the UK was 35±12 years. Among the 1660 participants of AC origin, 1293 (78%) were born in the Caribbean islands (majority, 1104 [67%] in Jamaica), 291 (18%) in the UK, and 76 (5%) in other countries. Mean age of settling in the UK was 23±12 years, and mean duration since coming to the UK was 41±14 years.
The E‐ECHOES study was approved by Walsall Local Research Ethics Committee (05/Q2708/45), with all participants having provided written informed consent for data collection and analysis. Cases of deaths and their causes were provided by the Office of National Statistics.
Echocardiography
All study participants underwent detailed echocardiographic analysis with images reviewed by a consultant cardiologist with expertise in echocardiography. Echocardiography was done in primary care settings using a portable VIVID i machine (GE Healthcare, Chalfont St Giles, UK). LVEF, dimensions of cardiac chambers, LV mass index (LVMI), and parameters of diastolic function (mitral valve E/A ratio; E‐wave deceleration time; and isovolumic relaxation time, tissue Doppler imaging of lateral, and septal mitral valve annulus) were also measured in accord with current recommendations.27 An average of septal and lateral E/e′ was calculated and used in the analysis.
Statistical Analysis
Descriptive data are presented as median (interquartile range; IQR) and compared using the Kruskal–Wallis test. Linear regression was used to establish predictors of E/e′ and left atrial diameter index (LADI) with the following predictor variables tested: age, sex, history of diabetes mellitus and smoking, systolic and diastolic blood pressure (BP), heart rate, body mass index (BMI), waist circumference, and LVMI. Cox regression analysis was used to establish predictors of all‐cause mortality in the study population using the predictor variables above. P values of <0.05 were considered as statistically significant. STATA software (version 13; StatCorp LP, College Station, TX) was used for statistical analyses.
Results
Demographic characteristics of participants reflect distribution of ethnic minority groups in Birmingham (Table 1). When compared to ACs, SAs were younger, had lower systolic BP, diastolic BP, and BMI, as well as lower prevalence of hypertension and smoking (P≤0.001 for all). Diabetes mellitus was more common in SAs (30% vs 27%; P=0.005). Calcium‐channel blockers and diuretics were more often used in ACs (P<0.001 for both). Consistently with lower rates of hypertension and blood pressure values, SAs had lower LVMI (117 [93–143] vs 103 [85–125] g/m2 in ACs). ACs and SAs had similar low rates of reduced LVEF (<55%; 2% in both groups), and E/e′ was nonsignificantly different from ACs (P=0.85) in a nonunadjusted analysis.
Table 1.
Demographic Characteristics of the Study Population
| South Asians (n=2880) | African Caribbeans (n=1660) | P Value | |
|---|---|---|---|
| Demographic and clinical characteristics | |||
| Age, y | 56 [51–66] | 61 [50–72] | <0.001 |
| Male | 1380 [48%] | 747 [44%] | 0.02 |
| SBP, mm Hg | 138 [126–152] | 143 [131–157] | <0.001 |
| DBP, mm Hg | 81 [74–88] | 82 [75–90] | 0.001 |
| Heart rate, bits/min | 78 [70–87] | 76 [68–85] | <0.001 |
| BMI, kg/m2 | 28 [25–31] | 29 [26–33] | <0.001 |
| Waist circumference, cm | 97 [90–104] | 97 [88–105] | 0.58 |
| Hypertension, n | 1254 [44%] | 944 [57%] | <0.001 |
| CAD, n | 311 [11%] | 86 [5%] | <0.001 |
| Diabetes mellitus, n | 878 [30%] | 441 [27%] | 0.005 |
| History of heart failure | 25 [1%] | 18 [1%] | 0.47 |
| Chronic obstructive pulmonary disease, n | 25 [1%] | 15 [1%] | 0.90 |
| AF, n | 17 [1%] | 14 [1%] | 0.32 |
| History of smoking, n | 653 [23%] | 721 [43%] | <0.001 |
| Medications | |||
| Angiotensin conversion enzyme inhibitors or angiotensin receptor antagonists, n | 651 [23%] | 391 [24%] | 0.46 |
| Calcium‐channel blockers, n | 487 [17%] | 599 [36%] | <0.001 |
| Aldosterone antagonists, n | 280 [10%] | 180 [11%] | 0.23 |
| Beta‐blockers, n | 370 [13%] | 199 [12%] | 0.40 |
| Diuretics, n | 475 [16%] | 506 [30%] | <0.001 |
| Echocardiographic data | |||
| Reduced ejection fraction <55% | 70 [2%] | 34 [2%] | 0.41 |
| E/e′ ratio | 8.0 [6.3–10.2] | 8.0 [6.5–9.9] | 0.85 |
| LVMI, g/m2 | 103 [85–125] | 117 [93–143] | <0.001 |
| End‐diastolic diameter index, cm/m2 | 2.46 [2.26–2.69] | 2.37 [2.17–2.59] | <0.001 |
| LADI, cm/m2 | 1.73 [1.55–1.91] | 1.65 [1.46–1.85] | <0.001 |
| Diastolic dysfunction, n | 1683 [59%] | 1023 [62%] | 0.03 |
AF indicates atrial fibrillation; BMI, body mass index; CAD, coronary artery disease; DBP, diastolic blood pressure; LADI, left atrial diameter index; LVMI, left ventricular mass index; SBP, systolic blood pressure.
The strongest predictors of E/e′ on multivariable regression analysis were high systolic BP (standardized β=0.22), advanced age (standardized β=0.20), higher LVMI (standardized β=0.19), and SA ethnicity (standardized β=0.10; P<0.001 for all; adjusted R 2 for the model, 0.21; Table 2). Relationship between age and E/e′ was polynomial with linear (F statistics, 124; P<0.001) and quadratic (F statistics, 22; P<0.001) components. On polynomial regression, SA ethnicity was associated with higher E/e′ for the whole model and for all age groups presented (P<0.001 for all; Figure 1).
Table 2.
Independent Predictors of E/e′ in Multivariable Analysis (n=4540)
| Parameter | Regression Coefficient±SE | Standardized β | P Value |
|---|---|---|---|
| SBP | 0.04±0.003 | 0.22 | <0.001 |
| Age | 0.06±0.01 | 0.20 | <0.001 |
| Female | 1.27±0.11 | 0.19 | <0.001 |
| LVMI | 0.01±0.001 | 0.11 | <0.001 |
| South Asian origin | 0.66±0.10 | 0.10 | <0.001 |
| Diabetes mellitus | 0.68±0.11 | 0.09 | <0.001 |
| DBP | −0.03±0.01 | 0.09 | <0.001 |
| History of smoking | 0.37±0.11 | 0.05 | 0.001 |
| Waist | 0.01±0.01 | 0.04 | 0.04 |
| CAD | 0.38±0.18 | 0.03 | 0.03 |
| Beta‐blockers | 0.32±0.16 | 0.03 | 0.04 |
CAD indicates coronary artery disease; DBP, diastolic blood pressure; LVMI, Left ventricular mass index; SBP, systolic blood pressure.
For the model, adjusted R 2=0.21, P<0.001.
Figure 1.
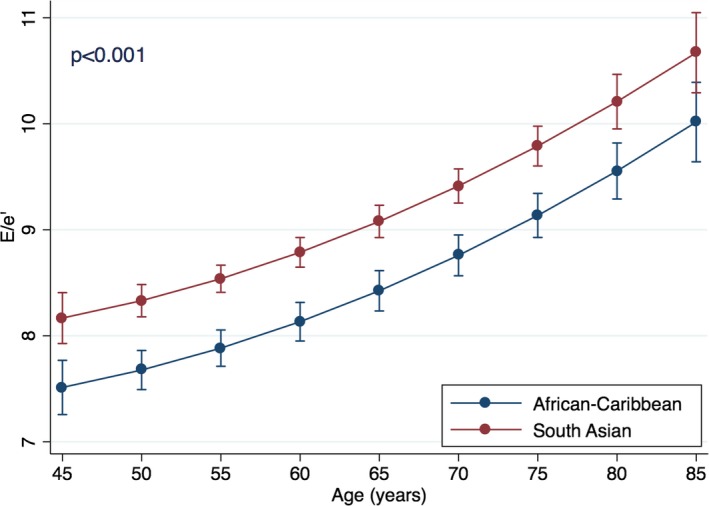
Relationship between age and E/e′ in ethnic groups. The figure presents multivariable polynomial regression showing predictive value of ethnicity for E/e′ across the different age groups. The analysis is based on the model presented in Table 2, with an additional adjustment of the polynomial component of age‐related effects. Also, age was categorized by groups with 5‐year increments, which are presented as the graph points. Error bars are 95% CIs for the correspondent graph points.
There was a significant interaction between age and ethnicity in their relation to E/e′ (standardized β=0.36 for interaction; P<0.001; Figure 2). This interaction is suggestive that SA had a steeper age‐related increase in adjusted regression slope of age‐E/e′ relationship. Based on the adjusted model, E/e′=8 is reached at age 46.3 years in SAs and at 53.4 years in ACs (ie, 7.1‐year difference with South Asians). Further increase in 1 unit of E/e′ (ie, E/e=9) was reached at age 62.7 years in SAs and at 78.1 years in ACs (ie, 15.4 years later).
Figure 2.
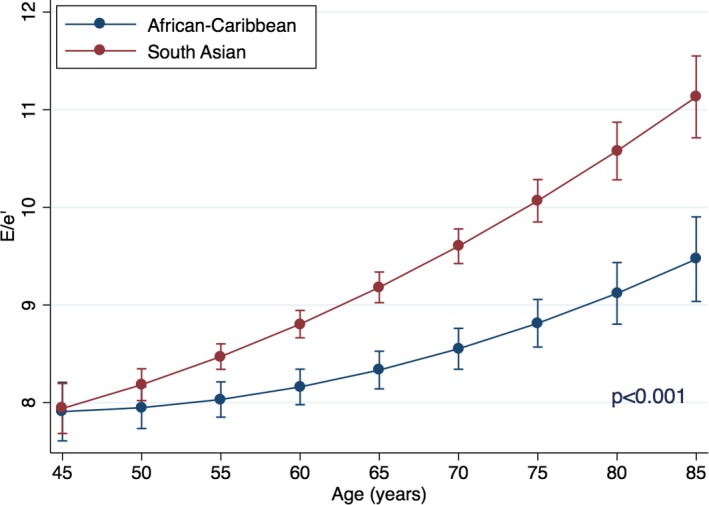
Interactions of age and ethnicity for prediction for E/e′. Point estimates are values of the regression line at age groups categorized by 5‐year increments. Error bars are 95% CIs for the correspondent graph points.
The model was additionally tested for possible interactions between ethnicity and presence of diabetes or CAD, but no such significant interactions were found (standardized β=0.04; P=0.10 for diabetes mellitus; standardized β=−0.03; P=0.32 for CAD). In this model, interactions between SA ethnicity and age remain highly significant (standardized β=0.42; P<0.001), supporting the presence of accelerated E/e′ increase in this ethnic group. The role of ethnicity in predicting E/e′ was further tested in separate subgroups of subjects with and without diabetes mellitus and CAD. Independent association of SA ethnicity with higher E/e′ was evident in all 4 subgroups (Table 3). Analysis of interactions between ethnicity and age in patients had limited power in patients with diabetes mellitus (n=441 for AC patients with diabetes mellitus and n=86 of AC patients with CAD), especially given the ethnic difference in age distributions. Interactions between SA ethnicity and age were highly significant in subjects without diabetes mellitus (standardized β=0.39; P<0.001) and without CAD (standardized β=0.42; P<0.001), but such interactions were not significant in patients with diabetes mellitus (standardized β=0.21; P=0.18) and CAD (standardized β=−0.47; P=0.17; Figure 3).
Table 3.
Subgroup Analysis of Predictive Value of South Asian Ethnicity for E/e′ (Multivariable Linear Regression)
| South Asian Subjects (n) | African Caribbean Subjects (n) | Regression Coefficient±Standard Error | Standardized β | P Value | |
|---|---|---|---|---|---|
| Diabetes mellitusa | |||||
| Present | 878 | 441 | 1.53±0.23 | 0.19 | <0.001 |
| Not present | 2002 | 1219 | 0.35±0.20 | 0.57 | <0.001 |
| CADb | |||||
| Present | 311 | 86 | 1.26±0.54 | 0.12 | 0.02 |
| Not present | 2569 | 1574 | 0.61±10 | 0.09 | <0.001 |
CAD indicates coronary artery disease.
Variables included in the multivariable analysis: age, sex, history of smoking, systolic and diastolic blood pressure, heart rate, body mass index, waist circumference, and left ventricular mass index.
Variables included in the multivariable analysis: age, sex, history of diabetes mellitus and smoking, systolic and diastolic blood pressure, heart rate, body mass index, waist circumference, and left ventricular mass index.
Figure 3.
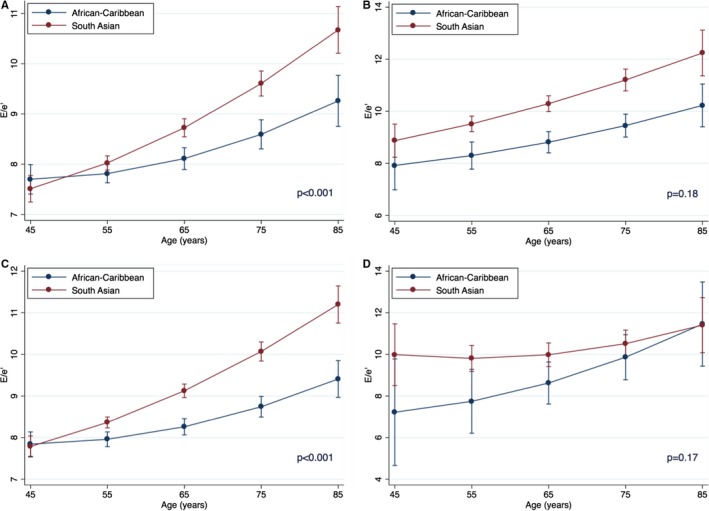
Interactions of age and ethnicity for prediction for E/e′ in subgroups. A, Without diabetes mellitus (SA, n=2002; AC, n=1219). B, With diabetes mellitus (SA, n=878; AC, n=441). C, Without coronary artery disease (SA, n=2569; AC, n=1574). D, With coronary artery disease (SA, n=311; AC, n=86). Point estimates are values of the regression line at age groups categorized by 5‐year increments. Error bars are 95% CIs for the correspondent graph points. AS indicates African‐Caribbean origin; SA, South Asian origin.
Also, on multivariable regression, SA ethnicity was the strongest significant predictor of increased LADI among all variables (standardized β=0.20; P<0.001). Similar to E/e′, the relationship between age and LADI was polynomial, with linear (F statistics 91; P<0.001) and quadratic (F statistics 4; P=0.04) components. On polynomial regression, SA ethnicity was associated with higher LADI for the whole model (standardized β=0.20; P<0.001) and for all age groups presented (P<0.001 for all; Figure 4). There was no significant interaction between age and ethnicity in their relation to LADI (standardized β=0.07 for interaction; P=0.41; Figure 5). SA ethnicity was strongly associated with increased LADI already at the youngest test age (ie, 45 years), and the association remain throughout the whole included age range.
Figure 4.
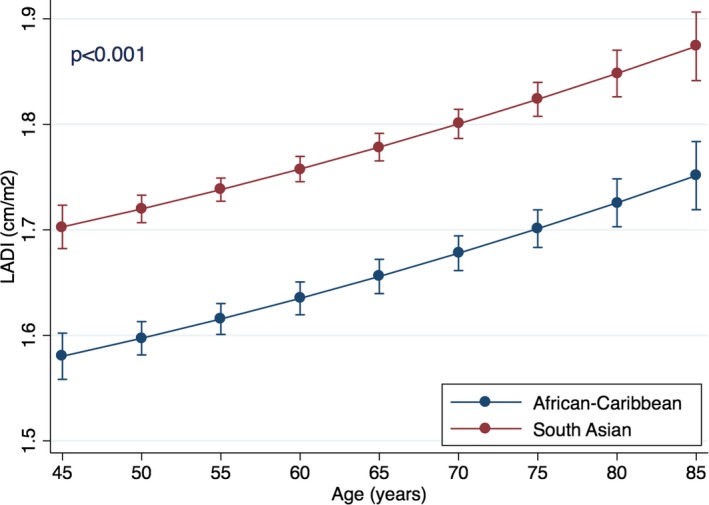
Relationship between age and left atrial diameter index (LADI) in ethnic groups. Point estimates are values of the regression line at age groups categorized by 5‐year increments. Error bars are 95% CIs for the correspondent graph points.
Figure 5.
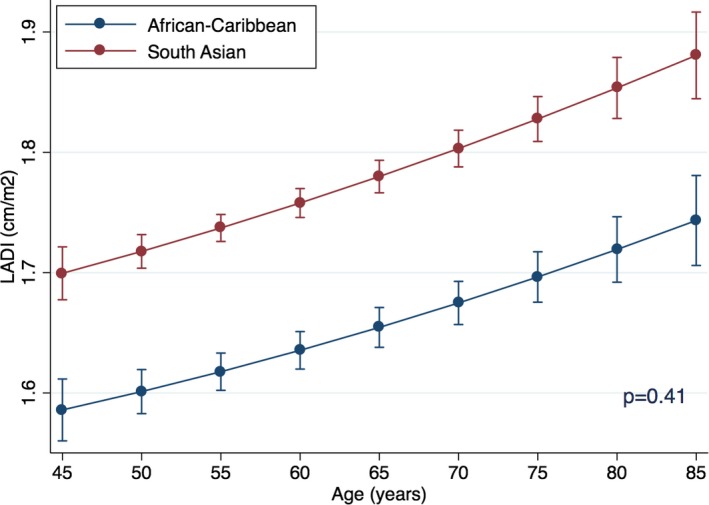
Interactions of age and ethnicity for prediction for left atrial diameter index (LADI). P value for interaction. Point estimates are values of the regression line at age groups categorized by 5‐year increments. Error bars are 95% CIs for the correspondent graph points.
After a median follow‐up of 5.8 years (IQR, 5.2–6.5), 241 (5.3%) participants died from any cause. On multivariable Cox regression analysis without adjustment for E/e′, independent predictions of mortality were SA ethnicity, advanced age, history of CAD and smoking, higher heart rate, BMI, and use of diuretics (Table 4). After additional adjustment for E/e′, ethnicity lost its statistical significance, whereas E/e′ was independently predictive of higher risk of death (other significant predictors remained unchanged). When the same model was fitted with dichotomized E/e′, values of E/e′ ≥10 were independently associated with higher risk of death (hazard ratio [HR], 1.34; 95% CI, 1.04–1.83; P=0.027; Figure 6).
Table 4.
Independent Predictors of All‐Cause Mortality (Cox Regression)
| Independent Predictors | Without Adjustment for E/e′ | With Adjustment for E/e′ | ||
|---|---|---|---|---|
| HR [95% CI] | P Value | HR [95% CI] | P Value | |
| South Asian ethnicity | 1.38 [1.02–1.88] | 0.04 | ||
| E/e′ | 1.04 [1.01–1.07] | 0.008 | ||
| Age, per y | 1.08 [1.06–1.09] | <0.001 | 1.08 [1.06–1.09] | <0.001 |
| CAD | 1.59 [1.10–2.29] | 0.01 | 1.58 [1.10–2.28] | 0.01 |
| Smoking | 1.60 [1.18–2.17] | 0.003 | 1.55 [1.14–2.11] | 0.005 |
| Heart rate, per 1 bpm | 1.02 [1.01–1.03] | <0.001 | 1.02 [1.01–1.03] | <0.001 |
| BMI, per kg/m2 | 0.95 [0.91–0.99] | 0.02 | 0.95 [0.91–0.99] | 0.02 |
| LVMI, per g/m2 | 1.01 [1.00–1.01] | <0.001 | 1.00 [1.00–1.01] | 0.002 |
| Diuretics | 1.56 [1.15–2.11] | 0.004 | 1.56 [1.15–2.11] | 0.004 |
BMI indicates body mass index; bpm, beats per minute; CAD, coronary artery disease; HR, hazard ratio; LVMI, left ventricular mass index.
Figure 6.
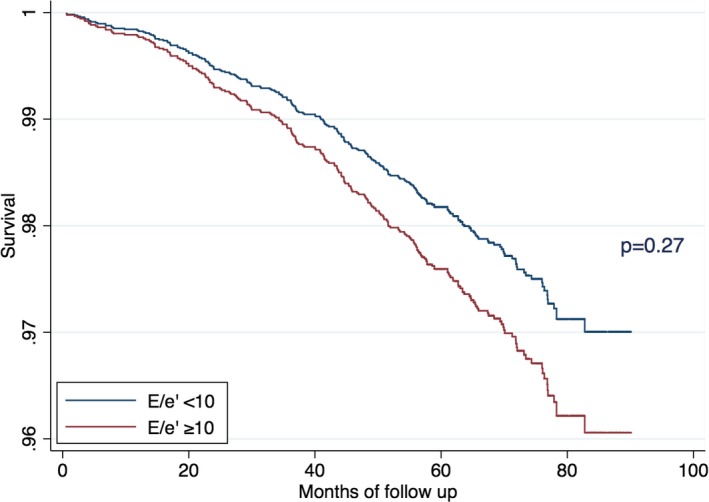
Predictive value of E/e′ ≥10 for all‐cause mortality in a multivariable Cox regression analysis.
Discussion
The study shows, for the first time, that SAs have accelerated cardiac aging, as suggested by changes in E/e′. When E/e′ is used as a surrogate of premature aging after adjustment for risk factors, diastolic dysfunction, and chronological aging, the study findings provide some explanation on why people of SA origin have increased cardiovascular risk even after accounting for standard cardiovascular risk factors.10, 11 Indeed, SAs reached E/e′ of 8, a value commonly considered as a cutoff for normal range, at a younger mean age of 7.1 years compared to ACs (ie, an ethnic group with an excellent longevity profile in the UK).13
Evidence of high clinical significance of even mild diastolic dysfunction with relatively low E/e′ comes from the Olmsted population‐based study of subjects aged ≥45 years, where mild diastolic dysfunction with E/e′ <10 was present in 21% of participants and was strongly and independently predictive of all‐cause mortality (HR, 8.31; 95% CI, 3.00–23.1; P<0.001).28 In our study, there was a highly significant interaction between SA ethnicity and the age‐related increase in E/e′. This means than SA had much more prominent acceleration in the E/e′ elevation with advanced age compared to ACs. In fact, E/e′ of 9 was reached, on average, 15.4 years younger than ACs. Although these relatively low E/e′ values may not signify a clinically relevant increase in LV filling pressure in healthy subjects, they may significantly contribute to development of cardiac complications in people with predisposing factors, such as hypertension and CAD.
Moreover, E/e′ was independently predictive of an increased risk of death, and SA ethnicity lost its independent predictive value for mortality after adjustment for E/e′. This, again, supports clinical relevance of accelerated aging in SAs reflected by E/e′ as a prognosticator.
At present, there are no universally accepted clinical markers of cardiac aging. Although many cardiac parameters show changes in with age (eg, increase in LV dimensions and wall thickness), it is difficult to distinguish contributions of aging per se from those related to age‐related changes in blood pressure or hemoglobin levels, given that the observed age‐related changes are usually small. Among all age‐related cardiac changes, shifts in parameters of diastolic function (eg, E/A mitral flow ratio) are most prominent and widely acknowledged. However, many parameters of diastolic dysfunction change bidirectionally with progression of diastolic dysfunction. For example, E/A decreases and isovolumic relaxation time and early mitral inflow deceleration time increase in mild diastolic dysfunction, whereas opposite changes are observed in more‐advanced stages. This makes analysis of continuity of the changes problematic. E/e′ offers the advantage of unidirectional, relatively linear changes with increase in LV filling pressure, and E/e′ has a clear relation to aging in healthy subjects.29
In order to minimize the effect of age‐related hemodymanic changes (eg, gradual increase in BP even in healthy subjects), we constructed regression models adjusted for history of hypertension, BP, and, most important, LVMI. Unsurprisingly, LVMI itself was strongly predictive for higher E/e′ and mortality, but adjustment for this parameter lets us speculate that the observed ethnic differences occurred attributed to other mechanisms that result in delayed myocardial relaxation secondary to thickened myocardium. Indeed, this observation points toward age‐related modulation of cardiac extracellular matrix (ie, fibrosis) or diminished elastic properties/relaxation speed of cardiomyocytes.
Although there were no significant interactions between ethnicity and diabetes mellitus or CAD in prediction of E/e′ on regression analysis, and SA origin was uniformly linked to higher E/e′ in people with or without diabetes mellitus or CAD, subgroup analyses showed that interactions between ethnicity and age were largely confined to subjects without diabetes mellitus or CAD. It is likely (and not unexpected) that the magnitude of diabetes mellitus/CAD‐induced cardiac changes reflected by E/e′ was more substantial compared to more‐subtle effects of aging. A substantially bigger population would be required to specifically assess contribution of aging to cardiac changes in individuals with overt heart disease or diabetes mellitus.
In support of E/e′‐based conclusions, SA origin was a strong independent predictor of larger left atrial size across all tested age groups. However, the pattern of age‐related effects was different from those observed for E/e′. Whereas ethnic difference in E/e′ was relatively modest at the youngest tested age and SAs had a clear acceleration of E/e′ elevation with more‐advanced age, prominent ethnic differences were already observed for LADI age 45 years and the magnitude of these changes remained constant in older people. The precise explanations of differences are not clear, but they could be attributed to a larger number of hemodynamic influences for atrial size.
Limitations
Because of lack of accepted clinical markers of cardiac aging, E/e′ was used as a surrogate measure of aging. It was beyond the scope of the present work to provide mechanistic insights into the background processes of aging. The analysis of association of SA ethnicity with premature aging was based on observational study, and a prospective analysis would ideally be required. Although E/e′ is accepted as a noninvasive measure of LV filling pressures, recent studies found that the correlation between E/e′ and pulmonary capillary wedge pressure may be worse than previously reported, and a novel, more‐advanced echocardiographic technique may be a preferable choice for future research.30, 31, 32, 33
Perspectives
People of SA origin are at increased risk of cardiovascular morbidity and mortality. This cannot be fully explained by their profile of standard cardiovascular risk factors. SAs often present with cardiac pathology at a younger age than other ethnic groups. Premature cardiac aging is evident in SAs and may contribute to high cardiovascular morbidity in this ethnic group, compared to ACs. This opens a new direction in the understanding of “unexplained” excess in cardiac morbidity in certain populations. Further mechanistic studies are needed to provide insights into mechanisms of cardiac aging in SAs. Scarce methods for quantification of cardiac senescence are available at present, and this study encourages further development in the field.
Disclosures
None.
Sources of Funding
This work was supported by the British Heart Foundation (PG/05/036), Heart of Birmingham Teaching Primary Care Trust, and through the National Health Service R&D support funding (Primary Care Research Network‐Central England). The funders had no role in study design, data collection and analysis, decision to publish, or preparation of the manuscript.
Acknowledgments
We are grateful to all the subjects, practice staff, including receptionists, nurses, and managers, and general practitioners for taking part in this study. General Practice Centres: Rotton Park Medical Centre, City Road Medical Practice, Cavendish Medical Practice, Ann Jones Family Health Centre, Shanklin House Surgery, Burbury Street Surgery, Heathford Group Practice, Broadway Health Centre, Victoria Road Medical Centre, Churchill Medical Centre, St Clements Surgery, Handsworth Medical Centre, Soho Health Centre, Church Road Surgery, Bloomsbury Health Centre, Al‐Shafa Medical Practice, Enki Medical Practice, Aston Pride Health Centre, Newtown Health Centre, and Hockley Medical Centre.
(J Am Heart Assoc. 2016;5:e004110 doi: 10.1161/JAHA.116.004110)
References
- 1. Mohan V, Deepa R, Rani SS, Premalatha G; Chennai Urban Population S . Prevalence of coronary artery disease and its relationship to lipids in a selected population in South India: the Chennai Urban Population Study (CUPS No. 5). J Am Coll Cardiol. 2001;38:682–687. [DOI] [PubMed] [Google Scholar]
- 2. Gupta R, Gupta VP, Sarna M, Bhatnagar S, Thanvi J, Sharma V, Singh AK, Gupta JB, Kaul V. Prevalence of coronary heart disease and risk factors in an urban Indian population: Jaipur Heart Watch‐2. Indian Heart J. 2002;54:59–66. [PubMed] [Google Scholar]
- 3. Yusuf S, Reddy S, Ounpuu S, Anand S. Global burden of cardiovascular diseases: part I: general considerations, the epidemiologic transition, risk factors, and impact of urbanization. Circulation. 2001;104:2746–2753. [DOI] [PubMed] [Google Scholar]
- 4. Balarajan R. Ethnic differences in mortality from ischaemic heart disease and cerebrovascular disease in England and Wales. BMJ. 1991;302:560–564. [DOI] [PMC free article] [PubMed] [Google Scholar]
- 5. Palaniappan L, Wang Y, Fortmann SP. Coronary heart disease mortality for six ethnic groups in California, 1990–2000. Ann Epidemiol. 2004;14:499–506. [DOI] [PubMed] [Google Scholar]
- 6. Gujral UP, Pradeepa R, Weber MB, Narayan KM, Mohan V. Type 2 diabetes in South Asians: similarities and differences with white Caucasian and other populations. Ann N Y Acad Sci. 2013;1281:51–63. [DOI] [PMC free article] [PubMed] [Google Scholar]
- 7. Wild SH, Fischbacher C, Brock A, Griffiths C, Bhopal R. Mortality from all causes and circulatory disease by country of birth in England and Wales 2001–2003. J Public Health (Oxf). 2007;29:191–198. [DOI] [PubMed] [Google Scholar]
- 8. Jones DA, Gallagher S, Rathod KS, Redwood S, de Belder MA, Mathur A, Timmis AD, Ludman PF, Townend JN, Wragg A; Nicor . Mortality in South Asians and Caucasians after percutaneous coronary intervention in the United Kingdom: an observational cohort study of 279,256 patients from the BCIS (British Cardiovascular Intervention Society) National Database. JACC Cardiovasc Interv. 2014;7:362–371. [DOI] [PubMed] [Google Scholar]
- 9. Shantsila E, Lip GY, Gill PS. Systolic heart failure in South Asians. Int J Clin Pract. 2011;65:1274–1282. [DOI] [PubMed] [Google Scholar]
- 10. Game FL, Jones AF. Ethnicity and risk factors for coronary heart disease in diabetes mellitus. Diabetes Obes Metab. 2000;2:91–97. [DOI] [PubMed] [Google Scholar]
- 11. Cappuccio FP, Oakeshott P, Strazzullo P, Kerry SM. Application of Framingham risk estimates to ethnic minorities in United Kingdom and implications for primary prevention of heart disease in general practice: cross sectional population based study. BMJ. 2002;325:1271. [DOI] [PMC free article] [PubMed] [Google Scholar]
- 12. Brindle PM, McConnachie A, Upton MN, Hart CL, Davey Smith G, Watt GC. The accuracy of the Framingham risk‐score in different socioeconomic groups: a prospective study. Br J Gen Pract. 2005;55:838–845. [PMC free article] [PubMed] [Google Scholar]
- 13. Tillin T, Hughes AD, Whincup P, Mayet J, Sattar N, McKeigue PM, Chaturvedi N; Group SS . Ethnicity and prediction of cardiovascular disease: performance of QRISK2 and Framingham scores in a U.K. tri‐ethnic prospective cohort study (SABRE–Southall And Brent REvisited). Heart. 2014;100:60–67. [DOI] [PMC free article] [PubMed] [Google Scholar]
- 14. Nagueh SF, Appleton CP, Gillebert TC, Marino PN, Oh JK, Smiseth OA, Waggoner AD, Flachskampf FA, Pellikka PA, Evangelista A. Recommendations for the evaluation of left ventricular diastolic function by echocardiography. J Am Soc Echocardiogr. 2009;22:107–133. [DOI] [PubMed] [Google Scholar]
- 15. Bess RL, Khan S, Rosman HS, Cohen GI, Allebban Z, Gardin JM. Technical aspects of diastology: why mitral inflow and tissue Doppler imaging are the preferred parameters? Echocardiography. 2006;23:332–339. [DOI] [PubMed] [Google Scholar]
- 16. Nagueh SF, Mikati I, Kopelen HA, Middleton KJ, Quinones MA, Zoghbi WA. Doppler estimation of left ventricular filling pressure in sinus tachycardia. A new application of tissue Doppler imaging. Circulation. 1998;98:1644–1650. [DOI] [PubMed] [Google Scholar]
- 17. Sohn DW, Song JM, Zo JH, Chai IH, Kim HS, Chun HG, Kim HC. Mitral annulus velocity in the evaluation of left ventricular diastolic function in atrial fibrillation. J Am Soc Echocardiogr. 1999;12:927–931. [DOI] [PubMed] [Google Scholar]
- 18. Kim YJ, Sohn DW. Mitral annulus velocity in the estimation of left ventricular filling pressure: prospective study in 200 patients. J Am Soc Echocardiogr. 2000;13:980–985. [DOI] [PubMed] [Google Scholar]
- 19. Gonzalez‐Vilchez F, Ayuela J, Ares M, Mata NS, Gonzalez AG, Duran RM. Comparison of Doppler echocardiography, color M‐mode Doppler, and Doppler tissue imaging for the estimation of pulmonary capillary wedge pressure. J Am Soc Echocardiogr. 2002;15:1245–1250. [DOI] [PubMed] [Google Scholar]
- 20. Dokainish H, Zoghbi WA, Lakkis NM, Al‐Bakshy F, Dhir M, Quinones MA, Nagueh SF. Optimal noninvasive assessment of left ventricular filling pressures: a comparison of tissue Doppler echocardiography and B‐type natriuretic peptide in patients with pulmonary artery catheters. Circulation. 2004;109:2432–2439. [DOI] [PubMed] [Google Scholar]
- 21. Bruch C, Grude M, Muller J, Breithardt G, Wichter T. Usefulness of tissue Doppler imaging for estimation of left ventricular filling pressures in patients with systolic and diastolic heart failure. Am J Cardiol. 2005;95:892–895. [DOI] [PubMed] [Google Scholar]
- 22. Burgess MI, Jenkins C, Sharman JE, Marwick TH. Diastolic stress echocardiography: hemodynamic validation and clinical significance of estimation of ventricular filling pressure with exercise. J Am Coll Cardiol. 2006;47:1891–1900. [DOI] [PubMed] [Google Scholar]
- 23. Munagala VK, Jacobsen SJ, Mahoney DW, Rodeheffer RJ, Bailey KR, Redfield MM. Association of newer diastolic function parameters with age in healthy subjects: a population‐based study. J Am Soc Echocardiogr. 2003;16:1049–1056. [DOI] [PubMed] [Google Scholar]
- 24. De Sutter J, De Backer J, Van de Veire N, Velghe A, De Buyzere M, Gillebert TC. Effects of age, gender, and left ventricular mass on septal mitral annulus velocity (E') and the ratio of transmitral early peak velocity to E' (E/E'). Am J Cardiol. 2005;95:1020–1023. [DOI] [PubMed] [Google Scholar]
- 25. Tighe DA, Vinch CS, Hill JC, Meyer TE, Goldberg RJ, Aurigemma GP. Influence of age on assessment of diastolic function by Doppler tissue imaging. Am J Cardiol. 2003;91:254–257. [DOI] [PubMed] [Google Scholar]
- 26. Gill PS, Calvert M, Davis R, Davies MK, Freemantle N, Lip GY. Prevalence of heart failure and atrial fibrillation in minority ethnic subjects: the Ethnic‐Echocardiographic Heart of England Screening Study (E‐ECHOES). PLoS One. 2011;6:e26710. [DOI] [PMC free article] [PubMed] [Google Scholar]
- 27. Lang RM, Bierig M, Devereux RB, Flachskampf FA, Foster E, Pellikka PA, Picard MH, Roman MJ, Seward J, Shanewise J, Solomon S, Spencer KT, St John Sutton M, Stewart W; American Society of Echocardiography's N, Standards C, Task Force on Chamber Q, American College of Cardiology Echocardiography C, American Heart A and European Association of Echocardiography ESoC . Recommendations for chamber quantification. Eur J Echocardiogr. 2006;7:79–108. [DOI] [PubMed] [Google Scholar]
- 28. Redfield MM, Jacobsen SJ, Burnett JC Jr, Mahoney DW, Bailey KR, Rodeheffer RJ. Burden of systolic and diastolic ventricular dysfunction in the community: appreciating the scope of the heart failure epidemic. JAMA. 2003;289:194–202. [DOI] [PubMed] [Google Scholar]
- 29. Dalen H, Thorstensen A, Vatten LJ, Aase SA, Stoylen A. Reference values and distribution of conventional echocardiographic Doppler measures and longitudinal tissue Doppler velocities in a population free from cardiovascular disease. Circ Cardiovasc Imaging. 2010;3:614–622. [DOI] [PubMed] [Google Scholar]
- 30. Maeder MT, Thompson BR, Brunner‐La Rocca HP, Kaye DM. Hemodynamic basis of exercise limitation in patients with heart failure and normal ejection fraction. J Am Coll Cardiol. 2010;56:855–863. [DOI] [PubMed] [Google Scholar]
- 31. Bhella PS, Pacini EL, Prasad A, Hastings JL, Adams‐Huet B, Thomas JD, Grayburn PA, Levine BD. Echocardiographic indices do not reliably track changes in left‐sided filling pressure in healthy subjects or patients with heart failure with preserved ejection fraction. Circ Cardiovasc Imaging. 2011;4:482–489. [DOI] [PMC free article] [PubMed] [Google Scholar]
- 32. Santos M, Rivero J, McCullough SD, West E, Opotowsky AR, Waxman AB, Systrom DM, Shah AM. E/e' ratio in patients with unexplained dyspnea: lack of accuracy in estimating left ventricular filling pressure. Circ Heart Fail. 2015;8:749–756. [DOI] [PMC free article] [PubMed] [Google Scholar]
- 33. Kasner M, Sinning D, Burkhoff D, Tschope C. Diastolic pressure‐volume quotient (DPVQ) as a novel echocardiographic index for estimation of LV stiffness in HFpEF. Clin Res Cardiol. 2015;104:955–963. [DOI] [PubMed] [Google Scholar]