

Abstract
Background
Marfan syndrome (MFS) and familial non–syndromal thoracic aortic aneurysm and dissection (ns‐TAAD) are genetic aortopathies causing aortic dilatation with increased aortic stiffness. Left ventricular (LV) contractility and ventricular‐vascular coupling index (VVI) were compared between MFS and ns‐TAAD and determinants of VVI were investigated.
Methods and Results
Patients with MFS (M 57, F 47) and ns‐TAAD (M 72, F 39) were studied by echocardiography and compared with controls (M 77, F 71). Aortic geometry, hemodynamics, LV work, LV contractility (end‐systolic elastance [Ees]), and VVI were documented. Aortic sinuses were equally dilated in MFS (19.7±2.4) and ns‐TAAD (19.8±1.8) compared to controls (16.2±1.4 mm·m−2, P<0.001). Aortic stiffness index was increased in MFS (9.7±5.1) and ns‐TAAD (10.8±4.7) versus controls (5.4±2.0, P<0.01); LV stroke work was unchanged in MFS (436±74) compared to controls (435±60) but increased in ns‐TAAD (492±109 mJ·m−2 P<0.01). The LV Ees was reduced in MFS (1.32±0.19) compared to controls (1.65±0.29 mm Hg·mL−1, P<0.01) but increased in ns‐TAAD (1.83±0.30, P<0.01) and VVI was abnormal in MFS (0.71±0.11) compared to controls (0.62±0.07, P<0.01) and ns‐TAAD (0.62±0.09). Treatment with β‐blockers was associated with partial normalization of VVI in MFS. A VVI ≥0.8 was associated with increased risk of death and heart failure in MFS.
Conclusions
Left ventricular contractility and ventricular‐vascular coupling are abnormal in MFS but preserved in ns‐TAAD, and are independent of aortic stiffness, consistent with intrinsic impairment of myocardial contractility in MFS.
Keywords: aneurysm, β‐blocker, matrix metalloproteinases, mechanics, myocardium
Subject Categories: Cardiomyopathy, Aneurysm, Clinical Studies
Introduction
The arterial vasculature in young adults exhibits high compliance, with low stiffness and pulse pressure, and optimal coupling to left ventricular (LV) ejection. With increasing age, elastin fragmentation and increased collagen in the aorta result in increased vascular stiffness, contributing to increased systolic blood pressure and LV afterload,1, 2, 3 which is particularly evident after age 40 years.4 A feature of Marfan syndrome (MFS) is accelerated elastin fragmentation, with increased aortic stiffness beyond usual age‐related changes.5, 6 Other aortopathies, including non–syndromal familial thoracic aneurysm and dissection (ns‐TAAD) and aneurysm‐osteoarthritis syndrome, are associated with abnormal aortic stiffness.7 LV systolic function and vascular load are closely coupled. This relationship can be characterized as the interaction of time‐variant elastances of the ventricle and arterial vasculature, described by the end‐systolic pressure‐volume relation and the effective arterial elastance, respectively.8 Chronic changes in vascular loading are associated with altered ventricular geometry and function.9
A recent laboratory study, examining end‐systolic pressure‐volume relations, has described abnormal myocardial contractility in a mouse model of severe MFS, associated with evidence of altered cardiomyocyte cell‐signaling.10 Some clinical studies have described abnormal LV function in MFS;11, 12, 13, 14 however, others find no abnormality15, 16 and data interpretation is confounded by inclusion of patients receiving β‐blockers and use of load‐dependent measures of ventricular function. Ventricular function in ns‐TAAD has not been systematically examined. β‐Blockers and angiotensin‐receptor blockers are used to ameliorate aortic dilatation in MFS17 and by extrapolation in ns‐TAAD; however, as yet there is no conclusive data about the effect of these medications on ventricular function in these genetic aortopathies.
This study investigated ventricular‐vascular coupling in MFS and ns‐TAAD. The primary aim was to compare the degree of any LV functional impairment in MFS and ns‐TAAD and to document the factors associated with LV function in these aortopathies. The secondary aim was to examine the potential protective effect or otherwise of β‐blockers and angiotensin‐receptor blockers on ventricular function.
Methods
Study Groups
Participants in this study were enrolled in the Marfan and Aortic Disease Clinic at Royal Prince Alfred Hospital, Sydney. A full medical history, physical examination, and echocardiographic imaging were obtained at enrollment. Individuals were considered to have aortic disease if they manifested thoracic aortic aneurysm or dilatation (Z score >2 adjusted for age and body size).18
This consecutive study group includes all eligible individuals aged ≥16 years, attending the clinic between January 2010 and June 2015. Controls include patients referred for assessment, who had normal hearts without aortic dilatation. Diagnosis of MFS was according to revised Ghent criteria.19 Diagnosis of ns‐TAAD required aortic dilatation in absence of known risk factors plus family history of aortic aneurysm/dissection in a first‐degree relative or known pathogenic gene variant. Individuals with hypertension, atherosclerosis, aortitis, or bicuspid aortic valve disease were ineligible. Patients with mitral/aortic regurgitation of more than mild degree or atrial fibrillation were excluded, as were patients with coronary artery disease (history or symptoms of ischemia, abnormal ECG, or documented coronary disease), previous cardiac/aortic surgery, or aortic dissection.
Echocardiography
Complete 2‐dimensional echocardiography, including Doppler flow interrogation, was performed according to standard techniques. Images were analyzed in duplicate by 2 independent observers and the mean of their observations was used for data analysis. Brachial sphygmomanometry was performed at the end of the echocardiography examination and central aortic pressure calculated according to published data.20 The end‐systolic aortic pressure (Pes) was estimated as 0.9×peak systolic pressure (Psys) and aortic stiffness (SAo) was calculated from end‐diastolic and end‐systolic aortic diameters at the sinuses of Valsalva, as previously described.6 Left ventricular geometry was measured with calculation of biplane end‐diastolic/end‐systolic volumes (biplane method of disks) and LV mass (2‐dimensional truncated ellipsoid model) according to published standards.21 The LV ejection velocities were measured by pulse‐wave Doppler at below the aortic valve, with calculation of stroke volume22, 23 from the Doppler velocity‐time integral. Left ventricular stroke work (LVSW) was calculated as the product of LV stroke volume and mean arterial pressure less estimated LV end‐diastolic pressure (15 mm Hg).24 Left ventricular systolic time intervals were measured from the aortic Doppler signal, including isovolumic contraction time (TIVC), ejection time (TEJECT), and total systolic time (TSYS) and LV myocardial velocities in systole and diastole were measured at the basal interventricular septum by tissue Doppler.23 The LV dP/dt was calculated as the quotient of LV developed pressure at aortic valve opening and isovolumic contraction time.
The LV end‐systolic pressure volume relation was calculated according to the single‐beat technique of Chen et al.25 Indices of LV work, systemic vascular resistance (SVR), aortic elastance (Ea), end‐systolic LV elastance (Ees), and the ventricular‐vascular coupling ratio (VVI) were calculated according to published methods.8 The mean interobserver variations in determination of Ees, Ea, VVI, and LVSW were 17.7%, 12.7%, 13.3%, and 12.7%, respectively.
Data Analysis
Discrete data are described as proportions/frequency. Normality of continuous data distributions was tested by Kolmogorov–Smirnov and Shapiro–Wilk tests. As data sets were often not normally distributed, a bisquare‐weighted ANOVA was performed according to the method of Regeth and Stine,26 with r=3 SDs for removal of outliers and iterations were continued until incremental change in weighted mean was <1%. Continuous data are reported as weighted mean±SD and also as median and interquartile range. When ANOVA detected significant differences within data sets, intergroup comparisons were performed by post‐hoc tests: Tukey test if equal group variances or Dunnetts T3 test if group variances were unequal by Levene test. Discrete data were compared by χ2 test. Correction by Bonferroni method was made for multiple comparisons as required. Relationships between continuous variables were compared by least‐squares regression, with stratification by aortopathy type and age. Primary comparisons were between controls, MFS, and ns‐TAAD groups. Secondary comparisons were between age, sex, and treatment subgroups in the Marfan and ns‐TAAD groups. For comparisons of Ea, Ees, VVI, and LVSW per 100 g myocardium, in the current data set, a minimum group size of 50 allows detection of a difference in means of ≥15%, and a minimum group size of 25 allows detection of a difference in means of ≥25%, with power >80% at α=0.05. Data analysis was performed using the SPSS v.24 package (IBM Inc 2016) and a P<0.05 is described as significant.
Ethics and Privacy
Patients gave consent for echocardiography and clinical data collection at the time of examination and clinical records data use is approved by the hospital Human Research Ethics Committee (Protocols X12‐0304 and X15‐0382). Each author has contributed to this study, including design and data analysis, and to preparation of the manuscript. All authors have read and approved the manuscript as submitted.
Results
Study Groups
Among 944 patients attending the Clinic during the enrollment period, 187 had MFS (83 excluded with dissection, surgery, and valve regurgitation); 223 had ns‐TAAD (112 excluded with dissection, surgery, and valve regurgitation); 148 had no aortic disease; 254 had bicuspid valve aneurysm; 82 had hypertensive/atherosclerotic disease; and 50 had other conditions (Loeys–Dietz syndrome, Ehlers–Danlos syndrome, and aortitis). A total of 363 individuals were included (148 controls, 104 MFS, 111 ns‐TAAD). Among MFS patients, 63 were not taking any medication and 41 were taking medication: 29 β‐blockers; 12 angiotensin II receptor blockers. Among the ns‐TAAD patients, 67 were taking no medication and 44 were taking medication (16 β‐blockers, 28 angiotensin II receptor blockers).
Demographics of the groups are compared in Table 1. There were more males in the ns‐TAAD group and patients with ns‐TAAD group were slightly older than controls or MFS patients. A family history of aortic disease was present in nearly all MFS and ns‐TAAD patients; however, pathogenic gene mutations remain unknown for most ns‐TAAD patients.
Table 1.
Clinical Features of Study Groups
| Controls | Marfan | ns‐TAAD | |||||||
|---|---|---|---|---|---|---|---|---|---|
| All Patients | No Medication | β‐blockers | AgII Blockers | All Patients | No Medication | β‐blockers | AgII Blockers | ||
| N | 148 | 104 | 63 | 29 | 12 | 111 | 67 | 16 | 28 |
| Age, y |
30.6±10.4 32 (23–48) |
31.3±9.6 32 (24–47) |
30.0±9.3 29 (22–38) |
32.3±8.8 33 (26–44) |
37.4±11.7 40 (31–54) |
46.1±12.4**, ‡
46 (34–57) |
45.9±12.9 46 (33–58) |
43.5±11.7 45 (33–52) |
48.0±11.6 50 (37–57) |
| Females | 71 (48%) | 47 (45%) | 34 (54%) | 10 (34%) | 3 (25%) | 39 (35%) | 23 (34%) | 4 (25%) | 12 (43%) |
| Family history | 69 (47%) | 81 (78%)** | 45 (71%) | 24 (83%) | 12 (100%) | 90 (81%)** | 56 (84%) | 12 (75%) | 22 (76%) |
| Known mutation | 0 | 61 (59%) | 35 (55%) | 18 (62%) | 8 (66%) | 15 (14%)‡ | 6 (9%) | 1 (8%) | 8 (29%) |
| BSA, m2 |
1.9±0.2 2.0 (1.8–2.0) |
1.9±0.2 1.9 (1.8–2.1) |
1.9±0.2 1.9 (1.8–2.0) |
2.0±0.2 1.9 (1.8–2.2) |
2.1±0.3 2.0 (1.9–2.2) |
2.0±0.2 2.1 (1.8–2.2) |
2.0±0.2 2.0 (1.9–2.2) |
2.0±0.2 2.1 (1.9–2.2) |
2.0±0.2 2.0 (1.8–2.2) |
| Heart rate, min−1 |
71±8 71 (63–79) |
64±7**
64 (58–72) |
66±7 66 (60–73) |
60±7††
58 (51–65) |
67±7 70 (63–74) |
66±7**
65 (60–74) |
67±7 66 (60–75) |
66±7 65 (60–71) |
66±7 65 (63–72) |
| Blood pressure | |||||||||
| Psys, mm Hg |
106±11 107 (97–117) |
103±8 103 (96–110) |
104±8 104 (96–113) |
101±8 101 (95–106) |
105±9 108 (99–123) |
118±11**, ‡
118 (108–130) |
119±11 122 (111–130) |
112±10 111 (104–119) |
118±12 117 (105–130) |
| Pdias, mm Hg |
74±6 75 (70–80) |
73±7 75 (70–80) |
74±7 75 (70–80) |
72±6 70 (65–75) |
74±7 75 (69–80) |
80±5**, ‡
80 (75–85) |
80±5 80 (75–85) |
79±4 79 (75–80) |
80±5 80 (75–85) |
| Ppulse, mm Hg |
33±7 33 (27–41) |
31±6*
31 (26–37) |
31±5 31 (26–36) |
29±6 28 (23–36) |
34±6 38 (30–43) |
39±7**, ‡
40 (32–46) |
40±7 40 (33–48) |
36±7 36 (27–40) |
38±8 38 (30–45) |
| Pmean, mm Hg |
85±7 86 (78–91) |
83±6 83 (79–90) |
84±6 83 (79–90) |
82±7 80 (75–86) |
84±7 88 (77–94) |
92±7**, ‡
93 (86–99) |
93±7 93 (88–99) |
89±6 88 (83–94) |
93±7 92 (87–100) |
| Pes, mm Hg |
96±10 96 (87–105) |
93±7 93 (86–100) |
94±7 94 (86–102) |
91±7 91 (86–95) |
95±8 99 (90–110) |
106±10**, ‡
106 (97–117) |
107±10 110 (99–117) |
101±9 100 (93–107) |
107±11 105 (95–117) |
| Aortic geometry | |||||||||
| AoRoot, mm.m−2 |
12.1±1.3 12.0 (11.0–13.6) |
13.9±2.0**
14.2 (12.0–15.6) |
13.5±1.9 13.7 (11.6–15.1) |
14.8±1.8†
15.4 (13.8–16.8) |
13.6±2.2 14.1 (11.1–15.1) |
13.6±1.9**
13.6 (11.7–15.2) |
13.2±1.8 13.1 (11.7–14.8) |
14.6±1.8 15.0 (14.0–16.2) |
13.8±2.0 14.4 (11.7–15.5) |
| AoSV, mm.m−2 |
16.2±1.4 16.2 (15.0–17.4) |
19.7±2.4**
20.5 (18.3–23.1) |
21.6±2.2 19.2 (17.9–22.3) |
20.2±2.8††
21.5 (20.7–24.3) |
21.1±2.6 20.5 (18.8–23.2) |
19.8±1.8**
19.8 (18.1–21.5) |
19.4±1.8 19.5 (17.8–20.9) |
20.4±1.8 20.8 (19.0–22.0) |
20.1±1.8 20.4 (18.4–21.7) |
| AoAsc, mm.m−2 |
14.2±1.5 14.3 (13.0–15.6) |
15.8±2.1**
15.8 (14.1–18.4) |
15.6±2.0 15.4 (14.0–17.6) |
16.5±2.0 16.4 (15.1–18.7) |
15.6±2.1 15.8 (14.1–18.4) |
17.6±2.6**, ‡
17.4 (15.6–20.2) |
17.5±2.5 17.3 (15.5–19.6) |
17.2±2.5 17.0 (15.3–18.9) |
18.2±2.9 18.1 (16.4–21.8) |
| SAo index |
5.4±2.0 5.8 (4.0–8.2) |
9.7±5.1**
10.3 (6.2–16.7) |
9.2±4.5 8.6 (5.8–13.8) |
10.6±5.3 14.4 (6.5–18.4) |
10.6±6.9 12.4 (8.2–26.7) |
10.8±4.7**
11SD .5 (7.1–16.5) |
10.4±4.8 10.9 (6.9–15.9) |
10.3±4.7 8.4 (7.1–16.1) |
12.1±4.4 13.2 (10.0–19.7) |
Data shown as weighted mean and SD and as median and interquartile range. AgII indicates angiotensin II; AoAsc, ascending aorta diameter; AoRoot, aortic root diameter; AoSV, sinus Valsalva diameter; BSA, body surface area; ns‐TAAD, non–syndromal thoracic aortic aneurysm and dissection; Pdias, diastolic blood pressure; Pes, end‐systolic blood pressure; Pmean, mean blood pressure; Ppulse, pulse pressure; Psys, systolic blood pressure; SAo, aortic stiffness index.
*P<0.05, **P<0.01 vs controls.
† P<0.05, †† P<0.01 vs No medication (within Marfan or ns‐TAAD group).
‡ P<0.01 vs Marfan.
Systolic (Psys), diastolic (Pdias), and mean (Pmean) aortic pressures were comparable between MFS and controls but significantly greater in ns‐TAAD patients, as was the pulse pressure (Ppulse). Both Psys and Pmean increased with age in all groups (Figure 1); however, the increase was more marked in the ns‐TAAD group than in the control or MFS groups. Greater Psys and Pmean were observed in both males and females with ns‐TAAD (Figure 2).
Figure 1.
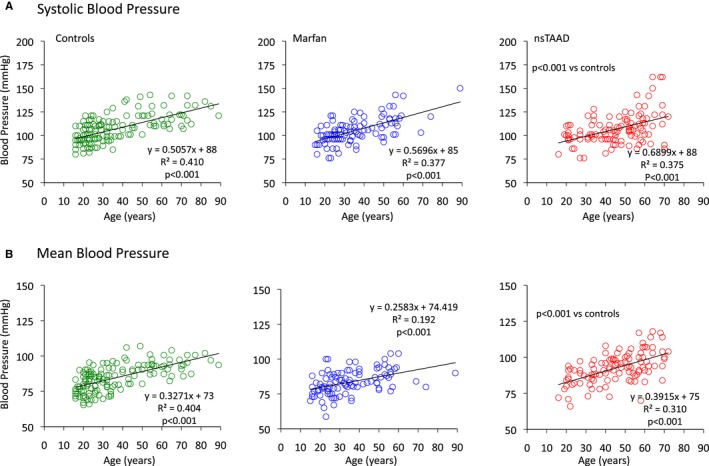
Relationships between age and systolic central aortic pressure (A) and mean central aortic pressure (B) for control (green), MFS (blue), and ns‐TAAD (red) groups. ns‐TAAD indicates nonsyndromal thoracic aortic aneurysm and dissection. MFS indicates Marfan syndrome; ns‐TAAD, ns‐TAAD, non–syndromal thoracic aortic aneurysm and dissection.
Figure 2.
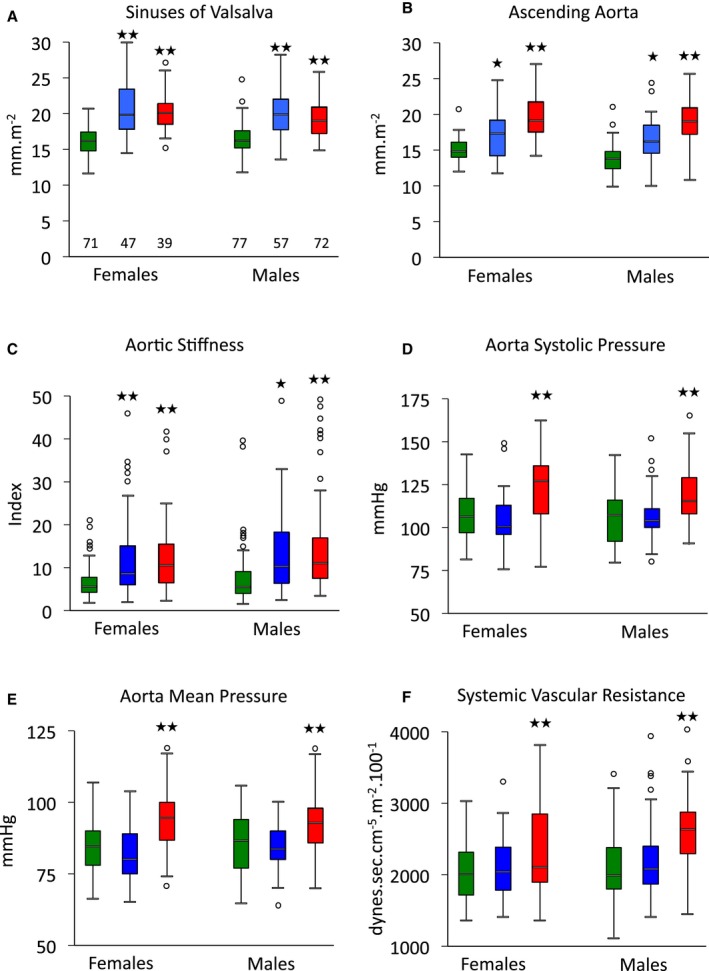
Aortic geometry and hemodynamics according to sex and aortopathy. Data are shown for all patients, irrespective of treatment. Diameters of sinuses of Valsalva (A) and ascending aorta (B); stiffness of aortic sinuses (C); peak systolic pressure (D); mean aortic pressure (E); and systemic vascular resistance index (F) for control (green), Marfan (blue) and ns‐TAAD (red) groups, according to sex. *P<0.05, **P<0.01 vs controls in same sex group. Number of patients in groups shown in (A). ns‐TAAD indicates non–syndromal thoracic aortic aneurysm and dissection.
Aortic Geometry and Hemodynamics
Dilatation of the sinuses of Valsalva was comparable in MFS and ns‐TAAD groups; however, dilatation of the ascending aorta was more severe in ns‐TAAD (Table 1). Aortic diameter at both sinuses of Valsalva and ascending aorta increased with age in controls (Figure 3). In MFS, the rate of increase in aortic diameter with age appeared greater than in controls, although there was considerable variation between individuals. Similar findings were observed in the ns‐TAAD group. Aortic diameters at both sinus of Valsalva and ascending aorta were comparable for both males and females with MFS and ns‐TAAD (Figure 2).
Figure 3.
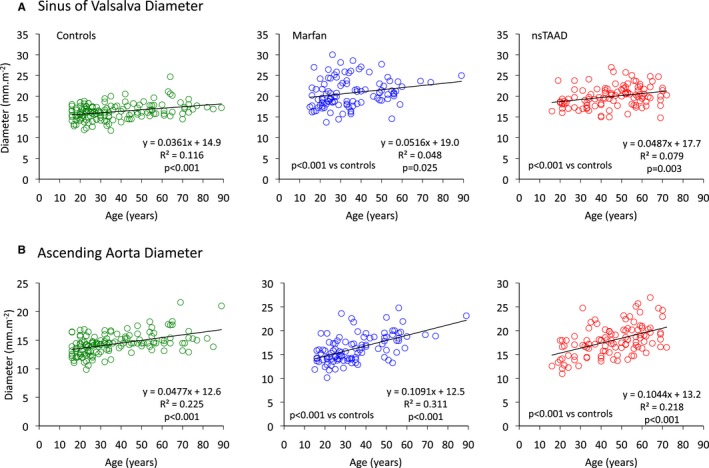
Relationships between age and maximum diameter of sinuses of Valsalva (A) and ascending aorta (B) for control (green), MFS (blue), and ns‐TAAD (red) groups. MFS indicates Marfan syndrome; ns‐TAAD, non–syndromal thoracic aortic aneurysm and dissection.
Aortic stiffness was significantly greater in both MFS and ns‐TAAD groups than in controls (Table 1), but did not differ between males and females with either MFS or ns‐TAAD (Figure 2). Aortic stiffness increased with age in controls (Figure 4) and also in MFS and ns‐TAAD groups, although there was wide variability in the degree of aortic stiffness in both of these aortopathy groups. The systemic vascular resistance index (SVRI) was greater in ns‐TAAD than in controls (Table 2 and Figure 4).
Figure 4.
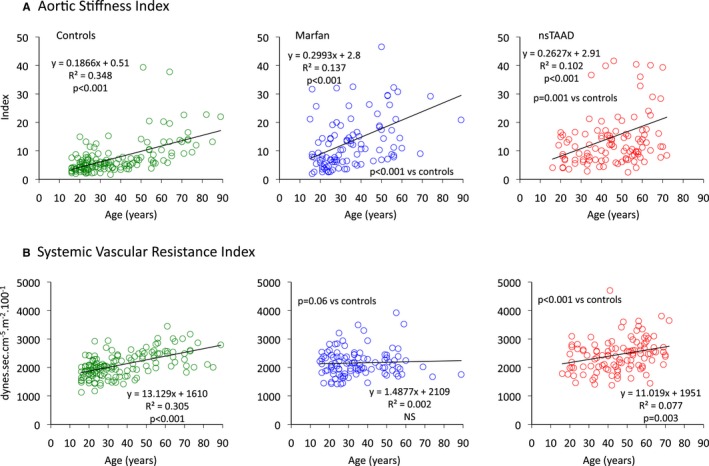
Relationships between age and aortic stiffness index (A) and systemic vascular resistance index (B) for control (green), MFS (blue), and ns‐TAAD (red) groups. MFS indicates Marfan syndrome; ns‐TAAD, non–syndromal thoracic aortic aneurysm and dissection.
Table 2.
Left Ventricular Geometry and Function
| Controls | Marfan | ns‐TAAD | |||||||
|---|---|---|---|---|---|---|---|---|---|
| All Patients | No Medication | β‐ Blockers | AgII Blockers | All Patients | No Medication | β‐ Blockers | AgII Blockers | ||
| Ventricular volumes and cardiac index | |||||||||
| LVEDVI, mL·m−2 |
67±8 67 (61–76) |
71±7*
71 (65–79) |
68±7 69 (62–75) |
74±7††
77 (71–80) |
72±6 71 (68–76) |
68±10 68 (60–78) |
70±10 70 (62–81) |
64±10 62 (54–69) |
68±10 68 (61–75) |
| LVESVI, mL·m−2 |
20±5 20 (16–25) |
21±5 20 (18–28) |
22±5 21 (18–28) |
20±6 19 (15–27) |
20±6 19 (15–31) |
21±5 21 (19–27) |
21±5 21 (17–26) |
21±5 22 (15–26) |
19±5 19 (15–23) |
| LVSVI, mL·m−2 |
47±5 48 (42–52) |
47±7 49 (42–56) |
47±6 47 (41–53) |
52±7††
57 (49–60) |
49±7 51 (43–55) |
48±7 47 (41–54) |
48±7 48 (43–56) |
43±7 42 (35–47) |
48±7 50 (42–54) |
| LVEF, % |
71±5 70 (65–76) |
69±6 68 (63–75) |
68±6 65 (59–70) |
72±7†
74 (64–78) |
72±7 71 (63–77) |
70±5 69 (65–75) |
70±5 69 (65–75) |
68±6 68 (62–72) |
71±5 72 (67–75) |
| CI, L·min−1·m−2 |
3.3±0.4 3.4 (3.0–3.7) |
3.1±0.4**
3.2 (2.7–3.6) |
3.1±0.4 3.0 (2.8–3.5) |
3.2±0.5 3.2 (2.7–3.6) |
3.3±0.5 3.6 (3.0–3.8) |
3.1±0.5*
3.1 (2.7–3.6) |
3.2±0.7 3.1 (2.8–3.7) |
2.7±0.4†
2.5 (2.4–3.0) |
3.2±0.5 3.2 (2.9–3.7) |
| SVRI, dynes·s·cm−5·m−2 |
2014±297 2013 (1782–2344) |
2083±295 2104 (1862–2381) |
2120±291 2155 (1896–2437) |
2022±311 1996 (1754–2341) |
2037±271 2054 (1863–2247) |
2397±398**, ‡
2472 (2024–2741) |
2362±386 2434 (1994–2680) |
2612±388 2720 (2392–3074) |
2366±414 2416 (2015–2657) |
| LV mass, g·m−2 |
75±14 73 (62–90) |
84±15**
85 (72–99) |
85±15 82 (70–98) |
83±15 87 (69–98) |
89±16 96 (77–116) |
89±14**, ‡
89 (77–105) |
89±14 88 (76–105) |
89±16 84 (77–101) |
91±13 95 (81–107) |
| Systolic time intervals | |||||||||
| TIVC, ms |
48±7 49 (43–57) |
64±12**
65 (53–76) |
65±13 63 (53–79) |
64±12 63 (54–72) |
64±11 65 (54–70) |
52±10‡‡
53 (44–61) |
52±10 53 (44–60) |
54±11 54 (47–67) |
52±9 52 (44–59) |
| TEJECT, ms |
287±19 284 (269–304) |
299±23**
299 (279–321) |
296±22 292 (279–317) |
312±23†
319 (298–334) |
287±23 278 (267–305) |
293±19 293 (277–312) |
294±20 296 (279–316) |
295±18 290 (282–312) |
290±19 291 (269–306) |
| TSYS, ms |
337±20 339 (318–354) |
363±26**
360 (338–388) |
359±24 359 (337–383) |
376±27†
385 (354–403) |
353±31 340 (324–387) |
346±21‡‡
348 (325–365) |
346±21 349 (329–370) |
349±20 350 (339–359) |
343±21 344 (319–359) |
| Tissue Doppler indices | |||||||||
| S′, cm·s−1 |
8.3±1.2 8.2 (7.5–9.4) |
7.5±1.2**
7.4 (6.5–8.6) |
7.4±1.3 7.3 (6.5–8.4) |
7.3±1.0 7.4 (6.6–7.9) |
8.7±1.2†
9.0 (8.6–9.7) |
7.6±1.3**
7.8 (6.5–8.8) |
7.7±1.4 7.8 (6.5–9.2) |
7.6±1.3 8.0 (6.5–8.2) |
7.6±1.2 7.6 (7.0–8.8) |
| A′, cm·s−1 |
8.6±1.6 8.7 (7.3–10.0) |
8.0±1.6*
8.0 (6.8–9.6) |
8.0±1.6 8.0 (6.4–9.5) |
7.9±1.7 7.8 (6.8–9.1) |
8.4±1.7 8.6 (7.6–11.0) |
9.3±1.7*, ‡‡
9.0 (7.9–11.0) |
9.1±1.8 8.8 (7.5–10.8) |
9.2±1.5 8.8 (8.0–10.5) |
9.7±1.8 10.1 (8.2–11.7) |
| E′, cm·s−1 |
10.6±2.5 10.8 (8.2–12.6) |
8.8±1.6**
9.0 (7.5–10.3) |
8.8±1.6 8.9 (7.7–10.1) |
8.8±1.6 9.2 (7.4–10.2) |
9.0±1.8 8.7 (7.4–10.5) |
7.9±2.2**, ‡
8.0 (6.0–10.4) |
8.2±2.3 8.5 (6.2–10.9) |
7.8±2.1 7.5 (6.0–9.1) |
7.4±2.1 7.0 (5.7–9.5) |
| E/E′ |
8.2±1.9 8.0 (6.9–9.6) |
8.8±2.2 8.8 (7.1–10.8) |
8.8±2.1 8.6 (7.2–10.3) |
9.1±2.3 9.4 (7.2–11.3) |
8.4±26 8.0 (5.8–11.3) |
8.9±2.9 8.6 (6.7–11.6) |
8.6±2.7 8.6 (6.7–10.9) |
8.4±1.9 8.7 (7.1–9.1) |
9.9±3.8 9.4 (7.0–13.9) |
Data are shown as weighted mean and SD and as median and interquartile range. A′ indicates late diastolic mitral annular velocity; CI, cardiac index; E/E′, ratio early mitral diastolic inflow and annular velocities; E′, early diastolic mitral annular velocity; LV mass, left ventricular mass; LVEDVI, left ventricular end‐diastolic volume index; LVEF, left ventricular ejection fraction; LVESVI, left ventricular end‐systolic volume index; LVSVI, left ventricular stroke volume index; ns‐TAAD, non–syndromal thoracic aortic aneurysm and dissection; S′, systolic mitral annular velocity; SVRI, systemic vascular resistance index; TEJECT, left ventricular ejection time; TIVC, left ventricular isovolumic contraction time; TSYS, left ventricular systolic time interval.
*P<0.05, **P<0.01 vs controls.
† P<0.05, †† P<0.01 vs No medication (within Marfan or ns‐TAAD group).
‡ P<0.05, ‡‡ P<0.01 ns‐TAAD vs Marfan.
LV Geometry and Systolic Function
Among patients taking no medication, the LV end‐diastolic volume index did not differ between groups, but LV end‐diastolic volume index was slightly greater in MFS patients taking β‐blockers (Table 2), as was the LV stroke volume index. The LV end‐systolic volume index and LV ejection fraction were not significantly different between groups (Table 2). The cardiac index was lower in both MFS and ns‐TAAD groups, consistent with the lower resting heart rate in these patients.
LV mass index was significantly greater in both MFS and ns‐TAAD compared to controls, with a concentric pattern of wall thickening (Table 2). The greatest increase in LV mass was observed in the ns‐TAAD group. The LV mass index was greater in males in all groups (Figure 5). The LV mass index increased with age in controls (Figure 6); however, no significant age dependency was evident in either MFS or ns‐TAAD groups.
Figure 5.
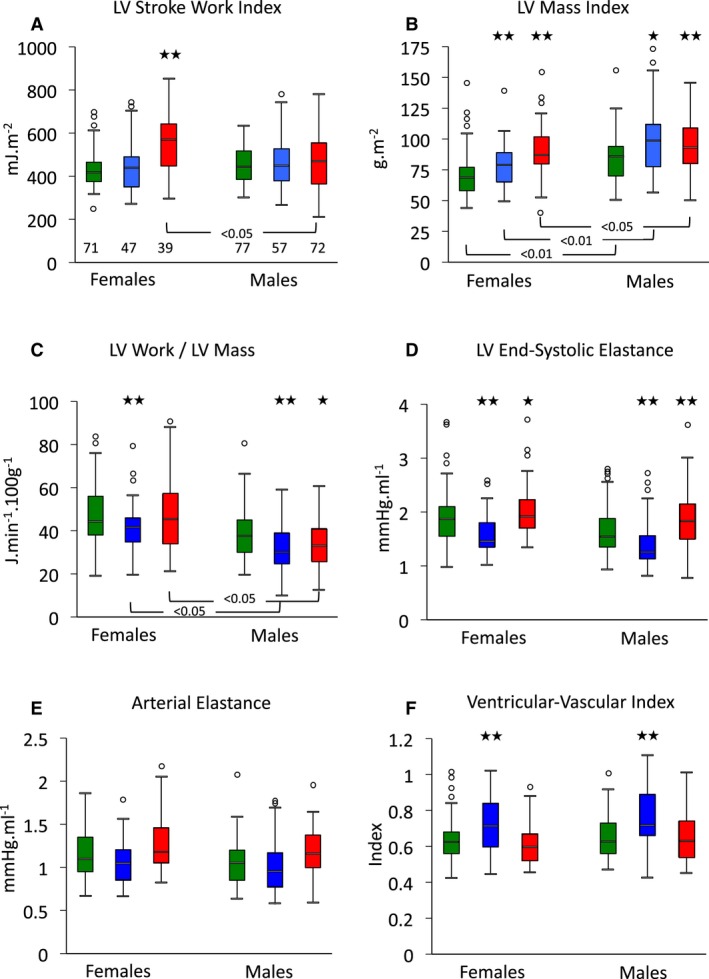
Left ventricular work and ventricular‐vascular coupling according to sex and aortopathy. Data shown for all patients, irrespective of treatment. Left ventricular stroke work index (A), ventricular mass (B), and work per gram of ventricular mass (C), with end‐systolic elastance (D), arterial elastance (E), and ventricular‐vascular coupling index (F) for control (green), Marfan (blue), and ns‐TAAD (red) groups, according to sex. *P<0.05, **P<0.01 vs controls in same sex group. Number of patients in groups is shown in (A). LV indicates left ventricular; ns‐TAAD, non–syndromal thoracic aortic aneurysm and dissection.
Figure 6.
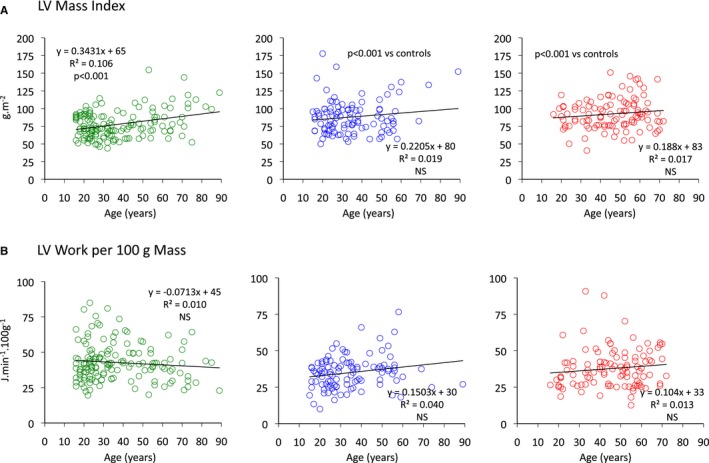
Relationships between age and left ventricular mass index (A) and left ventricular work per unit LV mass (B) for control (green), MFS (blue), and ns‐TAAD (red) groups. LV indicates left ventricular; MFS, Marfan syndrome; ns‐TAAD, non–syndromal thoracic aortic aneurysm and dissection.
Heart rate was lower in both MFS and ns‐TAAD groups than in controls (Table 1). The TIVC and TEJECT were prolonged in MFS but not in ns‐TAAD (Table 2). The greatest increase in TEJECT was observed in MFS patients taking β‐blockers.
Tissue Doppler indices differed between groups; peak systolic contraction velocity S′ and peak early diastolic relaxation velocity E′ were reduced in MFS and ns‐TAAD (Table 2). The A′ velocity was increased in ns‐TAAD but mildly reduced in MFS. The peak S′ did not differ with age in any group. Diastolic filling velocities did change with age; the A′ velocities increased with age and the E′ decreased with age in each group. Neither systolic nor diastolic tissue velocities differed between males and females in any group.
The LV stroke work index (LVSWI) was similar between controls and MFS but was increased in ns‐TAAD, as was LV minute work (Table 3). Similarly, LV power was increased in ns‐TAAD but not MFS compared to controls. There was no difference in LVSWI between males and females in control or MFS groups, although lower LVSWI was observed in males with ns‐TAAD than in females (Figure 5). The LVSWI increased with age in all groups and there was no difference between controls and MFS; however, the relationship differed for ns‐TAAD (Figure 7). The LV minute work per 100 g myocardial mass was reduced for both MFS and ns‐TAAD compared to controls (Table 3), particularly in males (Figure 5). There was no relationship between age and LV work per unit mass in any group (Figure 6).
Table 3.
Left Ventricular Contractility and Work
| Controls | Marfan | ns‐TAAD | |||||||
|---|---|---|---|---|---|---|---|---|---|
| All Patients | No Medication | β‐ Blockers | AgII Blockers | All Patients | No Medication | β‐ Blockers | AgII Blockers | ||
| Ventricular stroke work and power | |||||||||
| LVSWI, mJ·m−2 |
435±60 436 (384–506) |
436±74 445 (366–501) |
427±72 426 (358–493) |
453±74 475 (401–532) |
447±78 498 (400–527) |
492±109**, ‡
504 (386–599) |
506±113 524 (403–606) |
415±75†
382 (351–467) |
503±104 513 (428–604) |
| LV work, J·min−1 |
57±9 58 (49–66) |
55±10 56 (47–65) |
56±14 54 (46–65) |
55±9 57 (47–63) |
59±12 67 (54–82) |
65±13**, ‡
66 (54–77) |
67±13 68 (56–79) |
55±8††
53 (45–61) |
66±12 68 (58–78) |
| LV power, W |
70±10 69 (61–80) |
67±12 68 (57–79) |
66±12 66 (56–79) |
67±11 69 (57–77) |
71±14 83 (64–98) |
77±15**, ‡
80 (64–91) |
80±15 82 (66–94) |
65±10††
64 (54–73) |
78±14 81 (70–93) |
| LV Work/Mass, J·min−1·100 g−1 |
40±9 40 (33–49) |
34±7**
35 (27–40) |
35±7 36 (29–40) |
32±8 31 (25–39) |
34±9 36 (25–46) |
36±9**
36 (27–44) |
37±9 37 (29–46) |
32±8†
28 (25–36) |
36±10 35 (27–45) |
| Ventricular contractility | |||||||||
| dP/dt, mm Hg·s−1 |
1198±250 1170 (977–1447) |
897±199**
912 (723–1101) |
903±216 916 (706–1154) |
878±169 894 (725–1017) |
920±188 913 (832–1046) |
1218±234‡
1237 (1031–1530) |
1207±221 1237 (1037–1517) |
1154±227 1157 (968–1300) |
1282±262 1359 (1084–1546) |
| Ees, mm Hg·mL−1 |
1.65±0.29 1.65 (1.44–1.97) |
1.32±0.19**
1.34 (1.20–1.62) |
1.34±0.19 1.36 (1.22–1.67) |
1.29±0.19 1.28 (1.19–1.42) |
1.33±0.17 1.35 (1.18–1.53) |
1.83±0.30**, ‡
1.80 (1.58–2.17) |
1.84±0.31 1.81 (1.58–2.16) |
1.80±0.33 1.72 (1.59–2.22) |
1.81±0.29 1.82 (1.58–2.02) |
| Ventricular vascular coupling | |||||||||
| Ea, mm Hg·mL−1 |
1.07±0.19 1.08 (0.93–1.27) |
0.99±0.18*
1.02 (0.82–1.19) |
1.05±0.16 1.06 (0.93–1.20) |
0.86±0.17††
0.80 (0.72–0.99) |
1.00±0.20 1.04 (0.79–1.21) |
1.13±0.20*, ‡
1.12 (0.97–1.37) |
1.12±0.19 1.07 (0.99–1.36) |
1.17±0.20 1.17 (1.04–1.42) |
1.12±0.21 1.12 (0.92–1.34) |
| VVI |
0.62±0.07 0.63 (0.57–0.71) |
0.71±0.11**
0.70 (0.63–0.83) |
0.73±0.11 0.72 (0.65–0.84) |
0.67±0.11†
0.66 (0.55–0.76) |
0.71±0.13 0.67 (0.63–0.90) |
0.62±0.09‡
0.62 (0.54–0.71) |
0.61±0.09 0.61 (0.55–0.71) |
0.64±0.10 0.64 (0.58–0.74) |
0.62±0.09 0.62 (0.53–0.71) |
Data shown as weighted mean and SD and as median and interquartile range. AgII indicates angiotensin II; dP/dt, rate of change of left ventricular developed pressure in early systole; Ea, arterial elastance; Ees, left ventricular end‐systolic elastance; LV Power, left ventricular power; LV Work, left ventricular minute work; LV Work/Mass, left ventricular work per 100 g myocardial mass; LVSWI, left ventricular stroke work index; ns‐TAAD, non–syndromal thoracic aortic aneurysm and dissection; VVI, ventricular‐vascular coupling index.
*P<0.05, **P<0.01 vs controls.
† P<0.05, †† P<0.01 vs No medication (within Marfan or ns‐TAAD group).
‡ P<0.01 ns‐TAAD vs Marfan.
Figure 7.

Relationships between age and left ventricular stroke work index (A) and arterial elastance (Ea) (B) for control (green), MFS (blue), and ns‐TAAD (red) groups. LV indicates left ventricular; MFS, Marfan syndrome; ns‐TAAD, non–syndromal thoracic aortic aneurysm and dissection.
Ventricular‐Vascular Coupling
Left ventricular dP/dt was reduced in MFS but similar to controls in ns‐TAAD (Table 3). The LV end‐systolic elastance (Ees) was reduced in MFS but was increased compared to controls in ns‐TAAD. There was no difference in LV Ees between males and females in any group (Figure 5). In the control group, LV Ees increased with age (Figure 8) and a similar relationship was observed for ns‐TAAD. There was only a weak relationship between LV Ees and age in MFS, which differed from controls.
Figure 8.
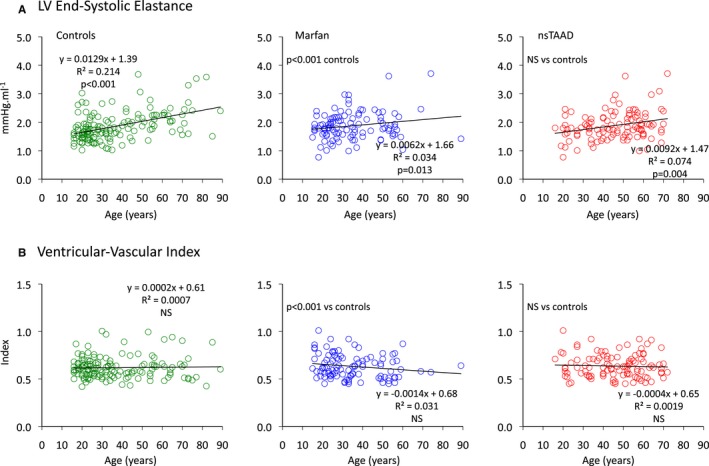
Relationships between age and left ventricular end‐systolic elastance (Ees) (A) and ventricular‐vascular coupling index (B) for control (green), MFS (blue), and ns‐TAAD (red) groups. LV indicates left ventricular; MFS, Marfan syndrome; ns‐TAAD, non–syndromal thoracic aortic aneurysm and dissection.
The arterial elastance (Ea) was greater in ns‐TAAD compared to controls, but was comparable to controls in MFS patients not receiving medication (Table 3). Arterial elastance increased with age in controls and ns‐TAAD, but not in MFS (Figure 7). The ventricular vascular coupling ratio (VVI) was increased in MFS but similar to controls in ns‐TAAD. There was no difference in Ea or VVI between males and females in any group (Figure 5). The VVI did not change with age in any group (Figure 8).
Effect of β‐Blockers on Ventricular‐Vascular Coupling in MFS and ns‐TAAD
Patients taking β‐blockers in the MFS and ns‐TAAD groups were of similar age and demographics to those without β‐blockers (Table 1). Among MFS patients taking β‐blockers, heart rate was lower than in MFS without β‐blockers. Among ns‐TAAD patients taking β‐blockers, neither heart rate nor Pes differed significantly from ns‐TAAD patients without β‐blockers. There was no discernible effect of β‐blockers on aortic stiffness.
The LV end‐diastolic volume index, LV stroke volume index, and LV ejection fraction were greater in MFS patients taking β‐blockers than in those without (Table 2), although cardiac index and SVRI did not differ. Among ns‐TAAD patients taking β‐blockers, the LV end‐diastolic volume index and LV stroke volume index and LV ejection fraction did not differ from those without β‐blockers, although cardiac index was slightly less. The LV mass index did not differ between those taking β‐blockers and those without in either the MFS or ns‐TAAD groups. β‐Blockers did not further prolong TIVC in MFS; however, both TEJECT and TSYS were prolonged by β‐blockers in MFS.
The tissue Doppler indices were similar for those taking β‐blockers and those without in both MFS and ns‐TAAD groups (Table 2). Among the MFS patients, the LVSWI and LV minute work did not differ between those taking β‐blockers and those without (Table 3) and the LV work per gram LV mass was also similar for those with and without β‐blockers. Among the ns‐TAAD patients, those taking β‐blockers had lower LVSWI, LV minute work, and LV work per 100 g LV mass than did those without β‐blockers.
The LV dP/dt and Ees did not differ between those taking β‐blockers and those without β‐blockers for either the MFS or ns‐TAAD groups. Among MFS patients, those taking β‐blockers had lower Ea and lower VVI than did those without β‐blockers. In contrast, among the ns‐TAAD group, Ea and VVI did not differ between those taking β‐blockers and those without.
Effect of Angiotensin II Receptor Antagonists on Ventricular‐Vascular Coupling in MFS and ns‐TAAD
Among the MFS patients, those taking angiotensin II (AgII) antagonists were slightly older than those without; otherwise, demographics of those taking AgII antagonists in the MFS and ns‐TAAD groups were similar to those not taking AgII antagonists (Table 1). Heart rate and blood pressure did not significantly differ from controls or from those without AgII antagonists in either the MFS or ns‐TAAD groups. Aortic geometry was similar for those with and without AgII antagonists in both MFS and ns‐TAAD groups.
LV volumes, cardiac index, and SVRI were similar for those taking AgII antagonists and those without in the MFS and ns‐TAAD groups, as were systolic time intervals and tissue Doppler indices (Table 2). In both MFS and ns‐TAAD groups, LV work was similar for those with and without AgII antagonists (Table 3). Indices of LV contractility, including dP/dt and Ees, were unchanged by AgII antagonists in either the MFS or ns‐TAAD groups (Table 3). Similarly, both Ea and VVI were unchanged by AgII antagonists in the MFS and ns‐TAAD groups.
Determinants of Ventricular‐Vascular Coupling Index
Univariate predictors of the VVI are summarized in Table 4. The most significant predictors included aortopathy group, LV end‐systolic volume index, LV dP/dt, LVSWI, and tissue Doppler S′ velocity. There was no relationship between age, sex, or aortic stiffness and VVI.
Table 4.
Predictors of Ventricular‐Vascular Coupling Index
| Univariate | ||||
|---|---|---|---|---|
| Variable | Standardized ß | t statistic | Significance | R 2 |
| Group | 0.362 | 6.442 | <0.0001 | 0.131 |
| LVEDVI | −0.114 | −1.909 | 0.057 | 0.013 |
| LVESVI | 0.375 | 6.710 | <0.0001 | 0.140 |
| LV dP/dt | −0.705 | −16.534 | <0.0001 | 0.496 |
| Pes | −0.057 | −0.956 | 0.340 | 0.003 |
| LVSWI | −0.287 | −4.969 | <0.0001 | 0.082 |
| SVRI | 0.207 | 3.519 | 0.001 | 0.039 |
| Age | −0.060 | −1.006 | 0.315 | 0.004 |
| Sex | −0.054 | −0.900 | 0.369 | 0.003 |
| Ao stiffness | 0.029 | 0.471 | 0.638 | 0.001 |
| S′ velocity | −0.318 | −5.136 | <0.0001 | 0.097 |
| Multivariate | |||
|---|---|---|---|
| Variable | Standardized ß | t statistic | Significance |
| (Constant) | 20.714 | <0.0001 | |
| LVESVI | 0.317 | −9.713 | <0.0001 |
| LVSWI | −0.150 | −4.333 | <0.0001 |
| Group | 0.166 | 4.650 | <0.0001 |
| LV dP/dt | −0.532 | −14.647 | <0.0001 |
| SVRI | 0.199 | 6.166 | <0.0001 |
| β‐blocker | −0.111 | −3.269 | 0.001 |
Model for all patients in study. Model R 2=0.641; SEE=0.082; P<0.0001. Ao indicates aorta; LV dP/dt, rate of change in left ventricular pressure in early systole; LVEDVI, left ventricular end‐diastolic volume index; LVESVI, left ventricular end‐systolic volume index; LVSWI, left ventricular stroke work index; Pes, end‐systolic blood pressure; S′, systolic mitral annular velocity; SVRI, systemic vascular resistance index.
A multivariate model, which describes approximately two thirds of the variance in VVI, is summarized in Table 4. The LV volumes, contractility (LV dP/dt), and SVRI were significant independent predictors, as was the aortopathy group and use of β‐blockers.
Clinical Correlation of Ventricular‐Vascular Coupling
The distributions of VVI are compared for controls, MFS, and ns‐TAAD in Figure 9. The controls and the ns‐TAAD patients exhibit essentially normal distributions with limited skewness towards higher VVI values in a small number of patients. In contrast, MFS appears to be associated with a bimodal distribution, with a second peak in VVI values ≥0.80.
Figure 9.
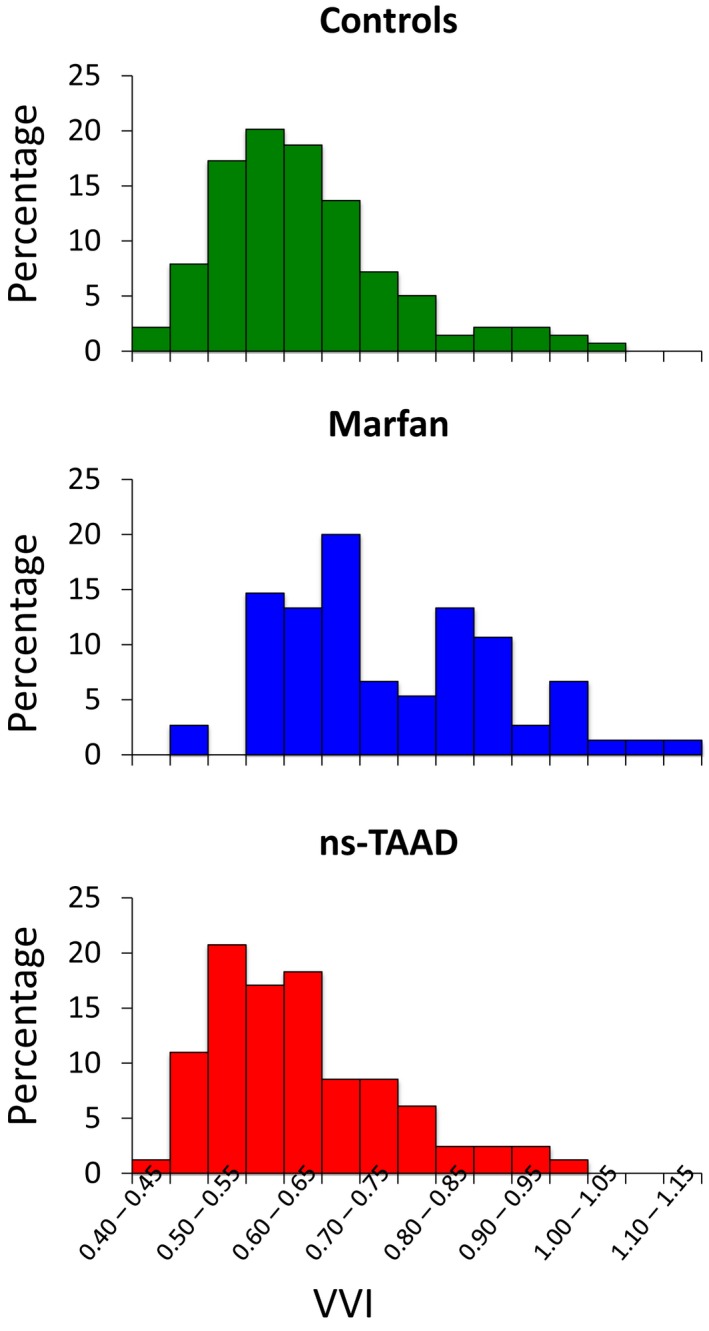
Distribution of VVI between controls, MFS, and ns‐TAAD. Data are shown for patients in each group receiving no medication. The proportion of MFS patients with VVI ≥0.8 was 31% compared to 7% of controls and 10% of ns‐TAAD (P<0.001 for both control and ns‐TAAD vs MFS). MFS indicates Marfan syndrome; ns‐TAAD, non–syndromal thoracic aortic aneurysm and dissection; VVI, ventricular‐vascular index.
There were 32 (31%) MFS patients with VVI ≥0.8, of whom 12 were female compared to 35 of the 72 with VVI <0.80 (NS). There was no difference in age between those with VVI ≥0.80 (32±15 years) and those with VVI <0.80 (32±14). Those with VVI ≥0.80 had lower peak S′ than those with VVI <0.80 (6.9±2.1 versus 8.1±1.6 cm·s−1, P=0.01) and also lower LVSWI (398±87 versus 471±117 mJ·m−2, P=0.006).
There was familial clustering of MFS patients with VVI ≥0.80 with 4 pedigrees including 12 of the patients. Among the patients with VVI ≥0.80, 22 had known FBN1 mutations, of which 13 were missense, 3 were premature stop codons, and 6 were insertion/deletions or splice site variants. Among the MFS patients with VVI <0.80, 39 had known FBN1 mutations of which 21 were missense, 9 were stop codons, and 9 were insertion/deletions or splice site variants.
Among the MFS patients with VVI ≥0.80, 1 died suddenly and 1 died of heart failure during the study period. Another developed clinical heart failure during the study period. Three other MFS patients with VVI ≥0.80 had first degree‐relatives who died with heart failure. None of the MFS patients with VVI <0.80 developed heart failure and none died during the study period. None of the ns‐TAAD patients had heart failure and none died during the study period.
Discussion
This study compared LV systolic function and ventricular‐vascular coupling in patients with MFS and ns‐TAAD aortopathies and describes impaired coupling in MFS but not in ns‐TAAD. The degree of abnormal ventricular‐vascular coupling in MFS is independent of aortic stiffness, appears to have a significant genetic foundation, and is partly reversed by β‐blockers.
Ventricular‐Vascular Coupling in Genetic Aortopathy
Previous studies of LV function in MFS have been discordant with some reporting impaired contractility,11, 12, 13 and others observing no difference in ventricular function between controls and MFS.15, 16 Several factors may be responsible for this discrepancy, including patient selection, use of load‐dependent measures of ventricular function, and inclusion of patients taking β‐adrenergic blockers. Our understanding has been further clouded by uncertainty about the relative contributions of altered afterload, consequent upon increased aortic stiffness, and intrinsic impairment of myocardial contractility to ventricular‐vascular coupling in MFS. Studies using tissue Doppler measurements of myocardial function have been reported for MFS;27, 28 however, these indices can also be affected by ventricular afterload.29 This study therefore documented the LV end‐systolic pressure‐volume relation, and ventricular‐vascular index, in order to better account for issues of ventricular loading.30
Increased aortic stiffness and systemic vascular resistance are features of aging, and are associated with increased systolic blood pressure and pulse pressure. In both MFS and ns‐TAAD, aortic stiffness is increased beyond controls of similar age; however, the blood pressure responses differ. In the ns‐TAAD group, both PSys and PPulse are significantly greater than controls; however, this was not observed in MFS. Although the ns‐TAAD group was a decade older than the control and MFS groups, the difference in blood pressure and SVRI was still observed after age was taken into account. These findings suggest an intrinsic change in systemic vasoregulation in ns‐TAAD, which will require future investigation.
The present data show that ventricular‐vascular coupling may be altered in MFS but is preserved in ns‐TAAD. The most likely underlying cause is an intrinsic impairment of myocardial contractility in MFS, and the current observations of reduced LV dP/dt, tissue S′, and Ees are consistent with such. There was no significant relationship between aortic stiffness and Ees. These observations are concordant with a report of abnormal end‐systolic pressure‐volume relations in mice with MFS.10 As fibrillin1 is an important component of the extracellular microfibrils, the most likely mechanism of such impairment is altered myocardial force development, consequent upon abnormal coupling of myocytes to the extracellular connective tissue, via integrins and the microfibrils.31 The present observations of prolonged TIVC in MFS are also consistent with impaired myocardial force generation.
The observed impairment of ventricular contractility and abnormal VVI in MFS is a relatively subtle finding and appears to affect only approximately one third of patients. A similar observation was reported from data collected by the GenTAC registry.10 This intragroup variability may explain some of the previously discrepant findings about ventricular function in MFS.
Increased LV mass was observed in the MFS group in the absence of increased blood pressure, and this finding is consistent with findings in MFS mice,10 in which LV hypertrophy is observed, as an apparent compensatory response to impaired contractility. The resting LV work per unit mass of myocardium was reduced in the MFS group, indicating that hypertrophy alone does not appear to fully compensate for impaired contractility. Increased LV mass was also observed in the ns‐TAAD group, consistent with the increased blood pressure and LV work in this group. Interestingly, the resting LV work per unit mass of myocardium was also less than controls in the ns‐TAAD group, most likely reflecting exercise‐related hemodynamics and stimulus to myocardial growth.
Determinants of Ventricular‐Vascular Coupling Index
The ventricular‐vascular coupling index is described as the ratio Ea/Ees and in this study, the changes in VVI resulted from changes in Ees rather than changes in Ea except for MFS patients taking β‐blockers. The Ea is a lumped variable describing ventricular afterload and is influenced by systemic vascular resistance and blood pressure.30 The Ea is not a measure of aortic stiffness and there was no correlation with aortic stiffness in the present study groups. The Ees is often described as a measure of intrinsic myocardial contractility; however, this is subject to several caveats, including some afterload influence and a nonlinear end‐systolic pressure‐voluem relation. Notwithstanding this, the ratio Ea/Ees is a useful descriptor of ventricular‐vascular coupling, provided its limitations are recognized. In clinical studies, mean Ea/Ees ratios are reported as 0.6 to 0.8; however, LV stroke work and efficiency remain at >90% optimal levels for a wide range of Ea/Ees from 0.3 to 1.3.32
We found no greater deterioration in LV function or VVI with age, consistent with an earlier report.33 Differences in LV contractility have been reported for men and women,34 particularly in older individuals,35 but no such differences were observed in the present study groups, although smaller numbers among older MFS patients may have obscured some differences. Although ns‐TAAD appears to be more prevalent in males than females, there were no differences in aortic geometry or hemodynamics between sexes in MFS or ns‐TAAD.
The principal independent predictors of VVI in multivariate analysis were LV systolic volume indices, LV contractility (as indexed by LV dP/dt), and systemic vascular resistance. Aortopathy group was also a significant independent predictor of VVI. Finally, treatment with β‐blockers was also a predictor of VVI.
Protective Effects of Medication in MFS
There is a body of evidence supporting a benefit of β‐blockers in reducing the rate of aortic dilatation in MFS. Within the constraints of a nonrandomized study, the present data suggest additional potential benefit of β‐blockers, with some normalization of VVI in MFS receiving β‐blockers. Treatment with β‐blockers did not affect Ees in either the MFS or ns‐TAAD groups.
The lower VVI in the MFS β‐blocker group reflects a lower Ea, which is consequent upon a greater LV stroke volume with lower heart rate. The protective effect of β‐blockers in patients with heart failure is well established and the present findings suggest that β‐blockers may have additional benefit for patients with MFS. This hypothesis should be further explored in a randomized study.
The use of renin–angiotensin–aldosterone system inhibitors may also be of benefit for protection of the aorta in MFS and is also well established for treatment of heart failure. There was no benefit of renin–angiotensin–aldosterone system inhibitors upon VVI observed in MFS patients; however, the numbers of patients in the present study are small and the benefit of these drugs upon LV function in MFS should be examined in a randomized study.
Clinical Implications
The present findings indicate that those MFS patients with a higher VVI (≥0.80) appear to be identifiable as a high‐risk group. These individuals had a greater incidence of clinical heart failure and death during the study period than did those with lower VVI. Interestingly, there appears to be familial clustering of individuals with abnormal VVI. A correlation between non‐missense FBN1 mutations and impaired LV function has been described,36, 37 although such a pattern was not evident in the present MFS group. Thus, the VVI may be useful as a novel risk stratifier for individuals with MFS. This would be consistent with data from the heart failure population, in whom an abnormal VVI is indeed associated with a more adverse prognosis.38 Our findings support the conclusion of laboratory studies that the LV in MFS may have impaired tolerance to increased hemodynamic load. Thus, clinicians should consider earlier intervention for valve lesions such as mitral regurgitation for individuals with MFS. Individuals with MFS and a family history of heart failure should have close follow‐up of LV function as well as aortic geometry and valve function.
The calculation of Ees and VVI are not part of standard clinical echocardiography; however, the actual direct measurements required for the calculation of these parameters are straightforward and in routine use, such as stroke volume. Additional measurements of systolic timing intervals are easily obtained from ECG and Doppler recordings. With the availability of these basic measurements, calculation of Ees and VVI can be easily undertaken with a spreadsheet with the relevant formulae embedded. The use of more advanced echocardiography techniques, including strain and 3‐dimensional volumetrics, is also likely to yield clinically useful information and should be examined in future studies of clinical outcomes.
Study Limitations
The present study was a consecutive series of patients recruited over several years. Comparisons between patients receiving β‐blockers or renin–angiotensin–aldosterone system antagonists and those without medication are not randomized. Future study of β‐blockers and ventricular vascular coupling in MFS patients may be warranted, including prognostic studies in higher risk MFS patients. Our present observations were acquired with subjects under resting conditions, and the question of how the LV responds to exercise in MFS and ns‐TAAD will also warrant investigation. Finally, our clinical data suggest that VVI may be a useful prognostic marker for MFS; however, this should be investigated in a future longitudinal study.
Conclusions
LV contractility and ventricular‐vascular coupling are abnormal in MFS, but are preserved in ns‐TAAD. The impaired function appears to be intrinsic to the MFS ventricle and is independent of aortic stiffness. The ventricular‐vascular index may serve as an identifier of MFS individuals at higher risk of heart failure and sudden death, whereas β‐blockers may partially reverse abnormal ventricular‐vascular coupling in these patients.
Disclosures
None.
(J Am Heart Assoc. 2016;5:e003705 doi: 10.1161/JAHA.116.003705)
References
- 1. Redfield MM, Jacobsen SJ, Borlaug BA, Rodeheffer RJ, Kass DA. Age‐ and gender‐related ventricular‐vascular stiffening: a community‐based study. Circulation. 2005;112:2254–2262. [DOI] [PubMed] [Google Scholar]
- 2. Laurent S, Boutouyrie P, Lacolley P. Structural and genetic bases of arterial stiffness. Hypertension. 2005;45:1050–1055. [DOI] [PubMed] [Google Scholar]
- 3. Borlaug BA, Redfield MM, Melenvsky V, Kane GC, Karon BL, Jacobsen SJ, Reodeheffer RJ. Longitudinal changes in left ventricular stiffness: a community‐based study. Circ Heart Fail. 2013;6:944–952. [DOI] [PMC free article] [PubMed] [Google Scholar]
- 4. McEniery CM, Yasmin Y, Hall IR, Qasem A, Wilkinson IB, Cockcroft JR. Normal vascular ageing: differential effects on wave reflection and aortic pulse wave velocity. J Am Coll Cardiol. 2005;46:1753–1760. [DOI] [PubMed] [Google Scholar]
- 5. Baumgartner D, Baumgartner C, Schermer E, Engl G, Schweigmann U, Matyas G, Steinmann B, Stein JI. Different patterns of aortic wall elasticity in patients with Marfan syndrome: a noninvasive follow‐up study. J Thorac Cardiovasc Surg. 2006;132:811–819. [DOI] [PubMed] [Google Scholar]
- 6. de Wit A, Vis K, Jeremy RW. Aortic stiffness in heritable aortopathies: relationship to aneurysm growth rate. Heart Lung Circ. 2013;22:3–11. [DOI] [PubMed] [Google Scholar]
- 7. van der Linde D, van de Laar IM, Bertoli‐Avella AM, Oldenburg RA, Bekkers JA, Mattace‐Raso FU, van den Meiracker AH, Moelker A, van Kooten F, Frohn‐Mulder IM, Timmermans J, Moltzer E, Cobben JM, van Laer L, Loeys B, De Backer J, Coucke PJ, De Paepe A, Hilhorts‐Hofstee Y, Wessels MW, Roos‐Hesselink JW. Aggressive cardiovascular phenotype of aneurysms‐osteoarthritis syndrome caused by pathogenic SMAD3 variants. J Am Coll Cardiol. 2012;60:397–403. [DOI] [PubMed] [Google Scholar]
- 8. Lee WS, Nakayama N, Huang WP, Chiou KR, Wu CC, Nevo E, Fetics B, Kass DA, Ding PY, Chen CH. Assessment of left ventricular end‐systolic elastance from aortic pressure‐left ventricular volume relations. Heart Vessels. 2002;16:99–104. [DOI] [PubMed] [Google Scholar]
- 9. Roman MJ, Ganau A, Saba PS, Pini R, Pickering TG, Devereux RB. Impact of arterial stiffening on left ventricular structure. Hypertension. 2000;36:489–494. [DOI] [PubMed] [Google Scholar]
- 10. Cook JR, Carta L, Benard L, Chemaly ER, Chiu E, Rao SK, Hampton TG, Yurchenco P; GenTAC Registry Consortium , Costa KD, Hajjar RJ, Ramirez F. Abnormal muscle mechanosignaling triggers cardiomyopathy in mice with Marfan syndrome. J Clin Invest. 2014;124:1329–1339. [DOI] [PMC free article] [PubMed] [Google Scholar]
- 11. De Backer JF, Devos D, Segers P, Matthys D, Francois K, Gillebert TC, De Paepe AM, De Sutter J. Primary impairment of left ventricular function in Marfan syndrome. Int J Cardiol. 2006;112:353–358. [DOI] [PubMed] [Google Scholar]
- 12. Kiotsekoglou A, Moggridge JC, Bijnens BH, Kapetanakis V, Alpendurada F, Mullen MJ, Saha S, Nassiri DK, Camm J, Sutherland GR, Child AH. Biventricular and atrial diastolic function assessment using conventional echocardiography and tissue‐Doppler imaging in adults with Marfan syndrome. Eur J Echocardiogr. 2009;10:947–955. [DOI] [PubMed] [Google Scholar]
- 13. Alpendurada F, Wong J, Kiotsekoglou A, Banya W, Child A, Prasad SK, Pennell DJ, Mohiaddin RH. Evidence for Marfan cardiomyopathy. Eur J Heart Fail. 2010;12:1085–1091. [DOI] [PubMed] [Google Scholar]
- 14. de Witte P, Aalberts JJ, Radonic T, Timmermans J, Scholte AJ, Zwinderman AH, Mulder BJ, Groenink M, van den Berg MP. Intrinsic biventricular dysfunction in Marfan syndrome. Heart. 2011;97:2063–2068. [DOI] [PubMed] [Google Scholar]
- 15. Savolainen A, Nisula L, Keto P, Hekali P, Viitasalo M, Kaitila I, Kupari M. Left ventricular function in children with the Marfan syndrome. Eur Heart J. 1994;15:625–630. [DOI] [PubMed] [Google Scholar]
- 16. Meijboom LJ, Timmermans J, van Tintelen JP, Nollen GJ, De Backer J, van den Berg MP, Boers GH, Mulder BJM. Evaluation of left ventricular dimensions and function in Marfan's syndrome without significant valvular regurgitation. Am J Cardiol. 2005;95:795–797. [DOI] [PubMed] [Google Scholar]
- 17. Singh MN, Lacro RV. Recent clinical drug trials evidence in Marfan syndrome and clinical implications. Can J Cardiol. 2016;32:66–77. [DOI] [PubMed] [Google Scholar]
- 18. Devereux RB, de Simone G, Arnett DK, Best LG, Boerwinkle E, Howard BV, Kitzman D, Lee ET, Mosley TH Jr, Weder A, Roman MJ. Normal limits in relation to age, body size and gender of two‐dimensional echocardiographic aortic root dimensions in persons ≥ 15 years of age. Am J Cardiol. 2012;110:1189–1194. [DOI] [PMC free article] [PubMed] [Google Scholar]
- 19. Loeys BL, Dietz HC, Braverman HC, Callewaert BL, de Backer J, Devereux RB, Hilhorst‐Hofstee Y, Jondeau G, Faivre L, Milewicz DM, Pyeritz RE, Sponseller PD, Wordsworth P, De Paepe AM. The revised Ghent nosology for the Marfan syndrome. J Med Genet. 2010;47:476–485. [DOI] [PubMed] [Google Scholar]
- 20. McEniery CM, Cockcroft JR, Roman MJ, Franklin SS, Wilkinson IB. Central blood pressure: current evidence and clinical importance. Eur Heart J. 2014;35:1719–1725. [DOI] [PMC free article] [PubMed] [Google Scholar]
- 21. Lang RM, Bierig M, Devereux RB, Flachskampf FA, Foster E, Pellikka PA, Picard MH, Roman MJ, Seward J, Shanewise JS, Solomon SD, Spencer KT, St John Sutton M, Stewart WJ. Recommendations for chamber quantification: a report from the American Society of Echocardiography's Guidelines and Standards Committee and the Chamber Quantification Writing Group, developed in conjunction with the European Association of Echocardiography, a branch of the European Society of Cardiology. J Am Soc Echocardiogr. 2005;18:1440–1463. [DOI] [PubMed] [Google Scholar]
- 22. Quinones MA, Otto CM, Stoddard M, Waggoner A, Zoghbi WA. Recommendations for quantification of Doppler echocardiography: a report from the Doppler quantification Task Force of the Nomenclature and Standards Committee of the American Society of Echocardiography. J Am Soc Echocardiogr. 2002;15:167–184. [DOI] [PubMed] [Google Scholar]
- 23. Mor‐Avi V, Lang RM, Badano LP, Belohlavek M, Cardim NM, Derumeaux G, Galderisi M, Marwick T, Nagueh SF, Sengupta PP, Sicari R, Smiseth OA, Smulevitz B, Takeuchi M, Thomas JD, Vannan M, Voigt J‐U, Zamorano JL. Current and evolving echocardiographic techniques for the quantitative evaluation of cardiac mechanics: ASE/EAE consensus statement on methodology and indications. Endorsed by the Japanese Society of Echocardiography. J Am Soc Echocardiogr. 2011;24:277–313. [DOI] [PubMed] [Google Scholar]
- 24. Schramm W. The units of measurement of the ventricular stroke work: a review study. J Clin Monit Comput. 2010;24:213–217. [DOI] [PubMed] [Google Scholar]
- 25. Chen CH, Fetics B, Nevo E, Rochitte CE, Chiou K‐R, Ding Y‐A, Kawaguchi M, Kass DA. Non‐invasive single beat determination of left ventricular end‐systolic elastance in humans. J Am Coll Cardiol. 2001;38:2028–2034. [DOI] [PubMed] [Google Scholar]
- 26. Regeth RA, Stine WW. Comparing means from nonnormal distributions: the bisquare‐weighted analysis of variance. Behav Res Methods Instrum Comput. 1998;30:707–712. [Google Scholar]
- 27. Porciani MC, Giurlani L, Chelucci A, Pepe G, Giusti BH, Brunelli T, Attanasio M, Martinucci P, Fattrori R, Abbatea R, Gensini GF. Diastolic subclinical primary alterations in Marfan syndrome and Marfan‐related disorders. Clin Cardiol. 2002;25:416–420. [DOI] [PMC free article] [PubMed] [Google Scholar]
- 28. Angtuaco MJ, Vyas HV, Malik S, Holleman BN, Gossett JM, Sachdeva R. Early detection of cardiac dysfunction by strain and strain rate imaging in children and young adults with Marfan syndrome. J Ultrasound Med. 2012;31:1609–1616. [DOI] [PubMed] [Google Scholar]
- 29. Donal E, Bergerot C, Thibault H, Ernande L, Loufoua J, Augeul L, Ovize M, Derumeaux G. Influence of afterload on left ventricular radial and longitudinal systolic functions: a two‐dimensional strain imaging study. Eur J Echocardiogr. 2009;10:914–921. [DOI] [PubMed] [Google Scholar]
- 30. Chirinos JA. Ventricular‐arterial coupling: invasive and non‐invasive assessment. Artery Res. 2013:7:201. doi 10.1016/j.artres.2012.12.002. [DOI] [PMC free article] [PubMed] [Google Scholar]
- 31. Parker KR, Ingber DE. Extracellular matrix, mechanotransduction and structural hierarchies in heart tissue engineering. Philos Trans R Soc Lond B Biol Sci. 2007;362:1267–1279. [DOI] [PMC free article] [PubMed] [Google Scholar]
- 32. De Tombe PP, Jones S, Burkhoff D, Hunter WC, Kass DA. Ventricular stroke work and efficiency both remain nearly optimal despite altered vascular loading. Am J Physiol. 1993;264:H1817–H1824. [DOI] [PubMed] [Google Scholar]
- 33. Scherptong RW, Vliegen HW, van der Wall EE, Hilhorst‐Hoftsee Y, Bax JJ, Scholte AJ, Delgado V. Biventricular performance in patients with Marfan syndrome without significant valvular disease: comparison to normal subjects and longitudinal follow‐up. J Am Soc Echocardiogr. 2011;24:1392–1399. [DOI] [PubMed] [Google Scholar]
- 34. Hayward CS, Kalnins WV, Kelly RP. Gender‐related differences in left ventricular chamber function. Cardiovasc Res. 2001;49:340–350. [DOI] [PubMed] [Google Scholar]
- 35. Claessens TE, Rietzschel ER, De Buyzere ML, De Bacquer D, De Backer G, Gillebert TC, Verdonck PR, Segers P. Noninvasive assessment of left ventricular and myocardial contractility in middle‐aged men and women: disparate evolution above the age of 50? Am J Physiol (Heart Circ Physiol). 2007;292:H856–H865. [DOI] [PubMed] [Google Scholar]
- 36. Aalbert JJ, van Tintelen JP, Meijboom LJ, Polko A, Jongbloed JD, van der Wal H, Pals G, Osinga J, Timmermans J, de Backer J, Bakker MK, van Veldhuisen DJ, Hofstra RM, Mulder BJ, van den Berg MP. Relation between genotype and left‐ventricular dilatation in patients with Marfan syndrome. Gene. 2014;534:40–43. [DOI] [PubMed] [Google Scholar]
- 37. El Rahman MA, Haase D, Rentzsch A, Olchvary J, Schafers H‐J, Henn W, Wagenpfeil S, Abdul‐Khaliq H. Left ventricular systolic dysfunction in asymptomatic Marfan syndrome patients is related to the severity of gene mutation: insights from the novel speckle tracking echocardiography. PLoS One. 2015;10:e0124112. [DOI] [PMC free article] [PubMed] [Google Scholar]
- 38. Ky B, French B, Khan AM, Plappert T, Wang A, Chirinos JA, Fang JC, Sweitzer NK, Borlaug BA, Kass DA, St. John Sutton M, Cappola TP. Ventricular‐arterial coupling, remodelling, and prognosis in heart failure. J Am Coll Cardiol. 2013;62:1165–1172. [DOI] [PMC free article] [PubMed] [Google Scholar]