

Abstract
Background
Coronary microcirculatory dysfunction portends a poor cardiovascular outcome. Invasive assessment of microcirculatory dysfunction by coronary flow reserve (CFR) and hyperemic microvascular resistance (HMR) is affected by coronary artery disease (CAD). In this study we propose minimal microvascular resistance (mMR) as a new measure of microcirculatory dysfunction and aim to determine whether mMR is influenced by CAD.
Methods and Results
We obtained 482 simultaneous measurements of intracoronary Doppler flow velocity and pressure. The mMR is defined as the ratio between distal coronary pressure and flow velocity during the hyperemic wave‐free period. Measurements were divided into 2 cohorts. Cohort 1 was a paired analysis involving 81 pairs with a vessel with and without CAD to investigate whether HMR, CFR, and mMR are modulated by CAD. CFR was lower, and HMR was higher, in vessels with CAD than in vessels without CAD: 2.12±0.79 versus 2.56±0.63 mm Hg·cm−1·s, P<0.001, and 2.61±1.22 versus 2.31±0.89 mm Hg·cm−1·s, P=0.04, respectively. mMR was equal in vessels with and without CAD: 1.54±0.77 versus 1.53±0.57 mm Hg·cm−1·s, P=0.90. Differences for CFR occurred when FFR was 0.60 to 0.80 or ≤0.60 but not when FFR ≥0.80. For HMR, the difference occurred only when FFR ≤0.60. For mMR, no difference was observed in any FFR stratum. Cohort 2 was used for validation and showed significant relationships for CFR and HMR with FFR: Pearson r=0.488, P<0.001 and −0.159, P=0.03, respectively; mMR had no association with FFR: Pearson r=0.055; P=0.32.
Conclusions
mMR is a novel index to assess microcirculatory dysfunction and is not modified by the presence of obstructive CAD.
Keywords: coronary flow, microcirculation, microvascular dysfunction, resistance
Subject Categories: Coronary Circulation, Stenosis, Atherosclerosis
Introduction
The presence of inducible myocardial ischemia adversely affects patient prognosis.1 Myocardial ischemia is orchestrated by a complex interplay between obstructive coronary artery disease (CAD) and microcirculatory dysfunction (MCD).2 In the absence of angiographic CAD, an impaired coronary flow reserve (CFR) is a predictor of major adverse cardiac events.3 The presence of MCD thus bears important prognostic implications, and its documentation could aid in identifying patients at high risk of adverse outcome. Moreover, a reduced CFR is associated with cardiovascular outcomes independently of angiographic CAD.4, 5 Unfortunately, a distinction between the contributions of the epicardial and microcirculatory vasculature to myocardial ischemia cannot be made on the basis of CFR alone, given that it is influenced by both.6 Knowledge of the invasively measured distal coronary pressure is required to make this distinction.6 Simultaneous acquisition of coronary blood flow and pressure distal to the stenosis allows the resistance of the microcirculatory compartment to be calculated. For this reason invasive measurement of microcirculatory resistance better delineates the specific contribution of the microcirculatory compartment to myocardial ischemia. Nevertheless, multiple studies have demonstrated that invasive hyperemic microcirculatory resistance is higher in hemodynamically severe stenosis.7, 8, 9, 10, 11 For this reason it is difficult to assess whether a high microcirculatory resistance is caused by MCD or by obstructive CAD. If wedge pressure is taken into account, microcirculatory resistance may not depend on epicardial stenosis severity.7, 12 Assessment of wedge pressure requires balloon occlusion of the coronary artery and is therefore laborious. Alternatively, a correction formula has been proposed by Yong et al that does not require balloon occlusion.13 However, it has been contested whether wedge pressure accurately reflects the pressure generated by the collateral arteries in the first place.14
An alternative approach for the assessment of microcirculatory resistance is phasic analyses of the coronary pressure‐flow relationship during diastole because the exclusion of systole could provide more detailed insights into determinants of myocardial perfusion than traditional means‐per‐beat methods.15, 16 Here we propose using the minimal microvascular resistance (mMR) as a method to identify MCD measured during the wave‐free period window. In this study we investigate the hypothesis that mMR is not modulated by the presence of obstructive CAD, unlike CFR and HMR, which are traditionally used to assess MCD.
Methods
Study Population
For this study, data were used from the Iberian‐Dutch‐English (IDEAL) collaborators study.9 In brief, the IDEAL study involved simultaneously acquired coronary pressure and flow velocity data collected in 4 European academic hospitals. Exclusion criteria were significant valvular heart disease, weight >200 kg, previous coronary artery bypass surgery, nonischemic cardiomyopathy, and acute myocardial infarction within 48 hours of the procedure. Measurements were not acquired in vessels supplying previously known infarcted territories, angiographically identifiable myocardial bridging, or collateral arteries. The study was approved by the institutional review committees, and all subjects gave informed consent.
Coronary Catheterization
Coronary angiography and pressure‐flow assessments of coronary stenoses were performed using conventional approaches via either the femoral or radial artery. Measurements were obtained using a coronary guidewire equipped with a distal pressure and Doppler flow velocity sensor (Combowire XT, Volcano Corporation, San Diego, CA) after the administration of intracoronary nitrates (200‐300 μg). After coronary angiography, the Combowire was introduced, and the pressure sensor was equalized with aortic pressure. Subsequently, the wire was advanced at least 3 vessel diameters distal to the stenosis, or in the distal third part of the coronary artery if angiographic CAD was absent. Doppler flow velocity and aortic and distal pressure were first measured under resting conditions. Subsequently, hyperemia was induced by administration of adenosine either intracoronary (60‐ to 150‐μg bolus injection) or intravenously (140 μg·kg−1·min−1), and measurements were repeated. At the end of the procedure, pressure drift was assessed. If pressure drift was identified (>2 mm Hg) measurements were repeated or corrected for during off‐line analysis.
Hemodynamic Parameters
Phasic analysis was done using an automated MATLAB script (MathWorks, Natick, MA) with built‐in algorithm to detect the wave‐free period window (developed at Imperial College, London and licensed to Volcano Corp, San Diego, CA) as previously described.17 Aortic pressure, distal coronary pressure, and instantaneous peak Doppler flow velocity were averaged over a minimum of 3 heartbeats during resting and hyperemic conditions. This was done for the whole cardiac cycle as well as for the wave‐free period window and the systolic window specifically. The wave‐free period window was identified as starting 25% of the way into diastole (marked by the aortic dicrotic notch) and ending 5 milliseconds before systole. Systole was defined as starting at the R peak on the electrocardiogram and ending at the dicrotic notch on the aortic pressure trace. Three indices to measure MCD were calculated: CFR, HMR, and mMR (Figure 1). CFR was defined as the ratio between hyperemic and resting averaged peak Doppler flow velocity (APV). HMR was calculated as the ratio between hyperemic distal coronary pressure and hyperemic APV, but during the whole cardiac cycle instead. mMR was calculated as the ratio of hyperemic distal coronary pressure and hyperemic APV, both measured during wave‐free period window. Because flow and pressure are linearly related during mid‐ to late diastole, with stable resistance during this period, patient‐specific wave‐intensity analysis (to precisely define the wave‐free period) is not required for calculation of mMR. The difference between wave‐free period window mMR and whole‐cycle HMR is that mMR measures microcirculatory resistance only in the diastolic window, when resistance is at its lowest. Myocardial fractional flow reserve (FFR) was calculated as the ratio of hyperemic distal coronary and aortic pressure. Instantaneous wave‐free ratio (iFR) was calculated as the ratio of resting distal coronary and aortic pressure during the wave‐free period window. Quantitative coronary angiography (CAAS II, Pie Medical, Maastricht, The Netherlands; or McKesson, San Francisco, CA) was performed in angiographic stenoses to describe diameter stenosis percentage (DS%), minimal and reference lumen diameter, area stenosis, and minimal and reference lumen area and stenosis length.
Figure 1.
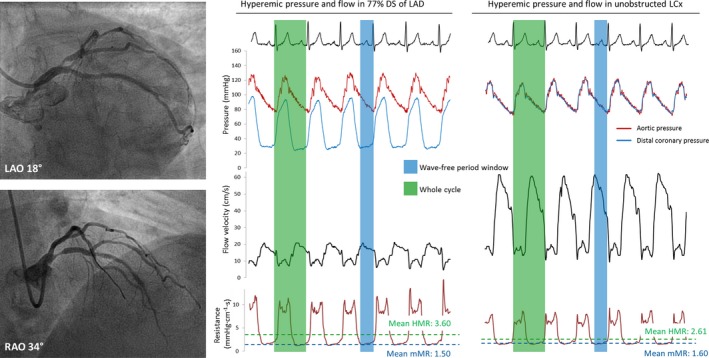
Example of the coronary hemodynamic data from a patient of cohort 1. Coronary angiography is shown in the left panel, with a 77% diameter stenosis in the mid‐LAD and no obstructions in the LCx. Invasive measurements of hyperemic pressure, Doppler flow velocity, and instantaneous microcirculatory resistance are shown in the right panels. HMR was sampled during the whole cardiac cycle (shaded in green), and mMR was sampled during the hyperemic wave‐free period (shaded in blue). Both HMR and mMR were calculated as the ratio of distal pressure and flow velocity. The LAD stenosis was hemodynamically severe with a FFR of 0.53, whereas FFR was 0.99 in the unobstructed LCx. HMR is numerically higher in the LAD than in the unobstructed LCx: 3.60 and 2.61 mm Hg·cm−1·s, respectively, attributable to higher systolic resistance. mMR was comparable in the LAD and LCx at 1.50 and 1.60 mm Hg·cm−1·s, respectively. FFR, fractional flow reserve; HMR, hyperemic microvascular resistance; LAD, left anterior descending coronary artery; LCx, left circumflex coronary artery; mMR, minimal microvascular resistance.
Study Cohorts
The IDEAL study involved 482 simultaneous intracoronary Doppler flow velocity and pressure measurements before percutaneous coronary intervention in 301 patients. We aimed to investigate whether CFR, HMR, and mMR are modulated by the presence of obstructive CAD. Measurements were divided into cohort 1, which was the primary analysis, and cohort 2, which served as a validation analysis for cohort 1. Below we describe how patients were divided among the cohorts and the merged analyses (this is summarized in Figure 2).
Figure 2.
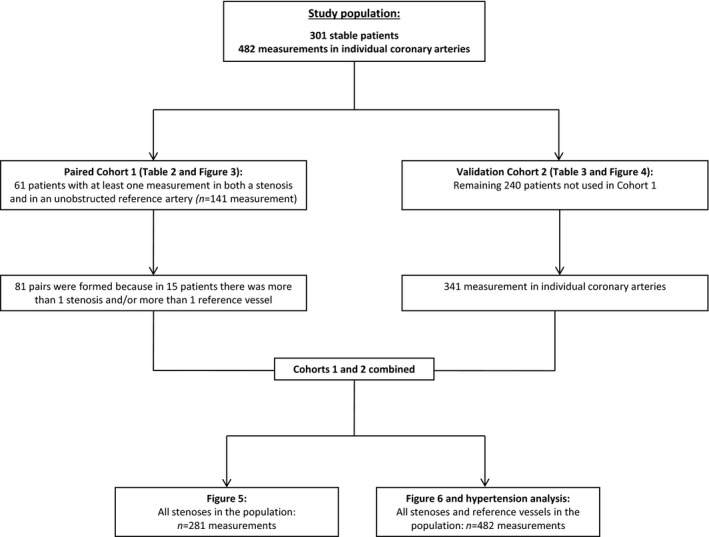
Flow chart. The flow of patients through the study.
Cohort 1
Cohort 1 was used to analyze differences in the parameters of MCD in vessels with obstructive CAD and unobstructed vessels within the same patient. From the 482 measurement taken in 301 patients, 141 paired measurements were available in 61 patients. Because in some patients multiple stenoses or reference measurements were taken, a total of 81 pairs could be formed. These additional pairs were formed to increase the statistical power of the analysis. The paired analysis was also stratified into 3 groups according to FFR: ≥0.80, 0.60 to 0.80, and ≤0.60. These groups were chosen because 0.80 is the clinical cutoff value for FFR, and it was previously reported that collateral flow only affects HMR in stenoses with FFR below 0.60.18
Cohort 2
Cohort 2 was used as validation for cohort 1 and involved the remaining 341 measurements in 240 patients. The measurements that were used in cohort 1, were not used in cohort 2 to provide an unbiased analysis. In cohort 2, the relationships between the parameters CFR, HMR, and mMR with both DS% as well as FFR were assessed. In a regression model, the relationship between mMR and DS% was also assessed when corrected for the influence of risk factors for atherosclerosis. Both FFR and DS% were used to indicate stenosis severity in this study, FFR because it best indicates hemodynamic stenosis severity and DS% because its assessment does not involve pressure or flow data that are also used in the calculation of CFR, HMR, and mMR.
Merged Analyses of Both Cohorts
Finally, the measurements of cohorts 1 and 2 were merged in order to better understand the clinical applicability of mMR and to further explore the phasic nature of coronary flow velocity, pressure, and microcirculatory resistance. First, HMR and mMR in all stenoses (n=281) were analyzed according to the 4‐quadrant FFR and CFR relationship19, 20 as divided by the respective cutoff points of 0.80 for FFR and 2.0 for CFR. Only stenoses were included in this analysis in order to not skew the FFR and CFR relationship. Second, regression analysis was performed between hyperemic APV, distal pressure, and microcirculatory resistance and DS% according to 3 phases of the cardiac cycle: whole cardiac cycle, diastolic wave‐free period window, and the systolic window. For this phasic analysis, the whole study cohort was used (n=482 measurements). Third, we assessed whether mMR was positively associated with the presence of uncorrected hypertension because it has been reported that hypertension is causally related to microvascular dysfunction.21 For this analysis, 3 groups were defined: (1) patients with a history of hypertension that is uncontrolled, defined as systolic blood pressure ≥140 mm Hg and/or diastolic blood pressure ≥90 mm Hg (n=82, 27%); (2) patients with a history of hypertension that has been adequately managed, defined as systolic blood pressure <140 mm Hg and diastolic blood pressure <90 mm Hg (n=75, 25%); and (3) patients without a history of hypertension (n=144, 48%).
Statistical Analysis
Categorical data are presented as numbers and percentages. Continuous data were visually assessed for normality using histograms and Q‐Q plots. Continuous data are presented as mean±standard deviation for normally distributed data or median with interquartile range. Associations were tested using generalized estimating equations (GEE) with an exchangeable working correlation matrix to take into account correlation between observations because multiple vessels per patient were used in some cases. Relationships between 2 continuous variables were estimated using regression models including linear and quadratic terms. Quadratic terms were included in the model only when the corresponding regression coefficient was statistically significant. Heteroscedasticity was visually assessed for the regression models by plotting standardized residuals versus the standardized predicted values. The P‐values of these models were determined using GEE. Pearson correlation was added to quantify the strength of the association. In cohort 1, statistical differences between the vessels with a stenosis and the unobstructed vessels were tested using paired samples T test or Wilcoxon signed‐rank test in case of non‐normally distributed values. In cohort 2 the association between mMR and DS% in addition to risk factors for cardiovascular disease was analyzed using multivariate GEE analysis. In the first block risk factors for cardiovascular disease were entered, and backward elimination of variables based on P‐value was performed. At each step the risk factor with the highest P‐value was eliminated until only variables with a significant P‐value remained. In the second block the association between mMR and DS% was assessed when corrected for the remaining significant cardiovascular risk factors from the first block. In the merged analyses the Bonferroni post‐hoc correction was used to detect differences for the FFR‐CFR quadrant analysis and the hypertension analysis. A 2‐sided P‐value of <0.05 was considered statistically significant. Statistical analyses were performed using SPSS V.20 (SPSS, Chicago, IL).
Results
Patient Characteristics
Patient as well as measurement characteristics are shown for both the complete cohort (age 61±9.6 years and a majority of male patients, 69%) and also stratified according to cohorts 1 and 2 in Table 1. Measurements were most frequently taken in the left anterior descending coronary artery (n=226, 47%). In the vessel with an angiographic obstruction, FFR and iFR were within the gray zone, 0.83 [0.69−0.90] and 0.91 [0.81−0.96], respectively. This corresponded to a mean DS% of 55±16, indicating that on average, the stenoses were of intermediate physiological and anatomical severity. Heart rate and aortic pressure did not differ in vessels with an angiographic stenosis and unobstructed vessels. Patient and measurement characteristics were comparable in cohort 1 and cohort 2.
Table 1.
Demographics and Stenosis Characteristics
| All Patients | Cohort 1: Paired Analysis | Cohort 2: Influence of DS% | |
|---|---|---|---|
| Patients | 301 | 61 | 240 |
| Male sex | 209 (69%) | 49 (80%) | 160 (67%) |
| Female sex | 92 (31%) | 12 (20%) | 80 (33%) |
| Hypertension | 157 (52%) | 23 (38%) | 134 (56%) |
| Hypercholesterolemia | 172 (57%) | 36 (59%) | 136 (57%) |
| Smoking history | 128 (43%) | 22 (36%) | 106 (44%) |
| Diabetes mellitus | 67 (22%) | 7 (12%) | 60 (25%) |
| Family history of CAD | 129 (43%) | 34 (56%) | 95 (40%) |
| Previous myocardial infarctiona | 34 (11%) | 4 (6.6%) | 30 (13%) |
| Age, y | 61±9.6 | 59±8.7 | 61±10.3 |
| Coronary arteries | 482 | 141 | 341 |
| Coronary artery | |||
| Left anterior descending | 226 (47%) | 59 (42%) | 167 (49%) |
| Left circumflex | 147 (31%) | 50 (36%) | 97 (28%) |
| Right coronary artery | 101 (21%) | 28 (20%) | 73 (21%) |
| Intermediate artery | 8 (1.7%) | 4 (2.8%) | 4 (1.2%) |
| Adenosine administration | |||
| Intravenous | 188 (39%) | 23 (16%) | 165 (48%) |
| Intracoronary | 294 (61%) | 118 (84%) | 176 (52%) |
| Angiographic stenosis | 281 (58%) | 72 (52%) | 209 (61%) |
| Fractional flow reserve | 0.83 [0.69‐0.90] | 0.80 [0.52‐0.90] | 0.84 [0.72‐0.90] |
| Instantaneous wave‐free ratio | 0.91 [0.81‐0.96] | 0.90 [0.70‐0.96] | 0.92 [0.84‐0.96] |
| Heart rate, bpm | 75±19 | 84±27 | 70±12 |
| Aortic pressure, mm Hg | 99±15 | 97±14 | 99±15 |
| Diameter stenosis, % | 55±16 | 55±17 | 54±15 |
| Minimal lumen diameter, mm | 1.22±0.52 | 1.15±0.51 | 1.27±0.52 |
| Reference lumen diameter, mm | 2.81±0.77 | 2.91±0.84 | 2.80±0.75 |
| Area stenosis, % | 80 [70‐88] | 77 [70‐91] | 80 [70‐87] |
| Minimal lumen area, mm2 | 0.99 [0.60‐1.73] | 0.99 [0.62‐1.87] | 1.01 [0.61‐1.77] |
| Reference lumen area, mm2 | 5.71 [3.89‐8.46] | 5.68 [3.82‐8.31] | 5.70 [3.90‐8.51] |
| Stenosis length, mm | 13.9 [8.0‐23.1] | 8.14 [6.30‐11.9] | 17.0 [8.86‐24.8] |
| Angiographically unobstructed | 201 | 69 (48%) | 132 (39%) |
| Fractional flow reserve | 0.97 [0.93‐0.99] | 0.97 [0.93‐0.98] | 0.97 [0.93‐0.99] |
| Instantaneous wave‐free ratio | 0.98 [0.96‐1.00] | 0.99 [0.97‐1.00] | 0.98 [0.96‐1.00] |
| Heart rate, bpm | 76±21 | 83±25 | 72±17 |
| Aortic pressure, mm Hg | 99±16 | 98±14 | 99±16 |
bpm indicates beats per minute; CAD, coronary artery disease; DS%, diameter stenosis percentage.
Only measurements with a previous myocardial infarction in a territory different from the interrogated vessel were used in this study.
Cohort 1: Paired Analysis of Vessels With a Stenosis and Nonobstructed Coronary Arteries
For the paired analysis, anatomic characteristics and hemodynamic parameters are shown in Table 2 for both the vessel with an angiographic stenosis as well as the unobstructed artery. On average, the vessels with an angiographic stenosis had an intermediate DS% of 54±17. Median FFR was below the ischemic cutoff at 0.80 [0.52−0.90], and this was significantly lower than the mean FFR in unobstructed reference vessels at 0.97 [0.93−0.98] (P<0.001). The paired analysis for the study parameters CFR, HMR, and mMR is shown in Figure 3, and parameters were stratified according to FFR groups. CFR was significantly lower in vessels with a stenosis than in unobstructed vessels (2.12±0.79 vs 2.56±0.63, P<0.001). HMR was also significantly higher in stenosed than in unobstructed coronary arteries (2.61±1.22 vs 2.31±0.89 mm Hg·cm−1·s; P=0.04); mMR was the only parameter that was equal in vessels with a stenosis and unobstructed reference vessels (1.54±0.77 vs 1.53±0.53 mm Hg·cm−1·s; P=0.90). After stratification according to FFR, CFR was equal in stenotic and unobstructed vessels in the FFR ≥0.80 stratum (2.59±0.70 vs 2.48±0.63; P=0.40) but significantly lower in the FFR 0.60 to 0.80 and FFR ≤0.60 strata (2.02±0.55 vs 2.46±0.54; P=0.03 for FFR 0.60‐0.80, and 1.42±0.47 vs 2.75±0.68; P<0.001 for FFR ≤0.60). HMR was equal in stenotic and unobstructed vessels in the FFR ≥0.80 stratum (2.54±0.94 vs 2.67±1.02 mm Hg·cm−1·s; P=0.34) and for FFR 0.60 to 0.80 (2.71±1.66 vs 2.26±0.47 mm Hg·cm−1·s; P=0.26). However, HMR was significantly higher in stenosed than reference vessels if FFR ≤0.60 (2.65±1.34 vs 1.76±0.52 mm Hg·cm−1·s; P=0.004). In stenosis and reference vessels, mMR was equivalent for all FFR strata (FFR ≥0.80 1.66±0.66 vs 1.75±0.61 mm Hg·cm−1·s; P=0.42, FFR 0.60‐0.80 1.67±1.09 vs 1.52±0.38 mm Hg·cm−1·s; P=0.53, and FFR ≤0.60 1.26±0.65 vs 1.18±0.39 mm Hg·cm−1·s; P=0.53).
Table 2.
Paired Analysis
| Parameter | Vessel With a Stenosis Mean±SD or Median [IQR] | Unobstructed Reference Vessel Mean±SD or Median [IQR] | Mean Difference and 95% CI | P Value |
|---|---|---|---|---|
| FFR | 0.80 [0.52‐0.90] | 0.97 [0.93‐0.98] | N/A | <0.001 |
| iFR | 0.90 [0.69‐0.96] | 0.99 [0.97‐1.00] | N/A | <0.001 |
| CFR | 2.12±0.79 | 2.56±0.63 | 0.44 [0.23‐0.66] | <0.001 |
| HMR, mm Hg·cm−1·s | 2.61±1.22 | 2.31±0.89 | −0.30 [−0.58 to 0.01] | 0.04 |
| mMR, mm Hg·cm−1·s | 1.54±0.77 | 1.53±0.57 | −0.01 [−0.17 to 0.15] | 0.90 |
| Hyperemic Pa, mm Hg | 90±12 | 90±12 | −0.1 [−2.1 to 1.9] | 0.94 |
| Hyperemic Pd, mm Hg | 65±19 | 86±12 | 20.9 [16.3‐25.5] | <0.001 |
| Hyperemic flow velocity, cm/s | 30.4±18.0 | 42.4±17.0 | 12.0 [7.1‐16.9] | <0.001 |
| Hyperemic wfp Pa, mm Hg | 78±10 | 79±11 | 0.7 [−1.3 to 2.6] | 0.50 |
| Hyperemic wfp Pd, mm Hg | 48±20 | 74±12 | 25.5 [20.4‐30.6] | <0.001 |
| Hyperemic wfp flow velocity, cm/s | 36.8±22.9 | 54.7±23.1 | 17.9 [10.8‐24.8] | <0.001 |
CFR indicates coronary flow reserve; CI, confidence interval; FFR, fractional flow reserve; HMR, hyperemic microvascular resistance; iFR, instantaneous wave‐free ratio; IQR, interquartile range; mMR, minimal microvascular resistance; N/A, not applicable; Pa, aortic pressure; Pd, distal pressure; SD, standard deviation; wfp, wave‐free period.
Figure 3.
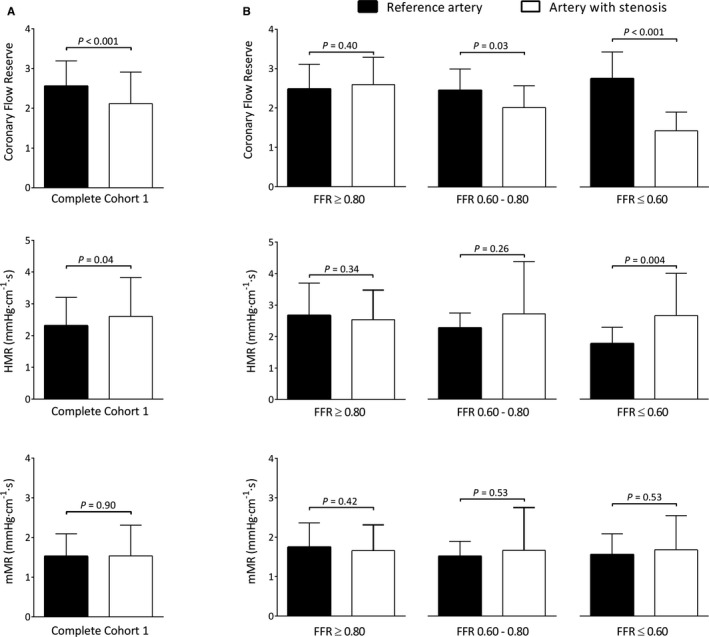
Cohort 1: paired analysis. A, Parameters for quantification of MCD are shown for the paired analysis in cohort 1. CFR was significantly lower in arteries with a coronary stenosis than in unobstructed reference arteries (black bars), whereas HMR was significantly higher in stenoses (white bars). mMR did not differ between stenosed and reference arteries. B, The parameters stratified according to FFR values of ≥0.80, 0.60 to 0.80, and ≤0.60. Lower values of CFR were observed in stenoses with FFR 0.60 to 0.80 and ≤0.60, whereas higher values of HMR were observed in pairs with FFR ≤0.60. mMR remained equivalent in stenosed and reference arteries after stratification based on FFR. Bars represent mean with error bars as standard deviation. CFR, coronary flow reserve; FFR, fractional flow reserve; HMR, hyperemic microvascular resistance; MCD, microcirculatory dysfunction; mMR, minimal microvascular resistance.
Cohort 2: Influence of Stenosis Severity on Study Parameters
Relationships between both DS% and FFR and the indices of MCD are plotted in Figure 4. For both DS% and FFR, significant correlations were found with CFR and HMR. DS% and FFR were not significantly correlated with mMR. Multivariate analysis was performed to investigate whether mMR was influenced by risk factors for cardiovascular disease: anatomic DS% and the presence of a previous myocardial infarction in a different territory (Table 3). The mMR was only associated with a history of myocardial infarction in a different vessel and showed no significant association with DS%.
Figure 4.
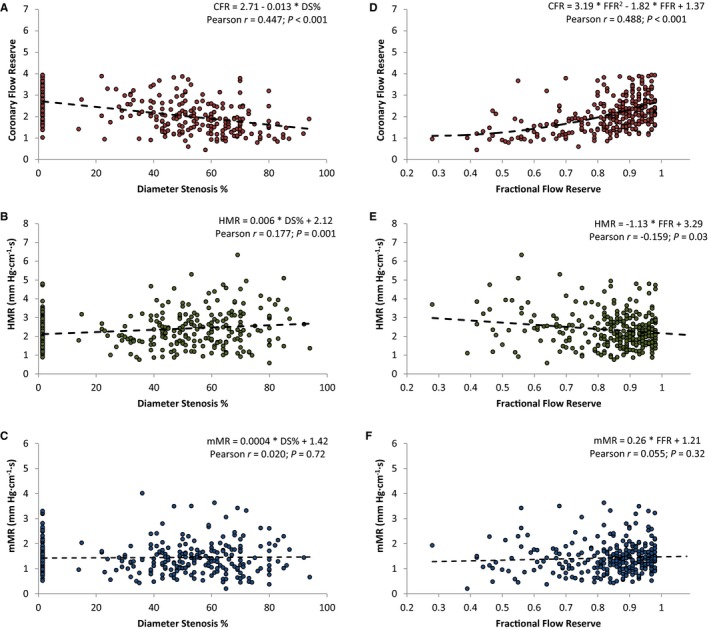
Cohort 2: regression analysis. Stenosis severity defined by both fractional flow reserve (A through C) and diameter stenosis % (D through F) was plotted with the 3 parameters of MCD. A and D, There is a significant correlation between CFR and either FFR or DS%. The same is true for HMR in (B and E). For mMR, there is no correlation with either FFR (C) or DS% (F). Regression lines were calculated by standard linear regression, with P‐values estimated from generalized estimating equations. Measurements in reference vessels were graded as 0% DS. CFR, coronary flow reserve; DS%, diameter stenosis percentage; FFR, fractional flow reserve; HMR, hyperemic microvascular resistance; MCD, microcirculatory dysfunction; mMR, minimal microvascular resistance.
Table 3.
Regression Model for minimal Microvascular Resistance
| Multivariate GEE Model With All Parameters (mm Hg·cm−1·s) | Multivariate GEE Model After Backward Elimination (mm Hg·cm−1·s) | |||||
|---|---|---|---|---|---|---|
| Parameter | β±Standard Error | β 95% CI | P Value | β±Standard Error | β 95% CI | P Value |
| Male sex | −0.077±0.079 | −0.232 to 0.078 | 0.33 | |||
| Age (per year increase) | 0.003±0.001 | 0.000 to 0.005 | 0.09 | |||
| Hypercholesterolemia | −0.157±0.090 | −0.333 to 0.017 | 0.08 | |||
| Family history of CAD | 0.057±0.080 | −0.099 to 0.212 | 0.48 | |||
| Diabetes mellitus | 0.011±0.095 | −0.175 to 0.196 | 0.91 | |||
| Hypertension | 0.108±0.089 | −0.067 to 0.282 | 0.23 | |||
| Smoking history | 0.005±0.087 | −0.165 to 0.175 | 0.90 | |||
| Previous myocardial infarctiona | −0.251±0.121 | −0.489 to −0.013 | 0.04 | −0.260±0.110 | −0.475 to −0.045 | 0.02 |
| Diameter stenosis (per 1% increase) | 0.002±0.001 | 0.000 to 0.005 | 0.09 | 0.002±0.001 | −0.001 to 0.004 | 0.15 |
CAD indicates coronary artery disease, GEE, generalized estimating equations.
Only measurements with a previous myocardial infarction in a territory different from the interrogated vessel were used in this study.
Merged Cohorts 1 and 2
Mean mMR for the entire population was 1.46±0.70 mm Hg·cm−1·s and was almost 3‐fold lower than mMR calculated under resting conditions instead of hyperemic conditions at 4.03±1.93 mm Hg·cm−1·s (P<0.001). Figure 5 depicts the relationship between FFR and CFR for all stenoses in cohorts 1 and 2 together. Based on the respective cutoff values of 0.80 for FFR and 2.0 for CFR, the stenoses were divided into 4 quadrants. In 65% of stenoses, FFR and CFR were in concordance (FFR and CFR both normal 33%; and FFR and CFR both abnormal 32%). In 35%, FFR and CFR were discordant (FFR abnormal and CFR normal 11%; and FFR normal and CFR abnormal 24%). Significant differences for both HMR and mMR were observed across the quadrants (P<0.001 for both HMR and mMR), but the distribution differed. HMR was low in the quadrant with concordantly normal CFR and FFR. However, HMR was unable to discriminate the stenoses with normal FFR and abnormal CFR from the 2 quadrants with abnormal FFR. mMR was significantly higher in the quadrant with normal FFR and abnormal CFR, compared to any of the 3 other quadrants. Thus, mMR was able to specifically identify the stenoses with normal FFR and abnormal CFR, in which the microcirculatory domain provides the greatest contribution to myocardial ischemia. Nevertheless, it is expected that MCD exists in a proportion of patients located in the lower left quadrant with concordantly abnormal CFR and FFR. Thus, mMR is modestly higher in this quadrant than in the 2 quadrants with normal CFR. However, this modest did not reach statistical significance. Figure 6 shows the phasic relationships between DS% plotted with hyperemic distal coronary pressure, APV, and microcirculatory resistance. It can be seen that during the whole cycle, microcirculatory resistance increases as stenosis severity increases (Figure 6A). This increase in microcirculatory resistance is observed in the systolic window, and hyperemic APV declines disproportionally compared to hyperemic distal pressure (Figure 6B). During the wave‐free period window, hyperemic APV and distal pressure decline proportionally with increasing stenosis severity (Figure 6C). As a result, there is no relationship between hyperemic microcirculatory resistance and DS% during the wave‐free period window. Finally, we analyzed the relationship between hypertension and mMR in all measurements of cohorts 1 and 2 combined (P for interaction based on GEE <0.001). In patients with uncontrolled hypertension mMR was 1.73±0.95 mm Hg·cm−1·s and significantly higher than in patients with controlled hypertension (1.36±0.57 mm Hg·cm−1·s, P=0.004) or patients without hypertension (1.36±0.54 mm Hg·cm−1·s, P=0.001). mMR was not found to differ between patients with controlled hypertension and patients without hypertension (P=1.00).
Figure 5.
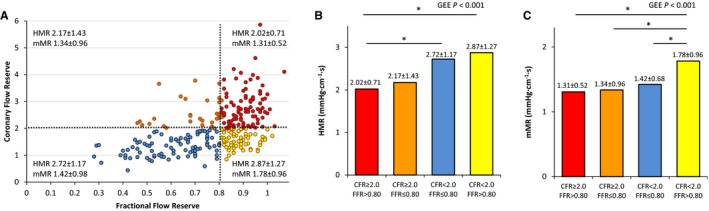
FFR and CFR relationship in all stenoses. A, The relationship between FFR and CFR for all stenoses in cohorts 1 and 2 is depicted. Dashed lines indicate the clinical cutoff values of FFR at 0.80 and CFR at 2.0, respectively, and divide the stenoses into 4 quadrants. In the right upper quadrant, CFR and FFR are concordantly negative (red circles), whereas in the left lower quadrant, CFR and FFR are concordantly positive (blue circles). In the left upper quadrant, CAD is predominantly located in the epicardial domain (orange circles). In the right lower quadrant, disease is predominantly located in the microcirculatory domain (yellow circles). B, HMR values are shown for the FFR‐CFR quadrants. HMR is only able to discriminate the right lower FFR‐CFR quadrant (yellow bar) from the right upper quadrant (red bar), but is unable to distinguish the right lower quadrant from the 2 quadrants with a positive FFR. C, mMR values for the quadrants are shown. mMR is able to clearly identify the involvement of primarily microcirculatory disease because mMR is significantly higher in the right lower quadrant (yellow bar) in comparison to the other quadrants. In contrast to HMR, mMR is able to discriminate between the right lower quadrant (yellow bar) and the quadrants with positive FFR because mMR is not modified by the presence of epicardial CAD. *P<0.05 after Bonferroni correction for multiple comparison. GEE indicates generalized estimating equations. CAD, coronary artery disease; CFR, coronary flow reserve; FFR, fractional flow reserve; GEE, generalized estimating equations; HMR, hyperemic microvascular resistance; mMR, minimal microvascular resistance.
Figure 6.
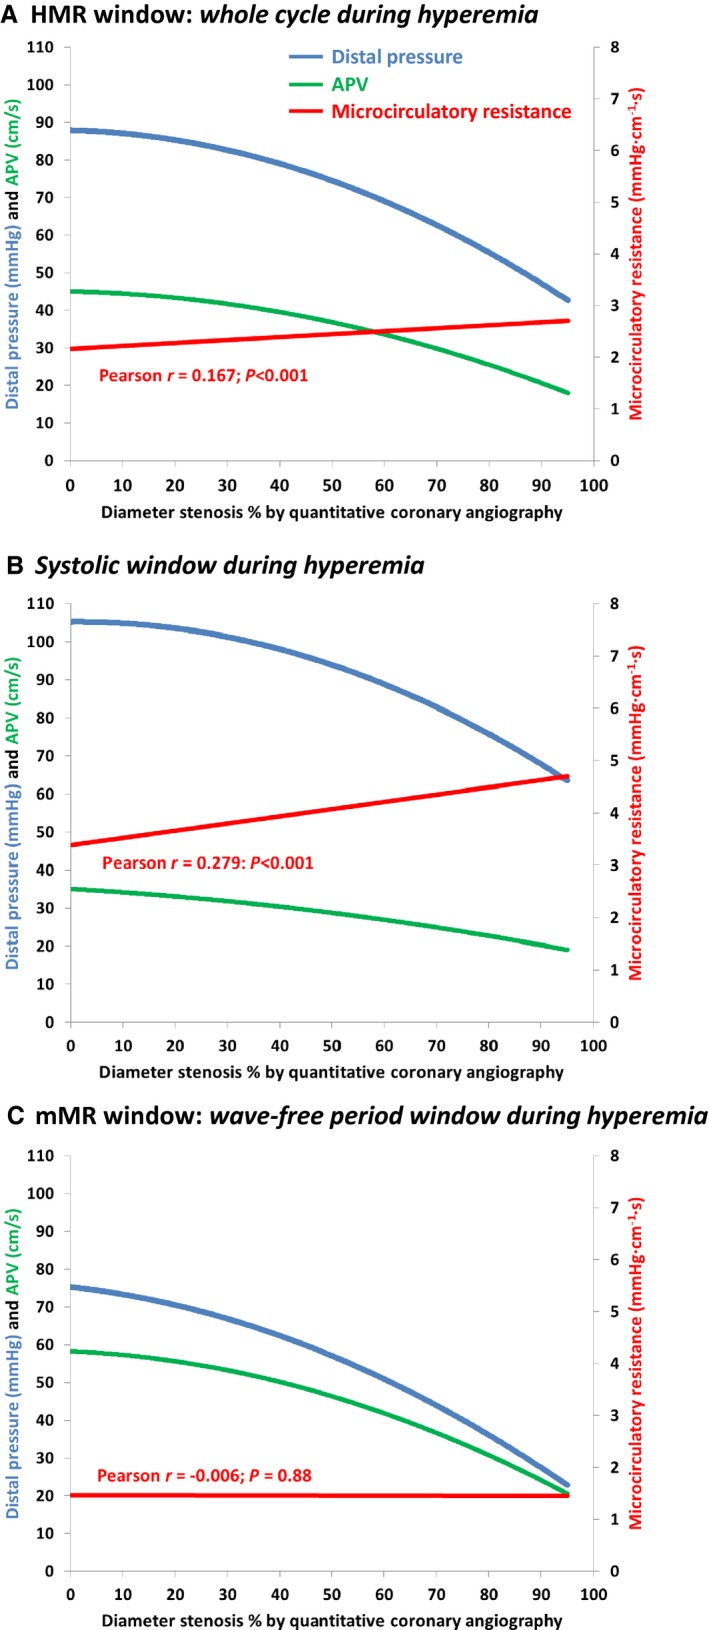
Phasic APV, distal pressure, and microcirculatory resistance. Regression lines for the relationships between distal pressure (blue lines), APV (green lines), and microcirculatory resistance (red lines) for all measurements made in both reference vessels and coronary arteries with a stenosis in cohorts 1 and 2 are shown. Regression lines were estimated for 3 phases: whole cardiac cycle (A), systolic window (B), and wave‐free period window (C). Correlation coefficients (r) and P‐values (estimated by GEE) are shown for the microcirculatory resistance in each panel. APV, averaged peak Doppler flow velocity; GEE, generalized estimating equations.
Discussion
In this study we introduce the mMR as a new hyperemic measure to quantify MCD. mMR uses the wave‐free period to detect a sampling period when microcirculatory resistance is minimized. We find that in contrast to CFR and HMR, mMR is not influenced by the presence of obstructive CAD.
CFR and HMR Are Modified by the Presence of Obstructive CAD
There is an unmet clinical need for a tool that discriminates between the epicardial and microcirculatory contribution to myocardial ischemia.2 As shown by the results of our study and those of others, CFR and HMR values are both modified by the presence of obstructive CAD. CFR can be determined invasively or noninvasively and provides information on the degree of autoregulatory reserve that exists within the perfusion territory. CFR is diminished not only by MCD but also by obstructive CAD, which exhaust the autoregulatory reserve. As a result, CFR is unable to distinguish between the relative contributions of the epicardial coronary artery and the coronary microcirculation toward an impaired myocardial perfusion. Of note, the aforementioned concept also applies to mMR when measured under resting conditions instead of hyperemic conditions. MCD can also be studied by the assessment of coronary flow and pressure simultaneously. HMR combines hyperemic flow and pressure and is less modified by the presence of obstructive CAD than by CFR. HMR is analogous to the index of microcirculatory resistance (IMR), which is measured using the thermodilution principle. In severe stenoses with FFR below 0.60, IMR and HMR are augmented, however,18 for which 2 underlying mechanisms have been proposed. First, collateral arteries develop to protect the underlying myocardium from ischemic conditions in severely obstructive CAD.22 Collateral arteries complicate the assessment of microcirculatory resistance because coronary flow velocity is measured at the location of the sensor, and flow arising from collateral arteries that connect distal to the sensor is not measured. Pressure that is generated by collateral arteries, on the other hand, is transmitted through the coronary artery and detected by the pressure sensor. This results in overestimation of microcirculatory resistance in stenoses with collateralization. Correction methods to account for the pressure generated by collateral arteries have been proposed but require balloon occlusion of the coronary artery to measure wedge pressure.7, 12 Although measurements with visible coronary collaterals were excluded in the IDEAL collaborators study, hidden collateralization could still be present.22 The second hypothesis assumes that the coronary circulation is pressure distensible and that if distal coronary pressure is low due to a significant stenosis, the microvessels will decrease in diameter and may even collapse when distal pressure is severely reduced, causing microcirculatory resistance to increase.14, 23 Regardless of the underlying mechanism, we find that both CFR and HMR are modulated by the presence of coronary artery disease. Stratification according to hemodynamic stenosis severity (Figure 3) reveals that severe stenoses with FFR ≤0.60 drive the modification of HMR. This confirms earlier work by Verhoeff et al, who found that correction of HMR with wedge pressure was only needed in stenoses with FFR below 0.60.18
mMR Does Not Have an Association With Obstructive CAD
As outlined above, the clinical need to be able to conveniently discriminate between the contributions of MCD and obstructive CAD toward myocardial ischemia is not fulfilled by CFR or HMR. In our study we demonstrate that mMR is not influenced by obstructive CAD and provide evidence in 2 separate cohorts. In cohort 1, mMR did not differ in obstructed and reference coronary arteries within the same patient with a trivial mean difference between obstructed and reference mMR of −0.01 (95% CI −0.17 to 0.15) mm Hg·cm−1·s. In cohort 2, stenosis severity (both by FFR and DS%) did not correlate with mMR in either bivariate or multivariate analysis, validating the findings of cohort 1. Cohort 2 was also used to investigate whether clinical risk factors such as hypercholesterolemia and diabetes mellitus,24 which concomitantly promote atherosclerosis as well as MCD, confound the relationship between obstructive CAD and mMR. Because the association between mMR and DS% remained nonsignificant in the regression model after correction for risk factors, the nonexistent relationship between mMR and obstructive CAD likely represents a valid finding. The findings of cohorts 1 and 2 together demonstrate that mMR is not modified by the presence of obstructive CAD and that mMR could be used as a clinical measure of MCD in both the presence and absence of obstructive CAD. The clinical applicability of mMR is further illustrated by the fact that it is able to identify stenoses with a predominant contribution of the microcirculatory domain toward myocardial ischemia in the FFR and CFR quadrant model (Figure 5). HMR, on the other hand, was unable to identify this group because HMR was not statistically different in stenoses with abnormal FFR but normal CFR (predominant epicardial disease) and stenoses with a normal FFR but abnormal CFR (predominant MCD).20
Elevated Microcirculatory Resistance is Dependent on the Cardiac Phase
Our data indicate that HMR is elevated in obstructive CAD, but this is not observed for mMR. Thus, the increase in hyperemic resistance in the presence of obstructive CAD appears to be a systolic phenomenon. During systole, the resistive intramyocardial arterioles are compressed due to the contraction of the left ventricle, whereas during diastole, arterioles are not compressed, and blood flow is unimpeded.25 Because myocardial perfusion predominantly occurs during diastole,25 it seems intuitive to measure microcirculatory resistance during this phase. Our findings indicate that taking into account systole leads to overestimation of microcirculatory resistance in the presence of obstructive CAD and makes it difficult to assess whether an elevated microcirculatory resistance is due to MCD or because of the stenosis (Figure 6). Despite an absent association between mMR and obstructive CAD, this does not exclude the possibility that passive microcirculatory collapse attributable to pressure distensibility also occurs during diastole.23 Theoretically, an increase in diastolic resistance due to a lower perfusion pressure in the presence of obstructive CAD could be balanced by microcirculatory remodeling to result in a net maintenance of resistance. The literature is inconclusive whether adaptive remodeling in the presence of a flow‐limiting stenosis increases or decreases the resistive capacity of the microcirculation.26, 27 Future work should focus on elucidating this concept.
Relationships of Risk Factors and Microcirculatory Dysfunction
To evaluate the relationship between mMR and angiographic stenosis severity, multivariate regression analysis was performed (Table 3). Previous myocardial infarction in another vessel than the target coronary artery had an independent relationship with lower mMR. Although our study was not designed to address this question, this observation may be linked to myocardial hypertrophy of noninfarcted segments to compensate for the loss of myocardial contractility in the infarcted territory.28 Experimental work suggests that this compensatory hypertrophy of noninfarcted segments occurs in tandem with increased capillary density to account for the additional myocardial perfusion demand.29 The increased capillary density could in turn lead to lower mMR values. Furthermore, no relationship between mMR and risk factors for cardiovascular disease such as hypertension, hypercholesterolemia, diabetes mellitus, and a history of smoking was observed in the multivariate analysis. Our findings are in line with results of Melikian et al, who found an association between thermodilution IMR and the presence of obstructive CAD but no association between IMR and any of the cardiovascular risk factors.10 However, it should be taken into account that in some patients risk factors were corrected medically or through lifestyle adaptations, whereas in other patients risk factors were not sufficiently corrected. Whether risk factors were corrected was not documented in the IDEAL study, and this precluded depth analysis of the relationship between risk factors and mMR. To test associations between mMR and risk factors such as smoking history, diabetes mellitus, and hypercholesterolemia, dedicated intervention studies are needed that take into account factors such as the number of pack‐years, oral glucose tolerance test and serum levels of Hb1AC, and low‐density lipoprotein and cholesterol. For hypertension, however, invasive blood pressure was measured during coronary catheterization, and we could assess whether hypertension was corrected with medical therapy. mMR was significantly higher in patients with uncontrolled hypertension compared to patients with controlled hypertension or patients without hypertension. Because a causal relationship between microvascular dysfunction exists,21 this finding supports the assumption that mMR is truly reflective of MCD. This assumption is further strengthened by the finding that mMR is specifically elevated in the quadrant with abnormal CFR and normal FFR.
Limitations
This study has several limitations. First, the measurement of coronary wedge pressure by balloon occlusion was not available, precluding further insight into the mechanisms underlying the relationship between coronary collaterals and the parameters of MCD. Second, mMR could theoretically be further minimized by adjunctive administration of vasodilatory agents on top of adenosine and nitrates, such as α‐adrenergic receptor blockers. Previous research, however, has demonstrated that this does not affect FFR and IMR measurements to a clinically relevant extent.30 Third, our study was not designed to investigate the influence of risk factors for cardiovascular disease on mMR, and hard conclusions on this dependence can therefore not be made from the regression model. Dedicated studies involving sequential mMR measurements in patients with uncorrected risk factors, which are then corrected medically or through lifestyle adaptation, are required to draw definitive conclusions. Fourth, experimental validation of mMR could not be performed because no adequate experimental models exist to study MCD. Furthermore, animal species have different coronary collateralization than humans.31 Further validation of mMR and mechanistic studies investigating coronary pressure and flow wave analysis are required before clinical implementation is considered. Fifth, our study is retrospective and the findings should be replicated in a dedicated, prospective study. Furthermore, the predictive power of mMR for clinical outcome should be explored, and the applicability of mMR should be investigated, in different clinical settings such as acute myocardial infarction and patients with typical symptoms but no obstructive CAD, who are likely to suffer from MCD. Finally, adequate technical measurements are required for accurate measurement of mMR. The use of mMR is limited by insufficient measurement quality in a proportion of cases (13.2% in the IDEAL study).9
Clinical Implications
Although our findings need to be replicated, mMR could potentially be used for comprehensive physiological assessment. The individual contributions of epicardial CAD and MCD can be reliably determined by combined FFR and mMR assessment with just 1 measurement. This could be helpful to predict residual ischemia caused by MCD after revascularization without the need for another measurement after the intervention that might also be influenced by periprocedural embolization or myocardial infarction. Furthermore, in patients with significant CAD in 3 coronary arteries who require coronary artery bypass grafting, measurement cannot be obtained after revascularization. Finally, the finding that the apparent overestimation of microcirculatory resistance is not observed during the wave‐free period enhances the fundamental understanding of the coronary microcirculation.
Conclusion
CFR and HMR have been traditionally used to assess MCD but are modified by the presence of obstructive CAD. The relationship between microcirculatory resistance and obstructive CAD, however, is observed only when measured during a whole cycle, whereas no relation is observed during the diastolic wave‐free period window in hyperemic conditions. Based on this observation, we propose mMR as a new hyperemic index to assess microcirculatory dysfunction that is calculated during this diastolic wave‐free period window: mMR possesses the unique property that it is unaffected by the presence of obstructive CAD and could be a more accurate measure of MCD in this context.
Sources of Funding
This work was supported by the Institute for Cardiovascular Research of the VU University of Amsterdam (ICaR‐VU) (to de Waard and van Royen) and the Medical Research Council (UK), British Heart Foundation and the National Institute for Health Research Imperial Biomedical Research Centre (to Nijjer, Sen, and Petraco). de Waard is supported by a Fellowship grant provided by the Netherlands Heart Institute. Funding to pay the Open Access publication charges for this article was provided by the VU University Medical Center.
Disclosures
Davies, Nijjer, Sen, Petraco, and Piek have received speaking/advisory board honoraria from Volcano Corporation. de Waard, Escaned, van de Hoef, and van Royen have received speaking/advisory board honoraria from Volcano Corporation and St Jude Medical. Davies holds intellectual property that is under license.
(J Am Heart Assoc. 2016;5:e004482 doi: 10.1161/JAHA.116.004482)
References
- 1. Exercise electrocardiogram and coronary heart disease mortality in the Multiple Risk Factor Intervention Trial. Multiple Risk Factor Intervention Trial Research Group. Am J Cardiol. 1985;55:16–24. [DOI] [PubMed] [Google Scholar]
- 2. Crea F, Camici PG, Bairey Merz CN. Coronary microvascular dysfunction: an update. Eur Heart J. 2014;35:1101–1111. [DOI] [PMC free article] [PubMed] [Google Scholar]
- 3. Murthy VL, Naya M, Taqueti VR, Foster CR, Gaber M, Hainer J, Dorbala S, Blankstein R, Rimoldi O, Camici PG, Di Carli MF. Effects of sex on coronary microvascular dysfunction and cardiac outcomes. Circulation. 2014;129:2518–2527. [DOI] [PMC free article] [PubMed] [Google Scholar]
- 4. Taqueti VR, Hachamovitch R, Murthy VL, Naya M, Foster CR, Hainer J, Dorbala S, Blankstein R, Di Carli MF. Global coronary flow reserve is associated with adverse cardiovascular events independently of luminal angiographic severity and modifies the effect of early revascularization. Circulation. 2015;131:19–27. [DOI] [PMC free article] [PubMed] [Google Scholar]
- 5. Herzog BA, Husmann L, Valenta I, Gaemperli O, Siegrist PT, Tay FM, Burkhard N, Wyss CA, Kaufmann PA. Long‐term prognostic value of 13N‐ammonia myocardial perfusion positron emission tomography added value of coronary flow reserve. J Am Coll Cardiol. 2009;54:150–156. [DOI] [PubMed] [Google Scholar]
- 6. Amier RP, Teunissen PF, Marques KM, Knaapen P, van Royen N. Invasive measurement of coronary microvascular resistance in patients with acute myocardial infarction treated by primary PCI. Heart. 2014;100:13–20. [DOI] [PubMed] [Google Scholar]
- 7. Aarnoudse W, Fearon WF, Manoharan G, Geven M, van de Vosse F, Rutten M, De Bruyne B, Pijls NH. Epicardial stenosis severity does not affect minimal microcirculatory resistance. Circulation. 2004;110:2137–2142. [DOI] [PubMed] [Google Scholar]
- 8. Chamuleau SA, Siebes M, Meuwissen M, Koch KT, Spaan JA, Piek JJ. Association between coronary lesion severity and distal microvascular resistance in patients with coronary artery disease. Am J Physiol Heart Circ Physiol. 2003;285:H2194–H2200. [DOI] [PubMed] [Google Scholar]
- 9. Nijjer SS, de Waard GA, Sen S, van de Hoef TP, Petraco R, Echavarria‐Pinto M, van Lavieren MA, Meuwissen M, Danad I, Knaapen P, Escaned J, Piek JJ, Davies JE, van Royen N. Coronary pressure and flow relationships in humans: phasic analysis of normal and pathological vessels and the implications for stenosis assessment: a report from the Iberian‐Dutch‐English (IDEAL) collaborators. Eur Heart J. 2016;37:2069–2080. doi: 10.1093/eurheartj/ehv626. Epub 26 November 2015. [DOI] [PMC free article] [PubMed] [Google Scholar]
- 10. Melikian N, Vercauteren S, Fearon WF, Cuisset T, MacCarthy PA, Davidavicius G, Aarnoudse W, Bartunek J, Vanderheyden M, Wyffels E, Wijns W, Heyndrickx GR, Pijls NH, de Bruyne B. Quantitative assessment of coronary microvascular function in patients with and without epicardial atherosclerosis. EuroIntervention. 2010;5:939–945. [PubMed] [Google Scholar]
- 11. Verhoeff BJ, Siebes M, Meuwissen M, Atasever B, Voskuil M, de Winter RJ, Koch KT, Tijssen JG, Spaan JA, Piek JJ. Influence of percutaneous coronary intervention on coronary microvascular resistance index. Circulation. 2005;111:76–82. [DOI] [PubMed] [Google Scholar]
- 12. Layland J, MacIsaac AI, Burns AT, Somaratne JB, Leitl G, Whitbourn RJ, Wilson AM. When collateral supply is accounted for epicardial stenosis does not increase microvascular resistance. Circ Cardiovasc Interv. 2012;5:97–102. [DOI] [PubMed] [Google Scholar]
- 13. Yong AS, Layland J, Fearon WF, Ho M, Shah MG, Daniels D, Whitbourn R, Macisaac A, Kritharides L, Wilson A, Ng MK. Calculation of the index of microcirculatory resistance without coronary wedge pressure measurement in the presence of epicardial stenosis. JACC Cardiovasc Interv. 2013;6:53–58. [DOI] [PubMed] [Google Scholar]
- 14. Spaan JA, Piek JJ, Hoffman JI, Siebes M. Physiological basis of clinically used coronary hemodynamic indices. Circulation. 2006;113:446–455. [DOI] [PubMed] [Google Scholar]
- 15. Marques KM, van Eenige MJ, Spruijt HJ, Westerhof N, Twisk J, Visser CA, Visser FC. The diastolic flow velocity‐pressure gradient relation and dpv50 to assess the hemodynamic significance of coronary stenoses. Am J Physiol Heart Circ Physiol. 2006;291:H2630–H2635. [DOI] [PubMed] [Google Scholar]
- 16. Di Mario C, Krams R, Gil R, Serruys PW. Slope of the instantaneous hyperemic diastolic coronary flow velocity‐pressure relation. A new index for assessment of the physiological significance of coronary stenosis in humans. Circulation. 1994;90:1215–1224. [DOI] [PubMed] [Google Scholar]
- 17. Sen S, Escaned J, Malik IS, Mikhail GW, Foale RA, Mila R, Tarkin J, Petraco R, Broyd C, Jabbour R, Sethi A, Baker CS, Bellamy M, Al‐Bustami M, Hackett D, Khan M, Lefroy D, Parker KH, Hughes AD, Francis DP, Di Mario C, Mayet J, Davies JE. Development and validation of a new adenosine‐independent index of stenosis severity from coronary wave‐intensity analysis: results of the ADVISE (ADenosine Vasodilator Independent Stenosis Evaluation) study. J Am Coll Cardiol. 2012;59:1392–1402. [DOI] [PubMed] [Google Scholar]
- 18. Verhoeff BJ, van de Hoef TP, Spaan JA, Piek JJ, Siebes M. Minimal effect of collateral flow on coronary microvascular resistance in the presence of intermediate and noncritical coronary stenoses. Am J Physiol Heart Circ Physiol. 2012;303:H422–H428. [DOI] [PubMed] [Google Scholar]
- 19. Meuwissen M, Chamuleau SA, Siebes M, Schotborgh CE, Koch KT, de Winter RJ, Bax M, de Jong A, Spaan JA, Piek JJ. Role of variability in microvascular resistance on fractional flow reserve and coronary blood flow velocity reserve in intermediate coronary lesions. Circulation. 2001;103:184–187. [DOI] [PubMed] [Google Scholar]
- 20. Echavarria‐Pinto M, Escaned J, Macias E, Medina M, Gonzalo N, Petraco R, Sen S, Jimenez‐Quevedo P, Hernandez R, Mila R, Ibanez B, Nunez‐Gil IJ, Fernandez C, Alfonso F, Banuelos C, Garcia E, Davies J, Fernandez‐Ortiz A, Macaya C. Disturbed coronary hemodynamics in vessels with intermediate stenoses evaluated with fractional flow reserve: a combined analysis of epicardial and microcirculatory involvement in ischemic heart disease. Circulation. 2013;128:2557–2566. [DOI] [PubMed] [Google Scholar]
- 21. Serne EH, de Jongh RT, Eringa EC, IJzerman RG, Stehouwer CD. Microvascular dysfunction: a potential pathophysiological role in the metabolic syndrome. Hypertension. 2007;50:204–211. [DOI] [PubMed] [Google Scholar]
- 22. Faber JE, Chilian WM, Deindl E, van Royen N, Simons M. A brief etymology of the collateral circulation. Arterioscler Thromb Vasc Biol. 2014;34:1854–1859. [DOI] [PMC free article] [PubMed] [Google Scholar]
- 23. Cornelissen AJ, Dankelman J, VanBavel E, Stassen HG, Spaan JA. Myogenic reactivity and resistance distribution in the coronary arterial tree: a model study. Am J Physiol Heart Circ Physiol. 2000;278:H1490–H1499. [DOI] [PubMed] [Google Scholar]
- 24. Kaufmann PA, Camici PG. Myocardial blood flow measurement by PET: technical aspects and clinical applications. J Nucl Med. 2005;46:75–88. [PubMed] [Google Scholar]
- 25. Gregg DE, Sabiston DC Jr. Effect of cardiac contraction on coronary blood flow. Circulation. 1957;15:14–20. [DOI] [PubMed] [Google Scholar]
- 26. Hong H, Aksenov S, Guan X, Fallon JT, Waters D, Chen C. Remodeling of small intramyocardial coronary arteries distal to a severe epicardial coronary artery stenosis. Arterioscler Thromb Vasc Biol. 2002;22:2059–2065. [DOI] [PubMed] [Google Scholar]
- 27. Zulliger MA, Montorzi G, Stergiopulos N. Biomechanical adaptation of porcine carotid vascular smooth muscle to hypo‐ and hypertension in vitro. J Biomech. 2002;35:757–765. [DOI] [PubMed] [Google Scholar]
- 28. Theroux P, Ross J Jr, Franklin D, Covell JW, Bloor CM, Sasayama S. Regional myocardial function and dimensions early and late after myocardial infarction in the unanesthetized dog. Circ Res. 1977;40:158–165. [DOI] [PubMed] [Google Scholar]
- 29. Xie Z, Gao M, Batra S, Koyama T. The capillarity of left ventricular tissue of rats subjected to coronary artery occlusion. Cardiovasc Res. 1997;33:671–676. [DOI] [PubMed] [Google Scholar]
- 30. Barbato E, Sarno G, Berza CT, Di Gioia G, Bartunek J, Vanderheyden M, Di Serafino L, Wijns W, Trimarco B, De Bruyne B. Impact of alpha‐ and beta‐adrenergic receptor blockers on fractional flow reserve and index of microvascular resistance. J Cardiovasc Transl Res. 2014;7:803–809. [DOI] [PubMed] [Google Scholar]
- 31. Teunissen PF, Horrevoets AJ, van Royen N. The coronary collateral circulation: genetic and environmental determinants in experimental models and humans. J Mol Cell Cardiol. 2012;52:897–904. [DOI] [PubMed] [Google Scholar]