

Abstract
Background
Ischemic preconditioning (IPC) protects the heart from prolonged ischemic insult and reperfusion injury through a poorly understood mechanism. Post‐translational modifications of histone residues can confer rapid and drastic switches in gene expression in response to various stimuli, including ischemia. The aim of this study was to investigate the effect of histone methylation in the response to cardiac ischemic preconditioning.
Methods and Results
We used cardiac biopsies from mice subjected to IPC to quantify global levels of 3 of the most well‐studied histone methylation marks (H3K9me2, H3K27me3, and H3K4me3) with Western blot and found that H3K9me2 levels were significantly increased in the area at risk compared to remote myocardium. In order to assess which genes were affected by the increase in H3K9me2 levels, we performed ChIP‐Seq and transcriptome profiling using microarray. Two hundred thirty‐seven genes were both transcriptionally repressed and enriched in H3K9me2 in the area at risk of IPC mice. Of these, Mtor (Mechanistic target of rapamycin) was chosen for mechanistic studies. Knockdown of the major H3K9 methyltransferase G9a resulted in a significant decrease in H3K9me2 levels across Mtor, increased Mtor expression, as well as decreased autophagic activity in response to rapamycin and serum starvation.
Conclusions
IPC confers an increase of H3K9me2 levels throughout the Mtor gene—a master regulator of cellular metabolism and a key player in the cardioprotective effect of IPC—leading to transcriptional repression via the methyltransferase G9a. The results of this study indicate that G9a has an important role in regulating cardiac autophagy and the cardioprotective effect of IPC.
Keywords: autophagy, epigenetics, ischemia
Subject Categories: Myocardial Biology, Ischemia, Gene Expression & Regulation, Epigenetics
Introduction
While timely restoration of coronary blood flow is essential for limiting myocardial injury and improving clinical outcomes after myocardial infarction (MI), reperfusion of ischemic myocardium can in itself induce injury and accelerate cardiomyocyte necrosis.1 Cardioprotective therapy has the potential to reduce ischemia/reperfusion injury and further improve outcomes after MI.2 Cardiac ischemic preconditioning (IPC), ie, brief repeated periods of nonlethal ischemia, protects the heart from prolonged ischemic insult and reperfusion injury, decreasing infarct size and improving cardiac function.3, 4 Even though the clinical benefit of ischemic conditioning has been tested in an increasing number of proof‐of‐concept studies,5 our knowledge of the underlying molecular mechanisms that mediate these cardioprotective effects is still incomplete.
IPC results in 2 windows of protection; the first begins immediately after the treatment and lasts for 2 to 3 hours,3 whereas the second begins 12 to 24 hours after treatment and lasts 48 to 72 hours.6 While the first window of protection is thought to be mediated by rapid events, such as opening of the mitochondrial KATP‐channel or inhibition of the mitochondrial permeability transition pore, the delayed cardioprotective effect is believed to be the result of transcription and de novo synthesis of specific distal mediators.7 IPC has been shown to trigger specific gene expression patterns in the heart,8, 9 but little is known about the regulatory mechanisms that govern this genetic reprogramming. The global genetic expression profile of a cell is in part regulated by post‐translational modifications of histones, which influence accessibility of the DNA to proteins that regulate gene expression. While the role of histone acetylation in ischemic injury has been well characterized,10 and histone deacetylase inhibitors have been shown to mitigate cardiac ischemia/reperfusion injury,11 histone methylation in IPC has not been extensively characterized.
The aim of this study was to investigate the effects of IPC on histone methylation patterns and its importance for cardioprotection.
Methods
Mice and Surgical Procedures
All procedures were performed according to protocols approved by the Institutional Committee for Use and Care of Laboratory Animals, University of Innsbruck. The investigation conforms with the Guide for the Care and Use of Laboratory Animals published by the US National Institutes of Health. The procedure for myocardial ischemia–reperfusion in mice has been described previously.12 Briefly, mice were anesthetized with a mixture of medetomidine (0.5 mg/kg), midazolam (5 mg/kg), and fentanyl (0.05 mg/kg) administered via an intraperitoneal injection. The chest was opened by a lateral cut along the left side of the sternum. After incision of the pericardial sac, a 1‐mm section of polyethylene‐10 tube was placed on top of the left descending artery to secure ligation without damaging the vessel. Ischemia and reperfusion was achieved by ligation and loosening of an 8–0 silk suture around the left descending artery. Mice were subjected to 4 cycles of 5‐minute ischemia and 5‐minute reperfusion, followed by 30 minutes of reperfusion. Hearts were harvested and perfused with PBS and biopsies from the ischemic area (area at risk, AAR) and nonischemic area (remote myocardium, RM) were collected and stored at −80°C. Sham animals were treated the same except for ligation of the vessel. Biopsies were obtained from the same regions of the heart as with IPC mice.
Protein Extraction and Western Blot Analysis
Heart tissue was homogenized in RIPA Buffer (50 mmol/L Tris pH 7.4, 150 mmol/L NaCl, 1% Triton X‐100, 0.5% Na deoxycholate, 0.1% SDS, 1 mmol/L EDTA, and 1X Complete Mini EDTA‐free protease inhibitor; Roche, Indianapolis, IN). For in vitro experiments, cells were scraped in RIPA buffer. Samples were sonicated using a probe sonicator. Debris was removed by centrifugation. Protein levels were quantified using a BCA assay (ThermoFisher Scientific Pierce, Rockford, IL). Ten micrograms of protein were size separated using SDS‐PAGE, transferred to nitrocellulose membranes, and subjected to standard immunoblotting procedures using antibodies targeted against G9a/Ehmt2 (C6H3), H3K9me2 (D85B4), Histone H3 (D1H2), Beta Tubulin (9F3), Actin, and mTOR (7C10) according to the manufacturer's instructions (Cell Signaling, Danvers, MA). Anti‐rabbit IgG‐horseradish peroxidase (Cell Signaling) was used as a secondary antibody. Enhanced chemiluminescent detection (Amersham GE Healthcare Life Sciences, Pittsburgh, PA) was used to detect the signal. Stripping of membranes were performed with Restore™ Western Blot Stripping Buffer (Thermo Scientific, Grand Island, NY). The background‐subtracted integrated intensity was quantified for each protein of interest relative to the loading control using ImageJ software (US National Institutes of Health).
Preparation of Cross‐linked Chromatin and Chromatin Immunoprecipitation
Chromatin was prepared either from ≈25 mg cardiac tissue or 3×10⁶ HL‐1 cells. Tissue was minced with a razor blade on ice and disaggregated into single‐cell suspension using a Dounce homogenizer (Scherf‐Präzision Europa GmbH, Meiningen, Germany). Tissue and cells were cross‐linked with 1.5% formaldehyde for 20 minutes at room temperature. Nuclei were prepared and chromatin digested using the SimpleChIP Plus Enzymatic Chromatin IP Kit (Cell Signaling Technology, Danvers, MA) according to the manufacturer's instructions. Sufficient chromatin digestion (yielding DNA fragments of 150–900 bp) was confirmed by gel electrophoresis. Five micrograms of digested, cross‐linked chromatin was used per immunoprecipitation. ChIP was performed with a H3K9me2 antibody (D85B4, Cell Signaling Technology) or a Normal Rabbit IgG antibody (Cell Signaling Technology) as a negative control according to the manufacturer's recommendations.
ChIP‐Seq
H3K9me2 ChIP samples from AAR and RM cardiac tissue in IPC mice (n=6 per condition for a total of 24 samples), including the respective genomic DNA Input samples, were processed for DNA sequencing by the Center for Genome Technology Sequencing Core (Hussman Institute for Human Genomics, University of Miami Miller School of Medicine, Miami, FL). A High‐Sensitivity DNA Assay (Agilent Bioanalyzer 2100; Agilent Technologies, Santa Clara, CA) was used to determine DNA concentration and shearing. Ten nanograms of input or ChIP‐enriched DNA were used for 2×101 Paired‐End Multiplexed library preparation using the NEBNext Ultra DNA Kit (New England Biolabs, Ipswich, MA) and 12 cycles PCR. The libraries were run on an Illumina HiSeq2000 using a PE Rapid flow cell. Read quality was evaluated using FastQC using default run parameters (http://www.bioinformatics.bbsrc.ac.uk/projects/fastqc/). Visual inspections of per‐base sequence quality, per‐sequence GC content, and sequence duplication levels were inspected, and were determined acceptable. Reads were mapped against mm10 using Bowtie 2 with no mismatches in seed sequence allowed.13 Average alignment was 89.8±0.512% (mean±SEM; Table S1). Both the SICER14 and CisGenome15 peak callers were used for calling peaks at default run parameters, and the intersection of peaks from the 2 callers was examined. SICER parameters include a redundancy threshold of 1, a window size of 200, fragment size of 150, effective genome fraction of 0.7, gap size of 400, and FDR cutoff value of 0.001. CisGenome was performed using default parameters. Pairwise comparisons of peaks from AAR and RM tissue from the same mouse were made for all 6 mice. Peaks appearing in both H3K9me2 and their respective Input samples were discarded across both AAR and RM samples. As such, only peaks from normalized H3K9me2 AAR samples were compared to peaks from normalized H3K9me2 RM samples. BEDTools16 was used to identify genes closest to and under enriched peak regions against GENCODE elements mm10 gtf file. Differential peak expression was calculated using the edgeR statistical R package within Bioconductor.17 Selected genes were visualized in the Integrative Genomics Viewer.18, 19 ChIP‐Seq data are available through the Gene Omnibus Expression database (http://www.ncbi.nlm.nih.gov/geo/), accession number GSE83979.
ChIP‐qPCR
Primers corresponding to the genomic regions in the mTOR gene with differentially enriched H3K9me2 ChIP‐seq peaks were designed using Primer Blast.20 Primers for the Mtor gene were as follows: Peak 1 forward: CTGAGGAGACGGGATTCAGG, Peak 1 reverse: GGAACCCAGGGCTGAACTAC, Peak 2 forward: AAAGAGTGGTTCGTGGCGTC, Peak 2 reverse: ACCCCTAGAGTGAGGTGTGT, Peak 3 forward: AGATTGGTCGTCAGTAGGCAC, Peak 3 reverse: TCTGGCACTGCAGTTTGGTT, Peak 4 forward: TTGCACCCTCACCCCTTTTC, Peak 4 reverse: GCTAACCGGTCATTCCCTCA (Integrated DNA Technologies, Coralville, IA). Epitect qPCR Assays (Qiagen, Hilden, Germany) for the promoters of MyoD and Gapdh were run as positive and negative controls for H3K9me2 enrichment, respectively. SYBR Green qPCR reactions were run on a QuantStudio™ 6 Flex Real‐Time PCR System (ThermoFisher Scientific, Waltham, MA). Relative quantification of Mtor in H3K9me2 ChIP‐seq samples (n=6) relative to genomic DNA input controls were computed using 2−ΔΔCt analysis.21
Microarray
Microarray analysis of AAR and RM biopsies from IPC mice (n=3) were performed by ArrayStar Inc (Rockville, MD) using the Arraystar Mouse LncRNA Array v.2.0. This microarray includes probes for 31 423 noncoding transcripts and 25 376 coding transcripts. Approximately 10 μg of RNA per sample was submitted for analysis. Quality and integrity of the samples were determined using NanoDrop ND‐1000 and denaturing agarose gel electrophoresis. Sample labeling and array hybridization were performed according to the Agilent One‐Color Microarray‐Based Gene Expression Analysis protocol (Agilent Technologies, Santa Clara, CA). Labeled cRNAs were purified by RNeasy mini kit (Qiagen). The concentration and specific activity of the labeled cRNAs were measured by NanoDrop. Each labeled cRNA was fragmented and hybridized to the microarray slide. The slides were incubated for 17 hours at 65°C in an Agilent Hybridization Oven. The hybridized arrays were washed, fixed, and scanned using the Agilent DNA Microarray Scanner. Agilent Feature Extraction Software v11.0.1.1 was used to analyze acquired array images. Quantile normalization and subsequent data processing were performed using the GeneSpring GX v12.0 software package (Agilent Technologies). After quantile normalization of the raw data, mRNAs that were flagged as present in all of the samples were chosen for further data analysis. Differentially expressed mRNAs with statistical significance were identified through Volcano Plot filtering. Microarray data are available through the Gene Omnibus Expression database (http://www.ncbi.nlm.nih.gov/geo/), accession number GSE83659.
Cell Culture
HL‐1 cells were kindly provided by Professor William C. Claycomb, Lousiana State University Medical Center, New Orleans, LA. Cells were grown in Claycomb medium (Sigma Aldrich, St. Louis, MO) supplemented with 10% fetal bovine serum, 100 U/mL of penicillin/streptomycin, 0.1 mmol/L norepinephrine, and 2 mmol/L l‐glutamine and 25 mmol/L HEPES. Culture flasks and plates were coated with 0.02% gelatin and 5 μg/mL fibronectin for 1 hour before seeding cells.
siRNA‐Mediated Knock Down of Ehmt2
HL‐1 cells at 70% to 80% confluency were transfected with Silencer Select siRNA to Ehmt2 (Thermo Fisher, ID: s99720), Mtor (Thermo Fisher, ID: s80901), or scrambled negative control siRNA using Lipofectamine RNAiMax Reagent (Thermo Fisher) according to the manufacturer's instructions. Three sets of transfections were performed with at least 3 biological replicates in each treatment group. Cells were harvested 72 hours after transfection and successful knock down of target mRNA and protein was confirmed with quantitative real‐time polymerase chain reaction and Western blot as described below.
Quantitative Real‐Time Polymerase Chain Reaction
Total RNA from transfected cells were prepared using the miRNeasy mini kit (Qiagen) and cDNA was synthesized using the H‐ RevertAid First Strand cDNA Synthesis Kit (Thermo Fisher) using random hexamer primers. Two‐step quantitative real‐time polymerase chain reaction was performed on a StepOne Plus Real‐Time PCR System using TaqMan Universal Master Mix II No UNG and TaqMan assays (Thermo Fisher) for Ehmt2 (ID: Mm01132261_m1), Mtor (ID: 00444968), and Actb (ID: Mm00607939) with the recommended PCR program. Each sample was run in duplicate on the qPCR plate. Data were presented using the 2−ΔΔCt method with Actb as reference gene and expressed relative to the mean of the cells treated with negative control siRNA.
Autophagy Assay
HL‐1 cells transfected with Ehmt2 siRNA or negative control siRNA (as described above) were either treated with 5 μmol/L rapamycin for 18 hours or cultured in serum‐free medium (Hank's Balanced Salt Solution, Thermo Fisher) containing 10 μmol/L chloroquine for 4 hours to induce autophagy. Two separate experiments with at least 6 biological replicates in each treatment group were performed. Autophagic activity was probed using the CYTO‐ID Autophagy Detection Kit (Enzo Life Sciences, Farmingdale, NY) and measured with flow cytometry. For quantification of autophagy, cells were stained as per the manufacturer's instructions and run in a BD Accuri Flow Cytometer. The mean fluorescence intensity in FL‐1 was used as a measure of autophagic activity.
Hypoxia Assay
HL‐1 cells were transfected with Ehmt2 siRNA or negative control siRNA (as described above). Seventy‐two hours after transfection, cells were placed in a hypoxia chamber (1% pO2) at 37°C for 6 hours. pO2 was maintained using a ProOx P110 Oxygen controller (Biospherix, Parish, NY). Cell death was measured after 1, 3, and 6 hours using the Lactate Dehydrogenase Activity Assay Kit (Sigma Aldrich) according to the manufacturer's instructions. Two separate experiments with at least 6 biological replicates in each treatment group were performed.
Visualization of Lysosomes in Live Cells
HL‐1 cells were seeded in 8‐well glass bottom μ‐Slides (Ibidi GmbH, Martinsried, Germany) at 80 000 cells/well and incubated overnight at 37°C. Cells were then transfected with Ehmt2 siRNA or scrambled control siRNA as described above. Seventy‐two hours post‐transfection, cells were grown in the presence of 5 μmol/L rapamycin or vehicle and incubated at 37°C for 16 hours. Lysosomes were stained using 100 nmol/L Lysotracker (Thermo Scientific) for 1 hour and counterstained with 3 μg/mL Hoechst 33342 (Thermo Scientific). Live cell imaging was then performed using a Nikon Confocal A1+ microscope at ×20 magnification.
Statistical Analysis
All statistical analyses were performed in Prism 6 (GraphPad Software Inc., La Jolla, CA). Data represent the mean±SEM and were analyzed by Student t test, 1‐ or 2‐way ANOVA with Bonferroni post hoc analysis as appropriate. Statistical significance was considered when P<0.05.
Results
Ischemic Preconditioning Increases Di‐methylation at H3K9
Mice were subjected to a cardiac IPC program through reversible ligation of the left coronary artery, consisting of 5 minutes of ischemia followed by 5 minutes of reperfusion repeated 4 times. IPC treatment was followed by 30 minutes of reperfusion before the mice were euthanized and cardiac biopsies from the myocardial region supplied by the ligated vessel (AAR) and RM were isolated.
In order to determine whether IPC alters histone methylation patterns, we quantified global levels of H3K4me3, a well‐characterized euchromatin mark associated with transcriptional activation, as well as H3K9me2 and H3K27me3, modifications that confer chromatin condensation and transcriptional repression.22 Of these, only H3K9me2 was altered in response to IPC (Figure 1 and Figure S1). H3K9me2 was significantly increased in IPC myocardial AAR compared to remote myocardium (RM, 2‐way ANOVA indicated a significant effect of area: F1,8=7.292, P=0.0271 and of ischemia: F1,8=6.798, P=0.0313, n=3; Figure 1). No change was observed in sham animals. Methylation at H3K9 is predominantly mediated by the histone methyltransferase G9a. However, we did not observe an increase in G9a protein in IPC AAR (Figure S2).
Figure 1.
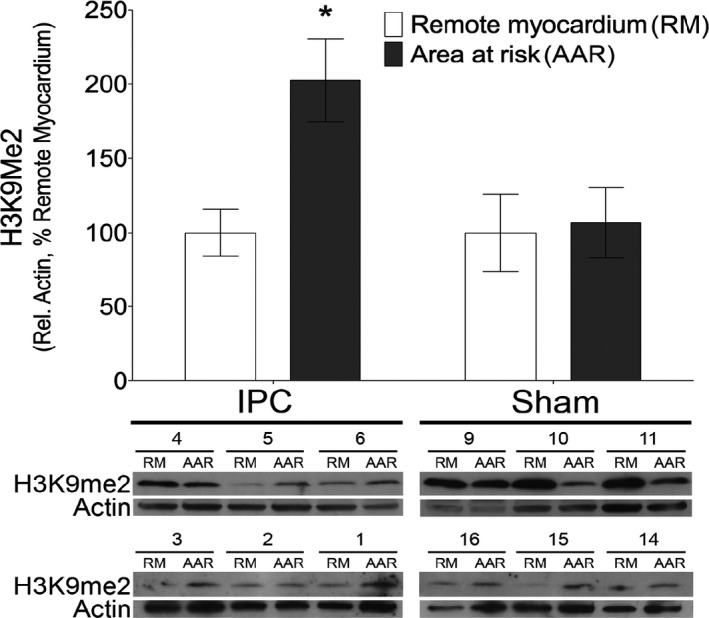
Cardiomyocyte chromatin is enriched for H3K9me2 after ischemic preconditioning. Western blot analysis of histone modifications in animals subjected to ischemic preconditioning (IPC) or sham controls reveals a significant increase in H3K9me2 in myocardial area at risk (AAR) compared to remote myocardium (RM) (*P<0.05 using 2‐way ANOVA with Bonferroni post hoc analysis of AAR vs RM, n=6).
ChIP‐Seq Reveals mTOR as Differentially Enriched in H3K9me2 After IPC
To assess which genes were affected by the H3K9me2 enrichment on a genome‐wide scale, we performed ChIP‐Seq using cross‐linked chromatin from the AAR and RM of IPC mice (n=6). To identify robust H3K9me2 peaks, we used both SICER and CisGenome for peak calling, and analyzed differentially enriched peaks between the AAR and RM. The number of differentially enriched peaks in the AAR compared to the RM, within and up to 10 kb upstream of genes, was 43 974 for CisGenome and 53 386 for SICER. The total number of genes with differentially enriched peaks were similar between the 2 peak callers (≈14 000 genes). In parallel with ChIP‐Seq, we performed transcriptome profiling of AAR and RM biopsies from IPC mice using microarray (n=3). A schematic overview of the analysis pipeline is shown in Figure 2A. Statistically significant differentially expressed genes with a fold change of >2 were identified through Volcano Plot filtering and yielded a total of 3891 genes, of which 1212 were upregulated and 2679 were downregulated in the AAR compared to the RM. To validate the ChIP‐Seq results and identify genes that were transcriptionally repressed by H3K9me2 enrichment, we compared the genes with differentially enriched peaks identified by both peak callers with the genes that were significantly downregulated with a fold change >10 on the microarray and found 236 genes that overlapped (Table S2). We performed pathway analysis on this set of genes using the WebGestalt analysis tool23 (Table S3) and found pathways with known function in the cardioprotective effect of IPC such as “Ubiquitin mediated proteolysis”,24 “Regulation of actin cytoskeleton,”25 and “Metabolic pathways.”26 Moreover, pathways with relevance to cardiac biology, such as “Arrythmogenic right ventricular cardiomyopathy,” “Adherens junction,” and “Tight junction” were also enriched in the gene set. For the 236 genes in the set, significantly enriched peaks were calculated using EdgeR and a heat map based on the SICER ChIP‐Seq read number for each peak and sample was generated using MicroScope27 (Figure S3). Hierarchical clustering showed a clear separation of AAR and RM samples.
Figure 2.
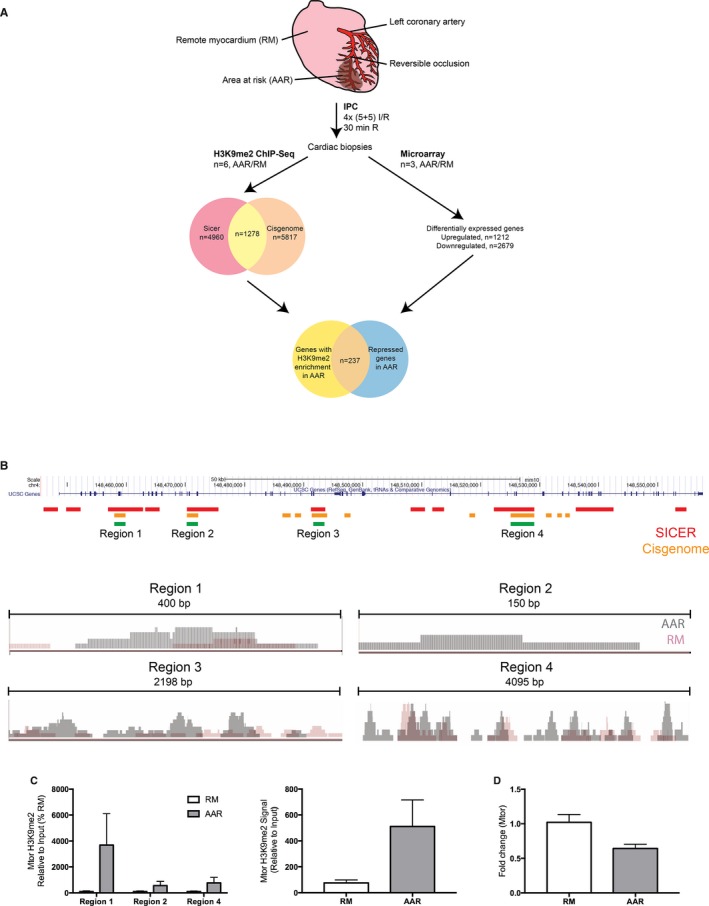
The Mtor gene is subject to H3K9me2‐mediated epigenetic regulation in ischemic preconditioning. A, Overview of experimental and bioinformatic procedures. B, Upper: UCSC genome browser view of the mouse Mtor gene. Regions of differential H3K9me2‐enrichment in the AAR called by SICER (red) and CisGenome (orange) are indicated. Overlapping regions are indicated by green bars. Lower: Integrative Genomics Viewer (IGV) visualizations of ChIP‐Seq reads in regions 1 to 4 of the AAR and RM in representative IPC mice. C, ChIP‐qPCR validation confirms that H3K9me2 is more highly associated with the Mtor gene in ischemic preconditioned AAR vs RM. Left panel shows individual regions (*P<0.05 using 2‐way ANOVA with Bonferroni post hoc analysis, n=6, Region 3 did not amplify) and right panel shows the cumulative H3K9me2‐levels in Regions 1, 2, and 4. D, qPCR analysis of Mtor expression in the AAR and RM of IPC mice (n=6, *P<0.05 using Student t test). Mtor expression was normalized to Gapdh and expressed relative to the mean of the RM samples. I/R, ischemia/reperfusion; IPC, ischemic preconditioning; qPCR, quantitative polymerase chain reaction.
A literature search identified 17 genes from the list that could be associated with cardiac function or cardioprotection and mechanistic target of rapamycin (Mtor) was chosen for further analysis. This was based on the fact that Mtor is an essential regulator of autophagy,28 and the autophagic response is a crucial component in the cardioprotective effect of IPC.29, 30 We hypothesized that IPC causes di‐methylation of H3K9 throughout Mtor, thereby inhibiting its expression, leading to increased cardiac autophagy and a cardioprotective effect. We identified 10 regions of differential H3K9me2 enrichment in the Mtor gene based on SICER peaks, covering in total >50% of the entire genomic region, and 1 region in the distal promoter (Figure 2B). Analyzing peaks called by CisGenome, we identified 13 regions of differential H3K9me2 enrichment in Mtor, of which 4 overlapped with SICER regions (named Region 1–4 in Figure 2B). We performed ChIP‐qPCR on AAR and RM from IPC biopsies using primers specific for these 4 regions and verified that H3K9me2 is significantly more enriched at Mtor in IPC AAR as compared to remote myocardium (2‐way ANOVA indicated a significant effect of area: F1,20=7.373, P=0.0133, n=3–6; Region 3 did not amplify; Figure 2C). As controls, enrichment of H3K9me2 in the MyoD promoter and lack of H3K9me2 in the Gapdh promoter was shown (Figure S4). The background signal was assessed using an IgG antibody, and was consistently very low, with a mean signal of <0.01% of Input DNA (Figure S4). Consistent with the repressive effect of H3K9 dimethylation, and with the results from the microarray, a significant decrease in Mtor expression in the AAR was confirmed with qPCR (Figure 2D).
mTOR Expression Is Regulated by the Methyltransferase Activity of G9a
Methylation of H3K9 is primarily mediated by the methyltransferase G9a31 (encoded by the Ehmt2 gene), and we hypothesized that the enrichment in H3K9me2 across the Mtor gene would be dependent on G9a. To test this, we performed siRNA‐mediated knock down of Ehmt2 in the murine cardiomyocyte cell line HL‐1. Seventy percent to 80% knock down of Ehmt2 mRNA and protein were confirmed 72 hours post‐transfection (Figure 3A and 3B, P<0.001). Moreover, the total H3K9me2 levels decreased by more than 50% in cells treated with Ehmt2 siRNA (Figure 3C, P<0.01), confirming decreased G9a methyltransferase activity in these cells. To show that G9a/Ehmt2 regulates H3K9me2 levels throughout Mtor, we performed ChIP‐qPCR with primers corresponding to the 4 differentially enriched H3K9me2 regions identified by ChIP‐Seq, and showed that Ehmt2 knock down resulted in a significant decrease in H3K9me2 levels at all 4 regions (Figure 3D). Moreover, Ehmt2 knock down resulted in increased mTOR expression, both on the mRNA and protein levels (Figure 3E and 3F). Taken together, these results indicate that Ehmt2 confers H3K9 di‐methylation across Mtor and inhibits its expression.
Figure 3.
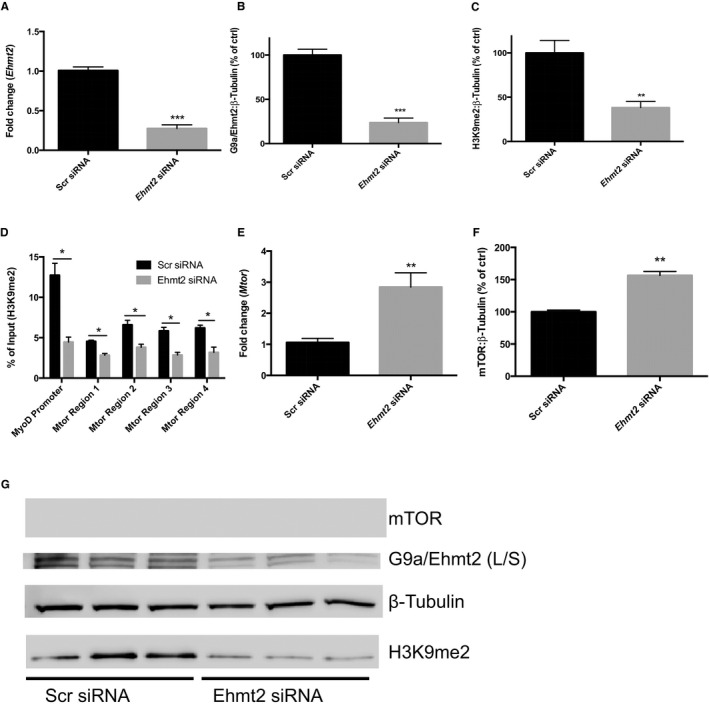
G9a/Ehmt2 regulates Mtor H3K9me2‐levels and gene expression. A, Analysis of Ehmt2 expression in HL‐1 cells transfected with scrambled negative control siRNA (Scr siRNA) or Ehmt2 siRNA with qPCR. Ehmt2 expression was normalized to Gapdh and expressed relative to the mean of the Scr siRNA samples (**P<0.01 using Student t test). Analysis of (B) G9a/Ehmt2 and (C) H3K9me2 levels in HL‐1 cells transfected with Scr or Ehmt2 siRNA using Western blot (**P<0.01, ***P<0.001 using Student t test). Beta Tubulin was used as loading control. Results are derived from 3 separate experiments with 3 biological replicates in each experiment. A representative blot from 1 experiment is shown. The long and short isoforms of G9a are both visible on the blot. The combined density of both bands was used for quantification. D, H3K9me2 ChIP‐qPCR of HL‐1 cells transfected with Scr or Ehmt2 siRNA. Primers corresponding to regions of differential H3K9 dimethylation in the Mtor gene of IPC mice were used. Primers for the Myod promoter were used as a positive control (*P<0.05 using Student t test). Results are derived from 3 separate experiments. E, Analysis of Mtor gene expression in HL‐1 cells transfected with Scr siRNA or Ehmt2 siRNA using qPCR. Mtor expression was normalized to Gapdh and expressed relative to the mean of the control samples (**P<0.01 using Student t test). Results are derived from 3 separate experiments with 3 biological replicates in each experiment. F, Analysis of Mtor gene expression in HL‐1 cells transfected with Scr siRNA or Ehmt2 siRNA using Western blot (**P<0.01 using Student t test). Beta Tubulin was used as loading control. Results are derived from 3 separate experiments with 3 biological replicates in each experiment. G, A representative blot from 1 experiment is shown. qPCR, quantitative polymerase chain reaction; IPC, ischemic preconditioning.
G9a Regulates Cardiomyocyte Autophagy and Sensitivity to Hypoxia
Since mTOR is an important regulator of autophagy, and autophagy is a crucial component of the cardioprotective effect of IPC, we hypothesized that G9a/Ehmt2 regulates cardiac autophagy through mTOR. Lysomal/autophagic vacuoles were detected in HL‐1 cells using a fluorescent probe and analyzed using flow cytometry. Ehmt2 knock down caused a decrease in autophagic activity, both under baseline conditions as well as when treated with 2 separate autophagic stimuli: 5 μmol/L rapamycin and 4 hours of serum starvation (Figure 4). To explore the details of this effect, we performed live cell imaging of transfected and rapamycin‐treated HL‐1 cells stained with a fluorescent lysosomal dye. There was a clear reduction in the amount and size of lysosomes in the cells transfected with Ehmt2 siRNA compared to negative control siRNA (Figure 4C and 4D). This suggests that Ehmt2 is necessary for full autophagic response in cardiomyocytes. Moreover, to confirm that G9a provides cytoprotection to cardiomyocytes in response to hypoxia, HL‐1 cells transfected with Ehmt2 siRNA or negative control siRNA were cultured under hypoxic (1% pO2) conditions. Cell death was assayed by lactate dehydrogenase release into the cell medium after 1, 3, and 6 hours. As expected, a substantial increase in cell death was seen after 6 hours. This effect was substantially more pronounced in the cells transfected with Ehmt2 siRNA (Figure 4E), suggesting that Ehmt2 knock down renders cardiomyocytes more sensitive to hypoxia.
Figure 4.
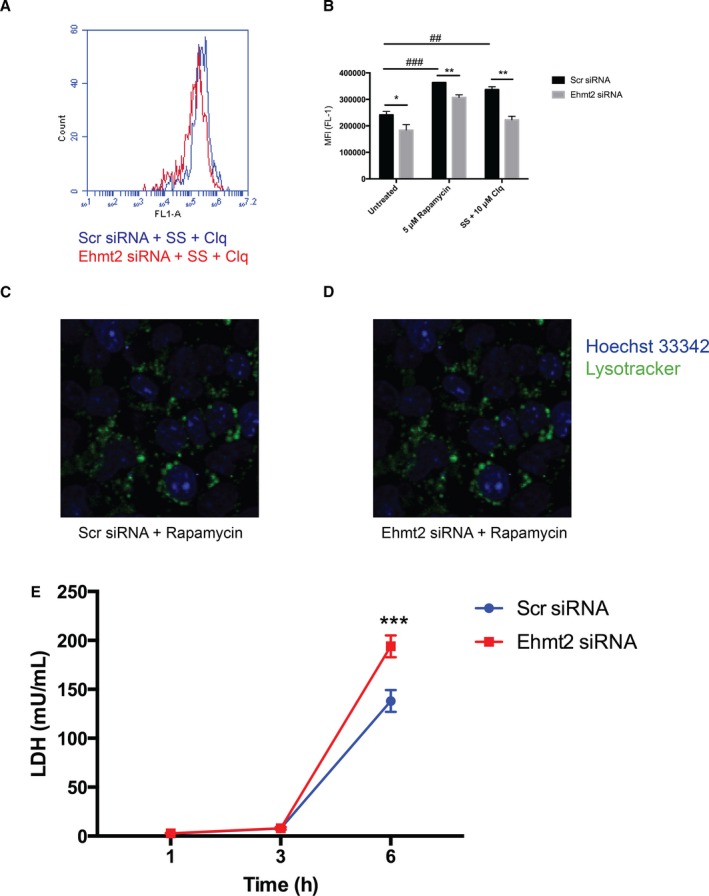
G9a/Ehmt2 regulates cardiomyocyte autophagy and sensitivity to hypoxia. HL‐1 cells transfected with scrambled negative control siRNA (Scr siRNA) or Ehmt2 siRNA were treated with 5 μmol/L rapamycin for 16 hours or subjected to serum starvation (SS) in the presence of 10 μmol/L chloroquine for 4 hours. Autophagic activity was measured using a fluorescent lysosomal probe and the mean fluorescence intensity (MFI) was analyzed with flow cytometry. A, Representative overlay histograms of HL‐1 cells transfected with Scr siRNA (blue) or Ehmt2 siRNA (red) and subjected to SS. B, There was a significant increase in autophagic activity in control cells after treatment with either 5 μmol/L rapamycin (### P<0.001) or (SS) (## P<0.01). Transfection with Ehmt2 siRNA significantly reduced the levels of autophagy in the baseline (*P<0.05) as well as when treated with 5 μmol/L rapamycin (**P<0.001) or SS/10 μmol/L chloroquine (**P<0.01). Two‐way ANOVA with Bonferroni correction for multiple comparisons was used to calculate statistical significance. Results are derived from 3 separate experiments with 3 biological replicates in each experiment. C and D, Representative confocal images of HL‐1 cells transfected with Ehmt2 or negative control siRNA for 72 hours then treated with 5 μmol/L rapamycin for 16 hours. Lysosomes were stained with Lysotracker Green and Hoechst was used for counterstaining. Live cell imaging was performed using a Nikon Confocal A1+ microscope at ×20 magnification. E, HL‐1 cells were transfected with Scr siRNA or Ehmt2 siRNA and cultured under hypoxic conditions (1% pO2) for 6 hours. Cell death was assayed after 1, 3, and 6 hours by measuring lactate dehydrogenase (LDH) release into the cell medium. At 6 hours, the amount of LDH was significantly higher in cells transfected with Ehmt2 siRNA (2‐way ANOVA with Bonferroni correction for multiple comparisons, ***P<0.001) than in cells transfected with negative control siRNA. Results are derived from 2 separate experiments with 6 biological replicates in each treatment group.
Inhibition of mTOR Transcription Is Sufficient to Affect Autophagic Activity in Cardiomyocytes
We hypothesized that IPC causes downregulation of Mtor transcription through increased H3K9 dimethylation, and that this would be sufficient to affect autophagic activity in cardiomyocytes. To confirm that the immediate effect of IPC is on Mtor transcription, and not a result of altered Mtor protein levels, we measured Mtor protein in cardiac biopsies from mice euthanized 30 minutes after IPC and could not detect a difference between the AAR and RM (Figure 5A). To confirm that decreased transcription of Mtor in itself is sufficient to affect autophagic activity in cardiomyocytes, we inhibited Mtor gene expression in HL‐1 cells via siRNA and monitored autophagic activity with the assay described above (Figure 5B). Mtor gene expression was reduced by 50% already at 2 hours post‐transfection and was maintained suppressed throughout the time course of the experiment (48 hours). A significant increase in autophagic activity could be seen in cells transfected with Mtor siRNA 5 hours post‐transfection, and the effect became increasingly pronounced at the later time points. These results indicate that inhibition of Mtor transcription is sufficient for inducing autophagy in cardiomyocytes.
Figure 5.
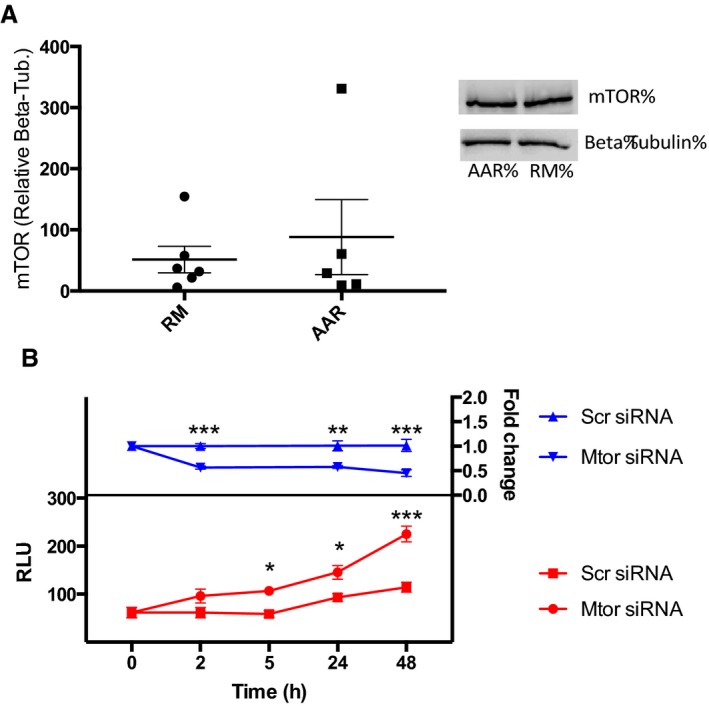
Inhibtion of Mtor transcription is sufficient for induction of autophagy in cardiomyocytes. A, Western blot analysis of Mtor protein in animals subjected to IPC, comparing the area at risk (AAR) to remote myocardium (RM), n=6. B, siRNA‐mediated knock down of Mtor in HL‐1 cells and its effect on autophagy. Upper, relative expression of Mtor in HL‐1 cells at different time points after transfection with Mtor siRNA or negative control siRNA measured with qPCR. Data are normalized to Gapdh and expressed relative to the mean of Scr siRNA‐treated cells at each time point. A 2‐way ANOVA with Bonferroni correction was used to calculate statistical significance between control cells and cells transfected with Mtor siRNA at each time point (***P<0.001, **P<0.01). Lower, autophagic activity in HL‐1 cells at different time points after transfection with Mtor siRNA or negative control siRNA measured with a fluorescent lysosomal probe. A 2‐way ANOVA with Bonferroni correction was used to calculate statistical significance between control cells and cells transfected with Mtor siRNA at each time point (*P<0.05, ***P<0.001). Results are derived from 2 separate experiments with 6 biological replicates in each treatment group. IPC, ischemic preconditioning; qPCR, quantitative polymerase chain reaction; RLU, relative luminescence units.
Discussion
Despite intense effort, the cardioprotective mechanisms triggered by IPC are still poorly understood on the molecular level. The second window of protection conferred by cardiac IPC, which begins 12 to 24 hours after treatment and lasts 48 to 72 hours, is believed to be the result, at least in part, of transcriptional activation or repression of certain genes or gene programs. Although IPC has been shown to activate transcription factors such as NFκB, STAT1/3, and HIF‐1α, which mediate the transcription and synthesis of de novo distal mediators of cardioprotection,7 there is reason to believe that the second window of protection is also orchestrated by epigenetic switches. For example, there is evidence that the neuroprotective phenotype induced by IPC of the brain relies on epigenetic changes.10 Moreover, caveolin has been shown to induce cardioprotection through epigenetic alterations in preconditioned hearts32 and inhibition of histone deacetylase activity mitigates ischemic injury in isolated mouse hearts11 and reduces MI size in vivo.33 Although there is evidence for the role of histone acetylation in the cardioprotective effect of IPC, much less is known about histone methylation. This prompted us to investigate the effect of IPC on global levels of 3 of the most well‐studied histone methylation marks: H3K4me3, H3K9me2, and H3K27me3.
We found a significant increase in the levels of H3K9me2 in the preconditioned cardiac tissue (AAR) compared to remote myocardium. Methylation at H3K9 is predominantly mediated by the histone methyltransferase G9a. Considering the short time frame (30 minutes) between the end of IPC treatment and euthanizing the mice, increased expression of G9a is not a likely explanation for this effect and we did not observe an increase in G9a protein in IPC AAR, suggesting that either another H3K9‐targeted epigenetic enzyme could be responsible for the IPC‐induced increase in H3K9me2, or that G9a activity is increased through a mechanism independent of overt expression changes, such as recruitment to chromatin or post‐translational modification. To identify the genes affected by increased H3K9 di‐methylation on a genome‐wide scale, we performed ChIP‐Seq on AAR and RM biopsies from IPC mice. This is to our knowledge the first study analyzing global H3K9me2 levels in cardiac tissue. Differential enrichment of H3K9me2 was seen in ≈14 000 genes in preconditioned myocardium, suggesting that IPC has a rapid and profound effect on the cardiac chromatin state. To identify genes that were repressed by increased levels of H3K9me2, we performed transcriptomic profiling of AAR and RM tissue from IPC mice. More than 200 genes were found to be both enriched in H3K9me2 and transcriptionally repressed in the AAR compared to the RM. Pathway analysis of this gene set revealed several pathways with known functions in IPC and cardiac biology. One example was the pathway “Regulation of actin cytoskeleton.” Polymerization of actin is believed to increase the tolerance of the cytoskeleton to stress, and the cardioprotective effect of IPC is dependent to some extent on the interaction between the KATP‐channel and the actin cytoskeleton.25 It is interesting to note that the regulation of this process seems to have an epigenetic component. Other pathways of particular interest were those pertaining to metabolism and ubiquitin‐mediated proteolysis, considering the strong links between autophagy and IPC.34 Autophagy is a highly conserved intracellular process responsible for the degradation of aggregated or misfolded proteins and damaged organelles, and plays an important role in the cellular stress response, including the response of cardiomyocytes to ischemia/reperfusion. Autophagic activity is increased in ischemic cardiomyocytes35 and confers beneficial effects in ischemia/reperfusion injury.36, 37 IPC is generally considered to induce autophagy in cardiomyocytes,38 but the underlying mechanism is poorly understood. Mtor is a serine/threonine kinase that inhibits autophagy by phosphorylating components of the UNC‐5‐like autophagy activating kinase complex.28 Therefore, of the genes identified by our bioinformatics pipeline, Mtor was chosen as the most interesting candidate for mechanistic characterization. We could confirm that IPC caused increased levels of H3K9me2 throughout the Mtor gene in the AAR of mouse hearts and that knock down of G9a inhibited H3K9me2 levels, as well as Mtor expression and cardiomyocyte autophagy. A schematic representation of the proposed mechanism is shown in Figure 6.
Figure 6.
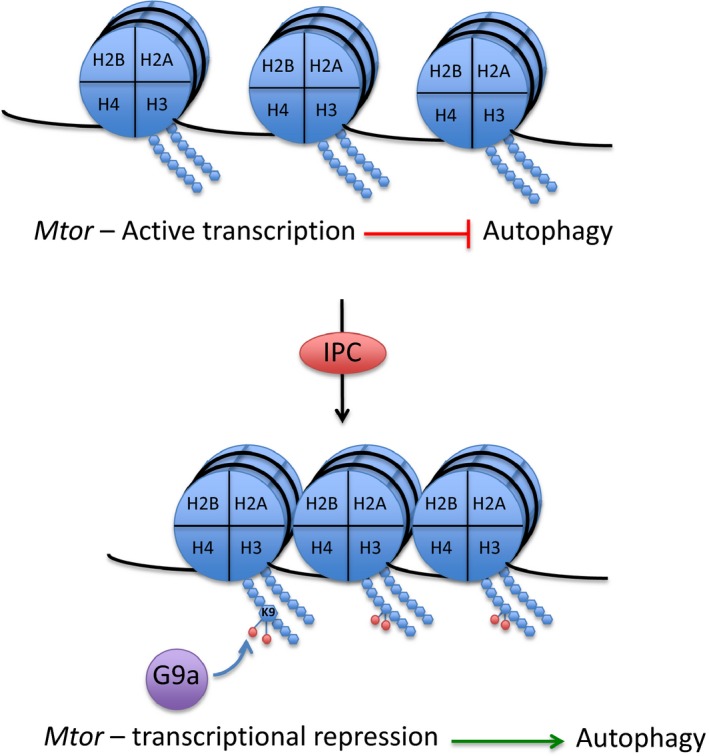
Working model. The Mtor gene is actively transcribed in cardiomyocytes, which provides constitutive inhibition of autophagy. Upon IPC‐treatment, G9a is activated and provides dimethylation of H3K9 throughout the Mtor gene, conferring transcriptional repression and initiation of autophagic activity. IPC, ischemic preconditioning.
In contrast to the results of this study, there are reports showing that inhibition of G9a induces autophagy through Mtor‐associated pathways. Li et al show that G9a is overexpressed in bladder carcinoma cells, that these cells require G9a for proliferation and survival, and that inhibition of G9a leads to an induction of autophagic cell death.39 Artal‐Martinez et al show that inhibition of G9a in pancreatic cancer cells induces autophagy through epigenetic regulation of several autophagy‐related genes.40 However, regulation of autophagy has been shown to be highly tissue and context specific,41 and the role of autophagy in cancer cells is very complex and likely to be affected by tumor type and genetic makeup.42 Therefore, comparing the results of these cells to the biologically very different cardiomyocyte is not straightforward.
Inhibition of Mtor has previously been shown to confer cardioprotection in isolated mouse hearts43 and reduce ventricular remodeling after myocardial infarction.44 Although remote ischemic conditioning has been associated with enhanced autophagy through post‐translational modification of the Mtor protein,45 the present study provides the first evidence of G9a‐dependent epigenetic regulation of Mtor expression, and a potential role for G9a in regulating autophagy in response to cardiac IPC. Further investigation into the mechanistic link between G9a and the cardioprotective effect of IPC in vivo is, however, still warranted, and will be the subject of future studies.
Sources of Funding
This work was supported by the Swedish Heart‐Lung Foundation and the Swedish Research Council. Khomtchouk wishes to acknowledge the financial support of the United States Department of Defense (DoD) through the National Defense Science and Engineering Graduate Fellowship (NDSEG) Program: this research was conducted with Government support under and awarded by DoD, Army Research Office (ARO), National Defense Science and Engineering Graduate (NDSEG) Fellowship, 32 CFR 168a.
Disclosures
None.
Supporting information
Table S1. ChIP‐Seq Read Statistics
Table S2. List of Significantly Downregulated Genes in AAR Enriched in H3K9me2
Table S3.Pathway Analysis of Downregulated, H3K9me2‐enriched Genes
Figure S1. Levels of H3K4me3 and H3K27me3 are unaltered in cardiac biopsies from IPC and sham animals. Western blot analysis of histone modifications in cardiac biopsies from the area at risk (AAR) and remote myocardium (RM) from animals (n=3) subjected to ischemic preconditioning or sham controls. Two‐way ANOVA with Bonferroni post hoc analysis was used to test the effect of treatment but revealed no statistically significant changes.
Figure S2. G9a levels are unaltered in cardiac biopsies from IPC mice. Western blot analysis of cardiac biopsies from the area at risk and remote myocardium of IPC mice (n=3) revealed no significant difference in G9a levels in the area at risk.
Figure S3. H3K9me2 heat map. Genes that were both enriched in H3K9me2 and transcriptionally repressed were identified (n=236). Differentially enriched peaks within those genes were calculated using EdgeR, and a heat map based on the read number for those peaks was generated using MicroScope.
Figure S4. Controls for the H3K9me2 ChIP‐PCR. As a control for the H3K9me2 ChIP, enrichment of H3K9me2 at the MyoD promoter and lack of H3K9me2 at the Gapdh promoter was assessed with ChIP‐qPCR on cardiac biopsies from sham mice (n=3). As a negative control, an IgG IP was performed on the same samples.
Acknowledgments
We thank Dr Catherine Kitts at the Lund University Bioimaging Center for technical assistance with the live cell imaging.
(J Am Heart Assoc. 2016;5:e004076 doi: 10.1161/JAHA.116.004076)
References
- 1. Yellon DM, Hausenloy DJ. Myocardial reperfusion injury. N Engl J Med. 2007;357:1121–1135. [DOI] [PubMed] [Google Scholar]
- 2. Vander Heide RS, Steenbergen C. Cardioprotection and myocardial reperfusion: pitfalls to clinical application. Circ Res. 2013;113:464–477. [DOI] [PMC free article] [PubMed] [Google Scholar]
- 3. Murry CE, Jennings RB, Reimer KA. Preconditioning with ischemia: injury delay of lethal cell ischemic myocardium. Circulation. 1986;74:1124–1136. [DOI] [PubMed] [Google Scholar]
- 4. Liu G, Thornton J, Van Winkle D. Protection against infarction afforded by preconditioning is mediated by A1 adenosine receptors in rabbit heart. Circulation. 1991;84:350–357. [DOI] [PubMed] [Google Scholar]
- 5. Hausenloy DJ, Yellon DM. Ischaemic conditioning and reperfusion injury. Nat Rev Cardiol. 2016;13:293–309. [DOI] [PubMed] [Google Scholar]
- 6. Marber MS, Latchman DS, Walker JM, Yellon DM. Cardiac stress protein elevation 24 hours after brief ischemia or heat stress is associated with resistance to myocardial infarction. Circulation. 1993;88:1264–1272. [DOI] [PubMed] [Google Scholar]
- 7. Hausenloy DJ, Yellon DM. The second window of preconditioning (SWOP) where are we now? Cardiovasc Drugs Ther. 2010;24:235–254. [DOI] [PubMed] [Google Scholar]
- 8. Onody A, Zvara A, Hackler L, Vigh L, Ferdinandy P, Puskas LG. Effect of classic preconditioning on the gene expression pattern of rat hearts: a DNA microarray study. FEBS Lett. 2003;536:35–40. [DOI] [PubMed] [Google Scholar]
- 9. Wilhide ME, Tranter M, Ren X, Chen J, Sartor MA, Medvedovic M, Jones WK. Identification of a NF‐KB cardioprotective gene program: NF‐KB regulation of Hsp70.1 contributes to cardioprotection after permanent coronary occlusion. J Mol Cell Cardiol. 2011;51:82–89. [DOI] [PMC free article] [PubMed] [Google Scholar]
- 10. Thompson JW, Dave KR, Young JI, Perez‐Pinzon MA. Ischemic preconditioning alters the epigenetic profile of the brain from ischemic intolerance to ischemic tolerance. Neurotherapeutics. 2013;10:789–797. [DOI] [PMC free article] [PubMed] [Google Scholar]
- 11. Zhao TC, Cheng G, Zhang LX, Tseng YT, Padbury JF. Inhibition of histone deacetylases triggers pharmacologic preconditioning effects against myocardial ischemic injury. Cardiovasc Res. 2007;76:473–481. [DOI] [PubMed] [Google Scholar]
- 12. Metzler B, Mair J, Lercher A, Schaber C, Hintringer F, Pachinger O, Xu Q. Mouse model of myocardial remodelling after ischemia: role of intercellular adhesion molecule‐1. Cardiovasc Res. 2001;49:399–407. [DOI] [PubMed] [Google Scholar]
- 13. Langmead B, Trapnell C, Pop M, Salzberg S. Ultrafast and memory‐efficient alignment of short DNA sequences to the human genome. Genome Biol. 2009;10:R25. [DOI] [PMC free article] [PubMed] [Google Scholar]
- 14. Zang C, Schones DE, Zeng C, Cui K, Zhao K, Peng W. A clustering approach for identification of enriched domains from histone modification ChIP‐Seq data. Bioinformatics. 2009;25:1952–1958. [DOI] [PMC free article] [PubMed] [Google Scholar]
- 15. Ji H, Jiang H, Ma W, Johnson DS, Myers RM, Wong WH. An integrated software system for analyzing ChIP‐chip and ChIP‐seq data. Nat Biotechnol. 2008;26:1293–1300. [DOI] [PMC free article] [PubMed] [Google Scholar]
- 16. Quinlan AR, Hall IM. BEDTools: a flexible suite of utilities for comparing genomic features. Bioinformatics. 2010;26:841–842. [DOI] [PMC free article] [PubMed] [Google Scholar]
- 17. Robinson MD, McCarthy DJ, Smyth GK. edgeR: a Bioconductor package for differential expression analysis of digital gene expression data. Bioinformatics. 2009;26:139–140. [DOI] [PMC free article] [PubMed] [Google Scholar]
- 18. Thorvaldsdóttir H, Robinson JT, Mesirov JP. Integrative Genomics Viewer (IGV): high‐performance genomics data visualization and exploration. Brief Bioinform. 2013;14:178–192. [DOI] [PMC free article] [PubMed] [Google Scholar]
- 19. Robinson JT, Thorvaldsdóttir H, Winckler W, Guttman M, Lander ES, Getz G, Mesirov JP. Integrative genomics viewer. Nat Biotechnol. 2011;29:24–26. [DOI] [PMC free article] [PubMed] [Google Scholar]
- 20. Ye J, Coulouris G, Zaretskaya I, Cutcutache I, Rozen S, Madden TL. Primer‐BLAST: a tool to design target‐specific primers for polymerase chain reaction. BMC Bioinformatics. 2012;13:134. [DOI] [PMC free article] [PubMed] [Google Scholar]
- 21. Livak KJ, Schmittgen TD. Analysis of relative gene expression data using real‐time quantitative PCR and the 2^(‐ΔΔCT) method. Methods. 2001;25:402–408. [DOI] [PubMed] [Google Scholar]
- 22. Li B, Carey M, Workman JL. The role of chromatin during transcription. Cell. 2007;128:707–719. [DOI] [PubMed] [Google Scholar]
- 23. Zhang B, Kirov S, Snoddy J. WebGestalt: an integrated system for exploring gene sets in various biological contexts. Nucleic Acids Res. 2005;33:W741–W748. [DOI] [PMC free article] [PubMed] [Google Scholar]
- 24. Cai ZP, Shen Z, Van Kaer L, Becker LC. Ischemic preconditioning‐induced cardioprotection is lost in mice with immunoproteasome subunit low molecular mass polypeptide‐2 deficiency. FASEB J. 2008;22:4248–4257. [DOI] [PMC free article] [PubMed] [Google Scholar]
- 25. Baines CP, Liu GS, Birincioglu M, Critz SD, Cohen MV, Downey JM. Ischemic preconditioning depends on interaction between mitochondrial KATP channels and actin cytoskeleton. Am J Physiol. 1999;276:H1361–H1368. [DOI] [PubMed] [Google Scholar]
- 26. Arrell DK, Elliott ST, Kane LA, Guo Y, Ko YH, Pedersen PL, Robinson J, Murata M, Murphy AM, Marbán E, Van Eyk JE. Proteomic analysis of pharmacological preconditioning: novel protein targets converge to mitochondrial metabolism pathways. Circ Res. 2006;99:706–714. [DOI] [PubMed] [Google Scholar]
- 27. Khomtchouk BB, Hennessy JR, Wahlestedt C. MicroScope: ChIP‐seq and RNA‐seq software analysis suite for gene expression heatmaps. BMC Bioinformatics. 2016;17:390. [DOI] [PMC free article] [PubMed] [Google Scholar]
- 28. Kim YC, Guan KL. MTOR: a pharmacologic target for autophagy regulation. J Clin Invest. 2015;125:25–32. [DOI] [PMC free article] [PubMed] [Google Scholar]
- 29. Han Z, Cao J, Song D, Tian L, Chen K, Wang Y, Gao L, Yin Z, Fan Y, Wang C. Autophagy is involved in the cardioprotection effect of remote limb ischemic postconditioning on myocardial ischemia/reperfusion injury in normal mice, but not diabetic mice. PLoS One. 2014;9:e86838. [DOI] [PMC free article] [PubMed] [Google Scholar]
- 30. Huang C, Yitzhaki S, Perry CN, Liu W, Giricz Z, Mentzer RM, Gottlieb RA. Autophagy induced by ischemic preconditioning is essential for cardioprotection. J Cardiovasc Transl Res. 2010;3:365–373. [DOI] [PMC free article] [PubMed] [Google Scholar]
- 31. Shankar SR, Bahirvani AG, Rao VK, Bharathy N, Ow JR, Taneja R. G9a, a multipotent regulator of gene expression. Epigenetics. 2013;8:16–22. [DOI] [PMC free article] [PubMed] [Google Scholar]
- 32. Das M, Das S, Lekli I, Das DK. Caveolin induces cardioprotection through epigenetic regulation. J Cell Mol Med. 2012;16:888–895. [DOI] [PMC free article] [PubMed] [Google Scholar]
- 33. Zhao TC, Du J, Zhuang S, Liu P, Zhang LX. HDAC inhibition elicits myocardial protective effect through modulation of MKK3/Akt‐1. PLoS One. 2013;8:2–10. [DOI] [PMC free article] [PubMed] [Google Scholar]
- 34. Yan W‐J, Dong H‐L, Xiong L‐Z. The protective roles of autophagy in ischemic preconditioning. Acta Pharmacol Sin. 2013;3418:636–643. [DOI] [PMC free article] [PubMed] [Google Scholar]
- 35. Gustafsson ÅB, Gottlieb R. Recycle or die: the role of autophagy in cardioprotection. J Mol Cell Cardiol. 2008;44:654–661. [DOI] [PMC free article] [PubMed] [Google Scholar]
- 36. Xie M, Kong Y, Tan W, May H, Battiprolu PK, Pedrozo Z, Wang Z, Morales C, Luo X, Cho G, Jiang N, Jessen ME, Warner JJ, Lavandero S, Gillette TG, Turer AT, Hill J. HDAC inhibition blunts ischemia/reperfusion injury by inducing cardiomyocyte autophagy. Circulation. 2014;129:1139–1151. [DOI] [PMC free article] [PubMed] [Google Scholar]
- 37. Dosenko VE, Nagibin VS, Tumanovskaya LV, Zagoriy VY, Moibenko AA, Vaage J. Proteasome inhibitors eliminate protective effect of postconditioning in cultured neonatal cardiomyocytes. Fiziol Zh. 2006;52:15–24. [PubMed] [Google Scholar]
- 38. Gottlieb RA, Finley KD, Mentzer RM. Cardioprotection requires taking out the trash. Basic Res Cardiol. 2009;104:169–180. [DOI] [PMC free article] [PubMed] [Google Scholar]
- 39. Li F, Zeng J, Gao Y, Guan Z, Ma Z, Shi Q, Du C, Jia J, Xu S, Wang X, Chang L, He D, Guo P. G9a inhibition induces autophagic cell death via AMPK/mTOR pathway in bladder transitional cell carcinoma. PLoS One. 2015;10:e0138390. [DOI] [PMC free article] [PubMed] [Google Scholar]
- 40. Artal‐Martinez de Narvajas A, Gomez TS, Zhang J‐S, Mann AO, Taoda Y, Gorman J, Herreros‐Villanueva M, Gress TM, Ellenrieder V, Bujanda L, Kim D‐H, Kozikowski AP, Koenig A, Billadeau DD. Epigenetic regulation of autophagy by the methyltransferase G9a. Mol Cell Biol. 2013;33:3983–3993. [DOI] [PMC free article] [PubMed] [Google Scholar]
- 41. He C, Klionsky DJ. Regulation mechanisms and signalling pathways of autophagy. Annu Rev Genet. 2009;43:67. [DOI] [PMC free article] [PubMed] [Google Scholar]
- 42. Kimmelman AC. The dynamic nature of autophagy in cancer. Genes Dev. 2011;25:1999–2010. [DOI] [PMC free article] [PubMed] [Google Scholar]
- 43. Khan S, Salloum F, Das A, Xi L, Vetrovec G, Kukreja R. Rapamycin confers preconditioning‐like protection against ischemia–reperfusion injury in isolated mouse heart and cardiomyocytes. J Mol Cell Cardiol. 2006;41:256–264. [DOI] [PubMed] [Google Scholar]
- 44. Buss SJ, Muenz S, Riffel JH, Malekar P, Hagenmueller M, Weiss CS, Bea F, Bekeredjian R, Schinke‐Braun M, Izumo S, Katus HA, Hardt SE. Beneficial effects of mammalian target of rapamycin inhibition on left ventricular remodeling after myocardial infarction. J Am Coll Cardiol. 2009;54:2435–2446. [DOI] [PubMed] [Google Scholar]
- 45. Rohailla S, Clarizia N, Sourour M, Sourour W, Gelber N, Wei C, Li J, Redington AN. Acute, delayed and chronic remote ischemic conditioning is associated with downregulation of mTOR and enhanced autophagy signaling. PLoS One. 2014;9:e111291. [DOI] [PMC free article] [PubMed] [Google Scholar]
Associated Data
This section collects any data citations, data availability statements, or supplementary materials included in this article.
Supplementary Materials
Table S1. ChIP‐Seq Read Statistics
Table S2. List of Significantly Downregulated Genes in AAR Enriched in H3K9me2
Table S3.Pathway Analysis of Downregulated, H3K9me2‐enriched Genes
Figure S1. Levels of H3K4me3 and H3K27me3 are unaltered in cardiac biopsies from IPC and sham animals. Western blot analysis of histone modifications in cardiac biopsies from the area at risk (AAR) and remote myocardium (RM) from animals (n=3) subjected to ischemic preconditioning or sham controls. Two‐way ANOVA with Bonferroni post hoc analysis was used to test the effect of treatment but revealed no statistically significant changes.
Figure S2. G9a levels are unaltered in cardiac biopsies from IPC mice. Western blot analysis of cardiac biopsies from the area at risk and remote myocardium of IPC mice (n=3) revealed no significant difference in G9a levels in the area at risk.
Figure S3. H3K9me2 heat map. Genes that were both enriched in H3K9me2 and transcriptionally repressed were identified (n=236). Differentially enriched peaks within those genes were calculated using EdgeR, and a heat map based on the read number for those peaks was generated using MicroScope.
Figure S4. Controls for the H3K9me2 ChIP‐PCR. As a control for the H3K9me2 ChIP, enrichment of H3K9me2 at the MyoD promoter and lack of H3K9me2 at the Gapdh promoter was assessed with ChIP‐qPCR on cardiac biopsies from sham mice (n=3). As a negative control, an IgG IP was performed on the same samples.