

Abstract
Background
Cytochrome oxidase (COX) IV complex regulates energy production in mitochondria. Impaired COX gene expression is related to obesity and type 2 diabetes mellitus, but whether it is directly related to the incidence of cardiovascular events is unknown. We investigated whether COX gene expression in monocytes is predictive for cardiovascular events in coronary artery disease patients. To avoid monocyte isolation from fresh blood, we then aimed to validate our findings in monocyte‐derived microvesicles isolated from plasma.
Methods and Results
We enrolled 142 consecutive patients undergoing diagnostic coronary angiography between June 2010 and January 2011 and followed 67 patients with stable coronary artery disease prospectively for at least 3 years. Twenty‐two patients experienced a new cardiovascular event (32.8%). Circulating CD14+ monocytes and microvesicles were isolated with magnetic beads, and COX mRNA levels were measured with quantitative polymerase chain reaction, after normalization with 5 validated house‐keeping genes. Patients in the lowest tertile of mitochondrial cytochrome oxidase, subunit I (MT‐COI) in monocytes at baseline had a higher risk for developing a new event after adjusting for age, sex, (ex)smoking, body mass index, blood pressure, diabetes mellitus, low‐density lipoprotein– and high‐density lipoprotein–cholesterol, triglycerides, high‐sensitivity C‐reactive protein, interleukin‐6, and number of diseased vessels (harzard ratio [HR], 3.95; 95% CI, 1.63–9.57). Patients in the lowest tertile of MT‐COI in monocyte‐specific microvesicles had also a higher risk of developing a new event (adjusted HR, 5.00; 95% CI, 1.77–14).
Conclusions
In the current blinded study, low MT‐COI in monocytes of coronary artery disease patients identifies a population at risk for new cardiovascular events. For the first time, we show that signatures in monocyte‐specific microvesicles in plasma have similar predictive properties.
Keywords: blood cell, cardiovascular events, gene, ischemia, microvesicles
Subject Categories: Inflammation, Ischemia, Oxidant Stress, Gene Expression & Regulation
Introduction
Coronary artery disease (CAD) is a lifelong process resulting from the interaction of many risk factors, environmental influences, and genetic predisposition. Although the careful evaluation of medical history and standard risk factors provides essential information, risk identification is aggravated by interindividual differences, complex interplay between different risk factors, and risk modifications attributed to medical therapies. After addressing the conventional risk factors, some patients still have a high residual cardiovascular risk. In light of these limitations, alternative and refined risk stratifiers are desirable. Because inflammation contributes to the development of atherosclerosis and CAD, the inflammatory marker, high‐sensitivity C‐reactive protein (hs‐CRP), has been proposed as a possible noninvasive parameter that could reflect the cumulative cardiovascular burden as well as the responsiveness to therapies.1 In addition, various cell‐surface receptors on monocytes allowed characterization of different monocyte subsets with differences in association with CAD.2, 3 However, data on gene signatures in human monocytes, which are associated with incident CAD manifestations, are sparse.
It has been proposed that mitochondrial dysfunction resulting in mitochondrial oxidative stress contributes to development of age‐related metabolic changes and CAD.4 Dysfunction of the cytochrome oxidase (COX) IV complex, the terminal node and rate‐limiting step in the mitochondrial electron transport chain, is associated with mitochondrial oxidative stress,5, 6 a condition associated with obesity, metabolic syndrome, and type 2 diabetes mellitus (T2DM).7, 8 The bigenomic COX IV complex is composed of 13 subunits. The mitochondrial genome encodes subunits 1, 2, and 3, which form the catalytic core of the complex9; the others are nuclear encoded. Mitochondrial cytochrome c oxidase, subunit I (MT‐COI) is the first gene in the polycistronic mitochondrial DNA, and a single missense mutation in mouse MT‐COI was associated with loss of COX activity,10 despite normal assembly of the complex IV.11 Cytochrome c oxidase subunit IV isoform 1 (COX4I1) is required for the allosteric feedback inhibition of the enzyme by its indirect product, ATP.12, 13 Cytochrome oxidase 10 (COX10) is required for COX biogenesis.14 Recently, we found that low COX4I1 and low COX10 were associated with obesity and T2DM, 2 risk factors for CAD.15 However, the association of COX genes with CAD or with outcome in CAD patients has never been investigated. We therefore tested here the association of these genes in peripheral blood monocytes with incident CAD. Although we found that detection of MT‐COI in peripheral blood monocytes is feasible and that low MT‐COI in monocytes is associated with a higher risk of a new event, a critical limitation of monocytes for diagnostic use is that they have to be isolated freshly from blood and that basically no sizeable biobanks are available. Therefore, we also investigated CD14+ microvesicles, which can be isolated from plasma. Microvesicles in general, and exosomes together with their delivered content in particular, have been proposed to be key players in atherosclerosis,16, 17 for example, by mediating monocyte and endothelial cell activation and response to inflammation, vessel infiltration, and induction of coagulation.18 Hence, microvesicles and exosomes are considered as novel sources for plasma‐derived markers.19, 20 For the first time, we show that a gene signature in CD14+ monocytes and in CD14+ microvesicles show a similar association with incident CAD.
Methods
Patients and Follow‐up
This study complies with the Declaration of Helsinki, and the study protocol was approved by the Medical Ethics Committee of the University Hospital Leuven (Leuven, Belgium). This study was approved by the institutional review board. All participants gave written informed consent. Consecutive patients undergoing quantitative coronary angiography (QCA) between June 8, 2010 and January 21, 2011 were prospectively enrolled by 2 physicians (P.S., S.J.). Patients with a history of cancer, renal insufficiency, inflammatory disease, treatment with corticosteroids or immunosuppressive drugs, and significant valvular disease were excluded. Presence of CAD was defined as an epicardial coronary stenosis of at least 30% in at least 1 of the coronary arteries. All QCAs were independently analyzed at a central angiography core lab by 2 experienced readers who were unaware of patient identity and clinical conditions. Localization and extent of luminal narrowing was assessed for the 15 segments of the major coronary arteries. At least 3‐year follow‐up was planned. New cardiovascular events were defined as cardiovascular death, recurrent myocardial infarction (MI), ischemic stroke, or recurrent ischemia requiring hospitalization. For an exploratory post‐hoc analysis, we later (April 2016) obtained monocytes from 10 additional acute MI (AMI) patients (in addition to 11 patients in the first cohort).
Isolation of Monocytes and Microvesicles
CD14+ monocytes were isolated from the Histopaque‐1077 leukocyte fraction using CD14 microbeads and an large separation (LS) column in a Midi‐Magnetic Cell Isolation Separator (MACS; Miltenyi Biotec, Cambridge, MA), as previously published.21 Only monocytes that were isolated within 2 hours of blood sampling were analyzed further. The method for isolation of monocyte‐derived microvesicles was adapted from this method. Plasma was freshly frozen and stored in aliquots at −80°C. Microvesicles were isolated from plasma that was thawed at the time of microvesicle isolation. Plasma (1 mL) was centrifuged at 10 000g for 10 minutes at 4°C and supernatant was collected for isolation of microvesicles. For positive selection of CD14+ microvesicles, 20 μL of CD14+ microBeads (human, Miltenyi 130‐050‐201; Miltenyi Biotec) were added to the supernatant and incubated for 30 minutes in the dark at 4°C. The sample was diluted 2× in DPBS (14190; Gibco, Grand Island, NY) and applied to an LS column (Miltenyi 130‐042‐201; Miltenyi Biotec). The column was washed 3× with 500 μL of DPBS, removed from the separator, and placed on a 15‐mL collection tube. Five hundred microliters of DPBS was put onto the column and magnetic‐labeled microvesicles were flushed out by firmly pushing the plunger into the column. Five hundred microliters were collected in a RNAse‐free tube and stored at −80°C.
Total exosomes were isolated from plasma with size‐exclusion chromatography (SEC), as described previously.22 Briefly, a 1.5‐mL aliquot of plasma was applied to a 10‐mL syringe packed with Sepharose 2B (Sigma‐Aldrich, St. Louis, MO). Next, 0.5‐mL fractions were eluted with PBS. Exclusion volume fractions (nos. 7, 8, 9, and 10) were collected. Typically, these fractions contain less than 5% of high‐density lipoprotein (HDL) and less than 1% of protein (4.8±1% and 0.65±0.3%, respectively). HDL was present mainly in fractions 18 to 20 (32±2% of total) and protein in fractions 19 to 21 (36±2% of total).
Nanoparticle Tracking Analysis and Electron Microscopy
Concentration and size distribution of particles in exosome samples were measured with Nanoparticle Tracking Analysis (NTA) NanoSight (LM10; Nanosight, Amesbury, UK), equipped with an electron multiplying charge coupled device camera, a 488‐nm laser, and a sample loading pump. Silica beads (100‐nm diameter; Microspheres‐Nanospheres, Cold Spring, NY) were used to configure and calibrate the instrument. Samples were diluted 2‐ to 10‐fold in PBS to reduce the number of particles in the field of view below 200/image. Of each sample, 6 videos, each of 30‐seconds duration, were captured with the camera shutter set at 33.31 ms and the camera gain set at 400. All samples were measured using the same detection threshold.
For studying microvesicles by electron microscopy (EM), samples were prepared by both negative staining for conventional observation, or plunge‐frozen for cryo‐transmission electron microscopy (cryo‐TEM). For negative staining, 3 μL of thawed sample was deposited on glow‐discharged carbon‐coated 400 mesh copper grids for 1 minute. Subsequently, grids were washed briefly 3× on drops of MilliQ filtered H2O and stained for 1 minute with 1% filtered uranyl acetate in H2O. After blotting and drying, grids were observed in a JEOL JEM2100, equipped with a Gatan ultrascan 1 Mpxl camera (JEOL USA, Inc., Peabody, MA). For cryo‐TEM, samples were vitrified with an ethane plunge‐freezer (EMBO, Precision Engineering, Heidelberg, Germany). To this end, 2.5 μL of sample were applied to a glow‐discharged carbon‐coated 300 mesh lacey grid held by the plunger forceps, incubated for 30 seconds, blotted for 3 seconds, plunged into liquid ethane (−180°C), and stored in liquid nitrogen. Grids were loaded into a Gatan 914 high‐tilt cryo‐holder and observed in a JEOL JEM1400 at 80 kV equipped with an Olympus SIS Quemesa 11Mpxl camera (JEOL USA, Inc.). Images were taken under low‐dose conditions, limiting exposure of the region of interest to 1000 electrons per nm².
RNA Isolation and Quantitative Real‐Time Polymerase Chain Reaction Analysis
RNA isolation from monocytes and cDNA transcription was performed at KU Leuven as described previously.15
For analysis of gene expressions in microvesicles, Biogazelle isolated RNA from microvesicles, prepared at KU Leuven, using the miRNeasy serum/plasma kit (Qiagen, Hilden, Germany) following the manufacturer instructions. Previously, it was shown that a single freeze/thaw process had no significant effect on RNA integrity and quantity of plasma RNA.23 RNA concentration (mean, 20 ng/μL) was determined using the NanoDrop 2000 UV‐Vis spectrophotometer (Thermo Fisher Scientific, Waltham, MA). cDNA synthesis was performed using the iScript Advanced cDNA Synthesis Kit (Bio‐Rad Laboratories, Hercules, CA) with 15 μL of total RNA. Before cDNA quantification in microvesicles, a gene‐specific PCR‐based preamplification step consisting of 12 cycles was performed using PreAmp Supermix (Bio‐Rad Laboratories). A total of 25 ng of cDNA (total RNA equivalents) was used as input in each preamplification reaction. The preamplified cDNA product was diluted 1:5 before gene expression profiling. The quality of the preamplified cDNA was assessed on all samples by means of 2 different human universally expressed genes. Blinded RNA analysis of extracts of microvesicles was performed using TaqMan RNA assays from Life Technologies by Biogazelle (Ghent, Belgium). qbase+ software was used for polymerase chain reaction (PCR) efficiency correction, multiple reference gene normalization, inter‐run calibration and error propagation, and quality control on the post‐qPCR (quantitative PCR) data.24 For normalization, a set of 5 reference genes were identified: B2M (beta‐2‐microglobulin); PPIA (peptidylprolyl isomerase A); RPL13A (ribosomal protein L13a); RPS18 (ribosomal protein S18); and YWHAZ (tyrosine 3‐monooxygenase/tryptophan 5‐monooxygenase activation protein, zeta). Reverse‐transcription PCR analysis was performed as previously published.15, 25 Table 1 shows MIQE contexts and interval of genes. Replicate variability was within the set limit of 0.5 cycles for 98.2% of sample‐target combinations in monocytes and for 94.27% of sample‐target combinations in microvesicles. Forward primer for measuring CD14 expression was CACACTCGCCTGCCTTTTC; reverse primer was GCCCAGTCCAGGATTGTCA.
Table 1.
MIQE Contexts and Interval of Genes Measured in Extracts of Extracellular Vesicles
| Gene Symbol | MIQE_Context | MIQE_Interval |
|---|---|---|
| MT‐COI | CTCGCCACACTCCACGGAAGCAATATGAAATGATCTGCTGCAGTGCTCTGAGCCCTAGGATTCATCTTTCTTTTCACCGTAGGTGGCCTGACTGGCATTGTA | Chr16:85834841‐85838607 |
| COX41 | TGGCAAGCGAGCAATTTCCACCTCTGTGTGTGTACGAGCTCATGAAAGTGTTGTGAAGAGCGAAGACTTTTCGCTCCCAGCTTATATGGATCGGCGTGACCACCCCTTG | chr16:85834841‐85838607 |
| COX10 | CAAATGAAAAGGAATTGATAGAACTAGAGCCAGACTCAGTAATTGAAGACTCAATAGATGTAGGGAAAGAGACAAAAGAGGAAA | chr17:13980212‐13980295 |
| TFAM | ACGCCGGAGGGTCGCACGCGGGTTCCAGTTGTGATTGCTGGAGTTGTGTATTGCCAGGAGGCTCTCCGAGATTGGGGTCGGGTCACTGCCTCATCCA | chr10:60145203‐60145299 |
| B2M | CTATGTGTCTGGGTTTCATCCATCCGACATTGAAGTTGACTTACTGAAGAATGGAGAGAGAATTGAAAAAGTGGAGCATTCAGACTTGTCTTTCAGCAAGGACTGGTCTTTCTATCT | chr15:45007688‐45007804 |
| PPIA | CCATTGCTGACTGTGGACAACTCGAATAAGTTTGACTTGTGTTTTATCTTAACCACCAGATCATTCCTTCTGTAGCTCAGGAG | chr7:44840993‐44841075 |
| RPL13A | GTGCCACAGGCAGCCCTGGGACATAGGAAGCTGGGAGCAAGGAAAGGGTCTTAGTCACTGCCTCCCGAAGTTGCTTGAAAGCACTCGGAGAA | chr19:49995166‐49995257 |
| RPS18 | CCGCCGTGGCCGCACCGTGGGTGTGTCCAAGAAGAAATAAGTCTGTAGGCCTTGTCTGTTAATAAATAGTTTATATACCT | chr6:33244204‐33244283 |
| YWHAZ | GCCAGACCCAGTCTGATAGGATGTGTTGGTTGCATTTCCTTTTTGCTGATTTCAAAAGCTTCTTGGTATGCTTGTTGTGACTGATCGACAATCCCTT | chr8:101936433‐101937146 |
B2M, PPIA, RPL13A, RPS18, and YWHAZ were used as reference genes for normalizing expressions of MT‐COI, COX4I1, COX10, and TFAM. B2M indicates beta‐2‐microglobulin; COX10, cytochrome oxidase 10; COX4I1, cytochrome c oxidase subunit IV isoform 1; MT‐COI, mitochondrial cytochrome c oxidase, subunit I; PPIA, peptidylprolyl isomerase A; RPL13A, ribosomal protein L13a; RPS18, ribosomal protein S18; TFAM, mitochondrial transcription factor; YWHAZ, tyrosine 3‐monooxygenase/tryptophan 5‐monooxygenase activation protein, zeta polypeptide.
Other Measurements
Total and HDL‐cholesterol (HDL‐C) and triglyceride (TG) levels were determined with enzymatic methods (Boehringer Mannheim GmbH, Mannheim, Germany). Low‐density lipoprotein (LDL)‐cholesterol (LDL‐C) levels were calculated with the Friedewald formula. Plasma glucose was measured with the glucose oxidase method (on a Vitros 750XRC; Johnson & Johnson, Raritan, NJ) and insulin with an immunoassay (Biosource Technologies Inc., Vacaville, CA). Adiponectin (ADN), oxidized LDL (ox‐LDL), and interleukin (IL)‐6 were measured with ELISA (Mercodia AB [Uppsala, Sweden] and R&D Systems [Minneapolis, MN]). hs‐CRP (Beckman Coulter, Brea, CA) was measured on an Image 800 Immunochemistry System and high‐sensitivity troponin T on a Modular E system (Roche Diagnostics, Indianapolis, IN). All laboratory assessments were performed without knowledge of clinical data. Hypertension was defined as systolic blood pressure (SBP) >140 mm Hg or diastolic blood pressure (DBP) >90 mm Hg based on 3 consecutive seated measurements or therapy with antihypertensive medication and diabetes mellitus as fasting serum glucose levels >125 mg/dL or therapy with oral hypoglycemic agents or insulin.
Statistical Analysis
Two groups of continuous variables with normal distribution were compared with the Student t test; 2 groups of continuous variables without normal distribution were compared with the Mann–Whitney U test. Three groups of continuous variables without normal distribution were compared with the Kruskal–Wallis test followed by Dunn's multiple comparisons test. For comparison of categorical data, Fisher's exact test was used (GraphPad Prism 6; GraphPad Software Inc., La Jolla, CA). Kaplan–Meier survival plots were generated to study the association between MT‐COI (tertiles) and the time until participants developed a first new event. Because Kaplan–Meier analysis showed that patients with low MT‐COI developed a new event earlier, we also performed Cox proportional hazard regression analysis using 6 models. Model 1 is unadjusted. Model 2 is adjusted for age, sex, and (ex)smoking. Model 3 is adjusted for model 2 covariates and for body mass index (BMI), blood pressure (BP), and T2DM. Model 4 is adjusted for model 3 covariates and for HDL‐ and LDL‐C and TG. Model 5 is adjusted for model 4 covariates and hs‐CRP and IL‐6. Model 6 is adjusted for model 5 covariates and number of diseased vessels. We also performed multivariable logistic regression analysis with the first new event as outcome using a model that contained MT‐COI in microvesicles and MT‐COI in monocytes together with all covariates in multivariate model 6 described above. Kaplan–Meier, Cox proportional hazard regression, and multiple regression analysis were performed with MedCalc statistical software (MedCalc, Ostend, Belgium) for biomedical research. P values of less than 0.05 were considered as statistically significant.
Results
Patients and Follow‐up
We obtained monocytes from 142 consecutive patients between June 8, 2010 and January 21, 2011 within 2 hours of blood sampling. Thirty‐seven patients were excluded from the present analyses: 18 had valvular disease, 9 had cancer, 3 had renal insufficiency, 2 had inflammatory disease, and 3 were treated with corticosteroids and 2 with immunosuppressive drugs. Of the remaining 105 patients, 27 had no CAD, 67 had stable CAD, and 11 had an acute coronary syndrome (ACS): 8 had ST elevation MI (STEMI) and 3 non‐STEMI. Intraobserver variability of QCA of observer 1 ranged from −6.6% to 6.6% (95% CI) and −8.0% to 7.5% for observer 2. Interobserver variability ranged from −10.4% to 9.6%. This variability was not influenced by vessel size.
Patients with stable CAD were followed up for at least 3 years. Twenty‐two patients (32.8%) experienced at least 1 new cardiovascular event: cardiovascular death (n=2); ischemic stroke (n=2); recurrent MI (n=1); and recurrent ischemia requiring hospitalization (n=17, of which 1 patient had in‐stent restenosis). Characteristics of CAD patients with and without a new event are shown in Table 2. There was no difference in baseline characteristics, except that patients with a new event were younger (P=0.021) and had lower ADN (P=0.037).
Table 2.
Demographic and Clinical Characteristics of CAD Patients According to New Event
| Without Event (n=45) | With Event (n=22) | P Value | |
|---|---|---|---|
| Diseased vessels (1, 2, 3; n) | 14, 17, 14 | 3, 11, 8 | 0.297 |
| Age, y | 58±6.4 | 54±7.6 | 0.021 |
| Sex (n male) | 31 | 15 | 0.735 |
| SBP, mm Hg | 142±19 | 139±19 | 0.544 |
| DBP, mm Hg | 80±12 | 79±13 | 0.651 |
| Smoker; ex‐smoker, n | 13;23 | 6;10 | 0.459 |
| BMI, kg/m2 | 27±2.9 | 26±4.3 | 0.322 |
| Hypertension, n | 35 | 14 | 0.220 |
| T2DM, n | 7 | 3 | 1.00 |
| Leptin, ng/mL | 10±9.1 | 9.6±6.8 | 0.724 |
| ADN, μg/mL | 8.1±4.7 | 11±7.2 | 0.037 |
| HOMA‐IR | 7.6±8.7 | 6.4±8.2 | 0.607 |
| TG, mg/dL | 148±90 | 118±54 | 0.149 |
| LDL‐C, mg/dL | 88±31 | 90±31 | 0.813 |
| HDL‐C, mg/dL | 44±11 | 44±12 | 0.976 |
| IL‐6, pg/mL | 3.2±1.8 | 3.5±2.2 | 0.661 |
| hs‐CRP, mg/L | 3.0±2.7 | 2.4±2.4 | 0.370 |
| ox‐LDL, IU/L | 46±19 | 52±20 | 0.289 |
| Metformin use, n | 4 | 2 | 0.978 |
| Insulin use, n | 2 | 1 | 0.985 |
| ACE‐inhibitor use, n | 14 | 3 | 0.101 |
| Angiotensin‐II‐receptor antagonist use, n | 6 | 3 | 0.972 |
| Beta‐blocker use, n | 21 | 11 | 0.929 |
| Ca‐antagonist use, n | 9 | 4 | 0.793 |
| Statin use, n | 29 | 18 | 0.120 |
| No. of monocytes, ×105 | 2.61±1.37 | 2.29±0.97 | 0.256 |
Data shown are means±SD. For continuous variables with normal distribution, the Student t test was used; for categorical data, Fisher's exact test was used. ACE indicates angiotensin‐converting enzyme; ADN, adiponectin; BMI, body mass index; CAD, coronary artery disease; DBP, diastolic blood pressure; HDL‐C, high‐density lipoprotein cholesterol; HOMA‐IR, homeostasis model assessment of insulin resistance; hs‐CRP, high‐sensitivity C‐reactive protein; IL, interleukin; LDL‐C, low‐density lipoprotein cholesterol; ox‐LDL, oxidized low‐density lipoprotein; SBP, systolic blood pressure; T2DM, type 2 diabetes mellitus; TG, triglycerides.
Characterization of Monocytes and Microvesicles
Purity of isolated CD14+ monocytes was >95%, as previously published.21 Numbers of CD14+ monocytes isolated from 1 mL of blood were similar for CAD patients without and with a new cardiovascular event (Table 2). For CD14+ microvesicles, the representative distribution profiles obtained with Malvern Nanoparticle Tracking Analysis (NanoSight) system is shown in Figure 1. Peak sizes were around 110 nm and were not different between CAD patients with and without a new event. Mean concentration of CD14+ microvesicles in analyzed fractions with size ranging from 30 to 200 nm was ≈5×10⁶/mL compared to 5×10³/mL in fractions ranging in size from 500 to 750 nm. Cryo‐EM showed that most microvesicles ranged in size between 40 and 100 nm and thus were exosomes26, 27 (Figure 1). Others ranged in size between 100 and 200 nm; we cannot exclude that they might be the result of fusion of exosomes. Also, the number of microvesicles isolated from 1 mL of plasma was not different between CAD patients with and without a new event (Figure 1).
Figure 1.
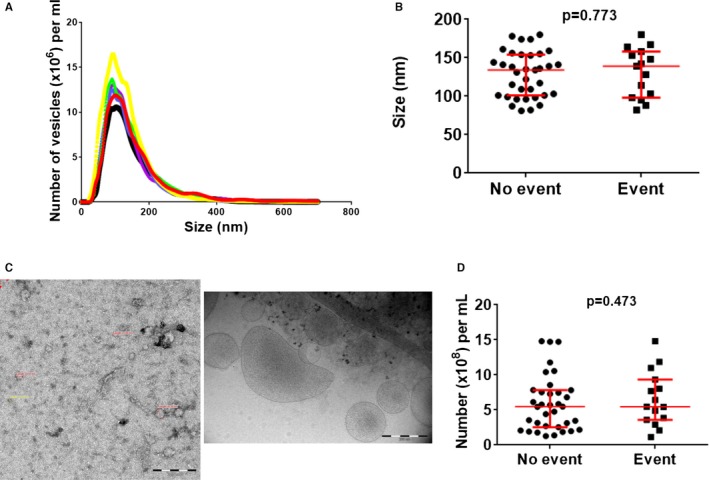
Characterization of microvesicles. A, Representative distribution profiles of microvesicles isolated form plasma obtained with the Malvern Nanoparticle Tracking Analysis (NanoSight, Amesbury, UK) system. B, Scatter plots of peak sizes (with median and interquartile range in red); peak sizes were around 110 nm and were not different between patients with and without new event. C, Negatively stained (left) and cryo‐electron microscopy (right) pictures showing that most microvesicles ranged in size between 40 and 100 nm and thus were exosomes. D, Scatter plots of number of exosomes (with median and interquartile range in red) isolated from 1 mL of plasma; numbers were not different between groups. P values were determined with the Mann–Whitney U test.
We tested longitudinal stability of RNA expression in serial samples of monocytes obtained from 12 persons at weeks 0, 1, and 2. Blood monocytes were isolated freshly, RNA was extracted, and MT‐COI, COX4I1, and COX10 expression was measured by qPCR. At week 1, expression of MT‐COI was 1.01±0.11 (mean±SD), that of COX10 1.01±0.13, and that of COX4I1 1.01±0.11. At week 2, expression of MT‐COI was 1.01±0.15, that of COX10 1.01±0.13, and that of COX4I1 1.01±0.11. At week 3, expression of MT‐COI was 1.02±0.15, that of COX10 1.01±0.14, and that of COX4I1 1.01±0.10. P value, determined by a repeated‐measures test, was 0.89 for MT‐COI, 0.96 for COX4I1, and 0.95 for COX10. Receiver operating characteristic curves of weeks 0, 1, and 2 were compared. Mean areas under curves (AUCs) were 0.53 for MT‐COI, 0.54 COX4I1, and 0.56 for COX10. AUC=0.50 means that there is no evidence that the data obtained with the test distinguish between serial samples. Mean within‐group variability was 12% for MT‐COI, 11% for COX4I1, and 11% for COX10.
We compared 2 independent biological samples from 8 patients. Variation of CD14+ microvesicle peak size was 8.2±4.9%. Variation of microvesicle number in 2 independent biological samples from 8 patients was 6.4±5.4%. We analyzed microvesicles from these plasma samples before and after storage at −80°C for 3 months before thawing. Number of microvesicles was 7.23±5.53 before and 7.32±5.14 after storage (P=0.954).
We compared total microvesicles isolated with SEC with CD14+ microvesicles isolated from same plasma samples (n=8). Mean peak size of total microvesicles was 141±23 nm compared to 144±31 for CD14+ microvesicles (paired P=0.534; Figure 2). Again, mean concentration of microvesicles in fractions ranging in size from 500 to 750 nm was 1000‐fold lower than in fractions ranging in size from 30 to 200 nm. CD14+ microvesicles accounted for 18±12% of total microvesicles (4.7±3.1×10⁸/mL vs 27±6.1×10⁸/mL plasma; P<0.0001; Figure 2). Overall, 94±11% of CD14 measured in extracts of total microvesicles was recovered in extracts of CD14+ microvesicles. However, MT‐COI (1.00±0.47 vs 0.23±0.24; P=0.0039) and COX4 I1 (1.02±0.27 vs 0.49±0.07; P=0.0014) was higher in CD14+ microvesicles than in total microvesicles, normalizing for the same housekeeping genes (Figure 2). COX10 (1.00±0.69 vs 0.30±0.15; P=0.038) was also higher in CD14+ microvesicles.
Figure 2.
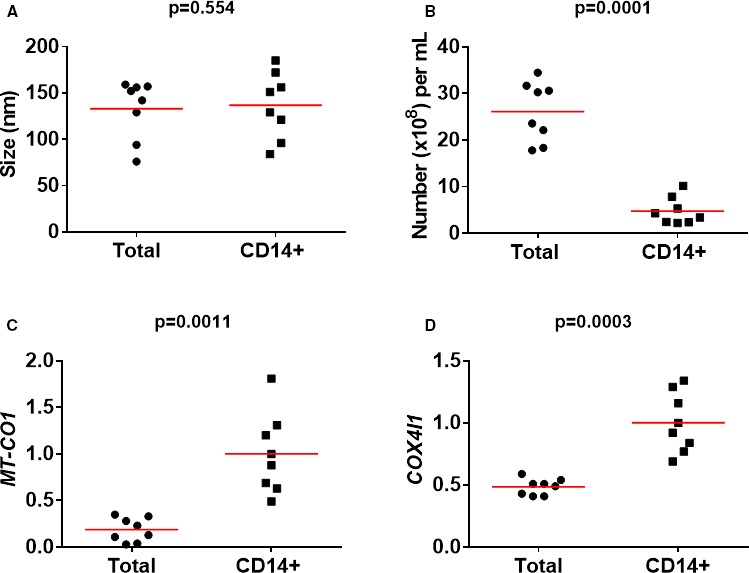
Comparison of total and CD14+ microvesicles. Scatter plots show peak sizes (and means in red) (A), number of microvesicles (B), and expressions of MT‐COI (C) and COX4I1 (D). mRNA levels of MT‐COI and COX4I1 are relative to the expression of the 5 validated reference genes. P values were determined with the Mann–Whitney U test. COX4I1 indicates cytochrome c oxidase subunit IV isoform 1; MT‐COI, mitochondrial cytochrome c oxidase, subunit I.
MT‐COI in Monocytes as a Predictor of New Cardiovascular Events
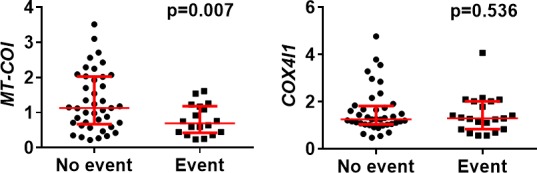
When comparing CAD patients with and without at least 1 new event, MT‐COI expression was lower (mean±SD: 0.88±0.26 vs 1.08±0.31; P=0.0060) in monocytes of patients with new events, collected at baseline. Expressions of COX10 and COX4I1 and of an important regulator of COX expression, mitochondrial transcription factor (TFAM), in CAD patients with and without new events were similar (Figure 3).
Figure 3.
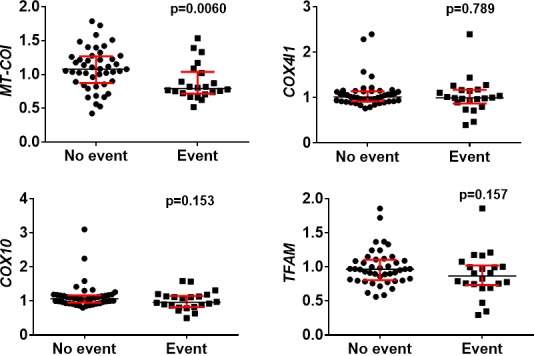
Gene expression in monocytes of CAD patients according to new cardiovascular event. Scatter plots (with median and interquartile range in red) are shown. MT‐COI, but not COX4I1, COX10, and TFAM, was lower in monocytes of CAD patients with at least 1 new cardiovascular event. mRNA levels of MT‐COI, COX4I1, COX10, and TFAM are relative to the expression of the 5 validated reference genes. P values were determined with the Mann–Whitney U test. CAD indicates coronary artery disease; COX10, cytochrome oxidase 10; COX4I1, cytochrome c oxidase subunit IV isoform 1; MT‐COI, mitochondrial cytochrome c oxidase, subunit I; TFAM, mitochondrial transcription factor.
Then, CAD patients were divided into tertiles based on MT‐COI in monocytes (T1>1.173 vs T2=1.17 to 0.96 vs T3<0.96, respectively). In a Kaplan–Meier analysis, CAD patients in the lowest tertile of MT‐COI in monocytes developed a new event earlier (log rank, P=0.002) than those in the middle tertile (hazard ratio [HR], 3.02; 95% CI, 1.10–8.33) and those in the highest tertile of MT‐COI (HR, 3.47; 95% CI, 1.49–8.06; Figure 4A). HR for new cardiovascular events, determined by multivariable Cox proportional hazard regression analysis, in CAD patients in the lowest tertile of MT‐COI and adjusted for age, sex, (ex)smoking, BMI, BP, diabetes mellitus, LDL‐ and HDL‐C, TG, hs‐CRP, and IL‐6, and number of diseased vessels was 3.95 (95% CI, 1.63–9.57; Table 3). MT‐COI (numerical) in monocytes was inversely associated with adjusted risk (HR, 5.56; 95% CI, 1.24–24).
Figure 4.
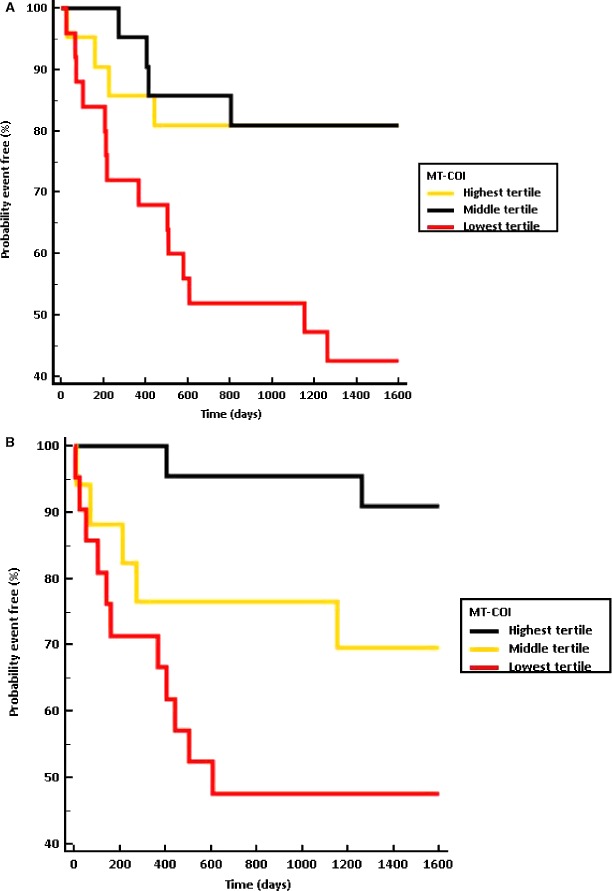
Incidence of cardiovascular events by MT‐COI group in monocytes and microvesicles. Kaplan–Meier plots according to tertiles of MT‐COI in monocytes (A) or microvesicles (B) are shown. When more than 1 event occurred in a patient, the date of the first event was considered. CAD patients in lowest tertile of MT‐COI in monocytes developed a new event earlier (log rank, P=0.002) than those in the middle tertile (HR, 3.02; 95% CI, 1.10–8.33) and those in highest tertile of MT‐COI (HR, 3.47; 95% CI, 1.49–8.06). CAD patients in the lowest tertile of MT‐COI in microvesicles also developed a new event earlier (log rank, P=0.005) than those in the middle tertile (HR, 3.87; 95% CI, 1.26–11) and those in the highest tertile of MT‐COI (HR, 8.06; 95% CI, 2.66–24). CAD indicates coronary artery disease; HR, hazard ratio; MT‐COI indicates mitochondrial cytochrome c oxidase, subunit I.
Table 3.
Summary of Cox Proportional Hazard Regression Analyses of Risk of New Cardiovascular Event in Patients in Lowest Compared to Highest Tertile of MT‐COI
| Model | HR (Mean; 95% CI) |
|---|---|
| Monocytes | |
| Model 1 | 3.47 (1.49–8.06) |
| Model 2 | 3.82 (1.63–8.96) |
| Model 3 | 3.70 (1.58–8.69) |
| Model 4 | 3.70 (1.58–8.69) |
| Model 5 | 3.95 (1.63–9.57) |
| Model 6 | 3.95 (1.63–9.57) |
| Microvesicles | |
| Model 1 | 3.85 (1.48–9.96) |
| Model 2 | 3.64 (1.40–9.44) |
| Model 3 | 3.63 (1.40–9.44) |
| Model 4 | 3.80 (1.45–9.94) |
| Model 5 | 3.64 (1.36–9.76) |
| Model 6 | 5.00 (1.77–14)a |
Model 1 is unadjusted. Model 2 is adjusted for age, sex, and (ex)smoking. Model 3 is adjusted for model 2 variables and for BMI, BP, and T2DM. Model 4 is adjusted for model 3 variables and for HDL‐ and LDL‐cholesterol, and TG. Model 5 is adjusted for model 4 variables and hs‐CRP and IL‐6. Model 6 is adjusted for model 5 variables and number of diseased vessels. BMI indicates body mass index; BP, blood pressure; CAD, coronary artery disease; COX, cytochrome oxidase; HDL, high‐density lipoprotein; hs‐CRP, high‐sensitivity C‐reactive protein; IL‐6, interleukin‐6; LDL, low‐density lipoprotein; MT‐COI, mitochondrial cytochrome c oxidase, subunit I; T2DM, type 2 diabetes mellitus; TG, triglycerides.
Number of diseased vessels was also related to higher risk (HR, 2.00; 95% CI, 1.00–3.99).
Finally, we divided CAD patients according to medical therapies. MT‐COI did not differ significantly between patients using and those not using statins (0.98±0.30 vs 1.04±0.25; P=0.16), β‐blockers (1.00±0.27 vs 1.02±0.30; P=0.76), angiotensin‐converting enzyme (ACE) inhibitors (0.97±0.33 vs 1.02±0.26; P=0.41), or angiotensin receptor blockers (1.11±0.22 vs 1.00±0.29; P=0.11). MT‐COI in monocytes was somewhat higher in CAD patients using than those not using Ca‐antagonists (1.12±0.21 vs 0.99±0.29; P=0.027).
MT‐COI in Microvesicles as a Predictor of New Cardiovascular Events
For microvesicles, mRNA levels were available in 60 CAD patients: Microvesicle concentration was too low in plasma of 4 patients and from 3 others we could not obtain reliable qPCR data according to internal quality standards. In microvesicles, MT‐COI at baseline in CAD patients with new events was also lower (0.79±0.44 vs 1.33±0.83; P=0.0005). COX4I1 was similar in microvesicles of patients with and without new events (Figure 5). Variability in COX10 and TFAM, even normalizing their expressions with expression of 5 validated housekeeping genes, was too high according to internal quality standards, most likely because absolute transcript levels of these 2 were markedly lower. We analyzed RNA in CD14+ microvesicles isolated from 8 plasma samples, which were freshly frozen and thawed or stored at −80°C for 3 months. MT‐COI was 1.53±1.10 before and 1.56±1.07 after storage (P=0.807). COX4I1 was 1.39±0.97 versus 1.41±0.80 (P=0.960).
Figure 5.
mRNA levels in microvesicles of CAD patients according to new cardiovascular event. Scatter plots (with median and interquartile range in red) are shown. MT‐COI, but not COX4I1, was lower in monocytes of CAD patients with at least 1 new cardiovascular event. mRNA levels of MT‐COI and COX4I1 are relative to the expression of the 5 validated reference genes. P values were determined with the Mann–Whitney U test. CAD indicates coronary artery disease; COX4I1, cytochrome c oxidase subunit IV isoform 1; MT‐COI, mitochondrial cytochrome c oxidase, subunit I.
Then, CAD patients were divided into tertiles based on MT‐COI in microvesicles (T1>1.26 versus T2=0.76 to 1.260 versus T3<0.76, respectively). In a Kaplan–Meier analysis, CAD patients in the lowest tertile of MT‐COI in microvesicles developed a new event earlier (log rank, P=0.005) than those in the middle tertile (HR, 3.87; 95% CI, 1.26–11) and those in the highest tertile of MT‐COI (HR, 8.06; 95% CI, 2.66–24; Figure 4B). HR for new cardiovascular events, determined by Cox proportional hazard regression analysis, in CAD patients in the lowest tertile of MT‐COI and adjusted for age, sex, (ex)smoking, BMI, BP, diabetes mellitus, LDL‐ and HDL‐C, TG, hs‐CRP, and IL‐6, and number of diseased vessels was 5.00 (95% CI, 1.77–14; Table 3). MT‐COI (numerical) in microvesicles was inversely associated with adjusted risk (HR, 2.70; 95% CI, 1.12–6.67).
Finally, we divided CAD patients according to medical therapies. MT‐COI in CD14+ microvesicles did not differ significantly between patients using and those not using statins (1.24±0.97 vs 1.43±0.97; P=0.36), β‐blockers (1.36±1.04 vs 1.26±0.84; P=0.62), ACE inhibitors (1.25±1.21 vs 1.35±0.85; P=0.67), and angiotensin receptor blockers (1.33±1.28 vs 1.32±0.90; P=0.99), or those using and those not using Ca‐antagonists (1.36±0.93 vs 1.21±0.92; P=0.53).
Correlation Between Expression in Monocytes and Microvesicles
There was only a weak direct correlation between MT‐COI in microvesicles and monocytes (R=0.24; P<0.05). But, 9 of 12 patients who were in the lowest MT‐COI tertile in monocytes and developed a new event were also in the lowest tertile of MT‐COI in microvesicles; in addition, 2 of 3 patients who were in the middle tertile of MT‐COI in monocytes were in the lowest tertile of MT‐COI in microvesicles. Multivariable logistic regression analysis showed that the lowest tertile of MT‐COI in microvesicles (primary predictor; adjusted OR, 5.51; 95% CI, 1.47–20) and the lowest tertile of MT‐COI in monocytes (secondary predictor; adjusted OR, 4.23; 95% CI, 1.15–15) both were associated with new cardiovascular events when included together in the regression model.
MT‐COI Is Low in Monocytes of ACS Patients
Given that MT‐COI in monocytes was associated with new cardiovascular events, we also investigated the expression of MT‐COI in monocytes of 21 AMI patients (8 NSTEMI, 13 STEMI). Figure 6 shows that MT‐COI and TFAM, but not COX4I1 and COX10, were lower in monocytes of AMI patients at the time of admission, but only compared to patients with stable CAD who did not develop a new event.
Figure 6.
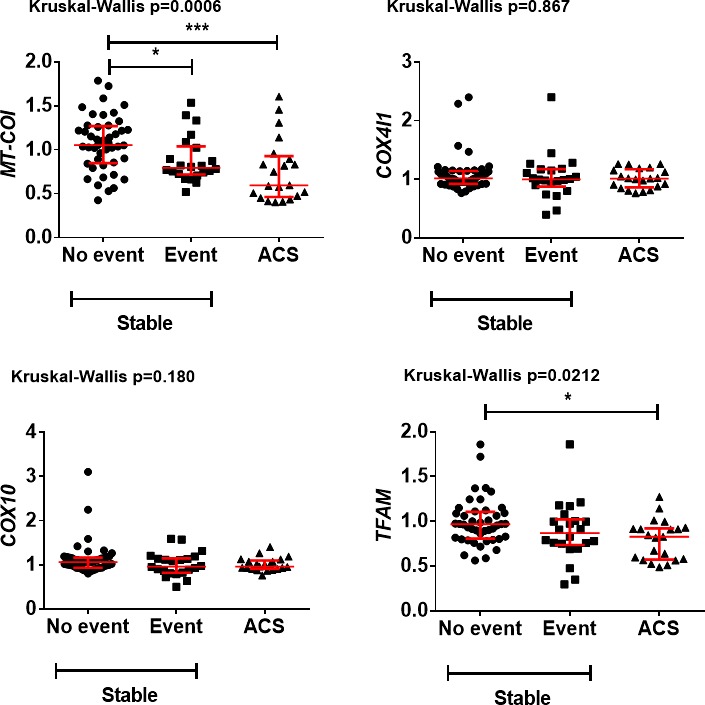
Comparison of gene expression in monocytes from patients with AMI with that in patients with CAD who did or did not develop a new cardiovascular event who were stable at the time of blood sampling. Scatter plots (with median and interquartile range in red) are shown. MT‐COI and TFAM, but not COX4I1 and COX10, were lower in monocytes of AMI patients, but only compared to those with CAD who did not develop a new event. mRNA levels of MT‐COI, COX4I1, COX10, and TFAM are relative to the expressions of the 5 validated reference genes. P values were determined with the Kruskal–Wallis test followed by Dunn's multiple comparisons test. AMI indicates acute myocardial infarction; ACS, acute coronary syndrome; CAD, coronary artery disease; COX10, cytochrome oxidase 10; COX4I1, cytochrome c oxidase subunit IV isoform 1; MT‐COI, mitochondrial cytochrome c oxidase, subunit I; TFAM, mitochondrial transcription factor.
At 3 days postadmission, MT‐COI increased from 0.587±0.364 at admission to 1.052±0.138 (P=0.00021). Similarly, TFAM increased from 0.640±0.060 to 0.749±0.158 (P=0.032). COX4I1 (0.971±0.131 vs 1.043±0.158) and COX10 (1.062±0.181 vs 1.048±0.184) remained unchanged, however. Thus, in contrast to controls showing longitudinally stable expression of MT‐COI, AMI patients show a transient decrease of MT‐COI at time of the acute event.
Discussion
This is the first prospective report showing that low MT‐COI in monocytes of CAD patients identifies a population at risk for new cardiovascular events, adjusting for other cardiovascular risk factors and extent of angiographically determined coronary atherosclerosis. Low MT‐COI in human monocytes was associated with a greater propensity of CAD patients to develop new cardiovascular events after adjustment for age, sex, (ex)smoking, BMI, BP, diabetes mellitus, LDL‐ and HDL‐C, TG, hs‐CRP, and IL‐6, suggesting a residual inflammatory risk in CAD patients despite excellent secondary prevention including treatment with statins and BP‐lowering drugs. In an exploratory post‐hoc analysis, there appeared to be a gradient from low to high MT‐COI expression in monocytes: the expression was the lowest in the acute phase of an ACS on admission, but not 3 days later, low in CAD patients with new events, and the highest in patients without a new event. The novel finding that similar expression patterns can be recapitulated from monocyte‐derived exosomes opens opportunities for more large‐scale clinical studies using available plasma biobanks. Interestingly, nuclear encoded COX4I1 and COX10 in monocytes, which earlier were found to be associated with metabolic diseases, were not related to new events after adjustment for former diseases. We recovered over 90% of CD14 in total microvesicles in the fraction isolated with anti‐CD14‐coated beads. MT‐COI was found to be higher in CD14+ microvesicles than in total microvesicles, relative to housekeeping genes, and was comparable to expressions in monocytes.
Functionally, complex IV enzyme activity depends on expression of genes involved in mitochondrial biogenesis and induction of the COX IV complex is part of the adaptive antioxidant stress response of monocytic cells to hypoxic condition.28 Therefore, it has been hypothesized that impairment of mitochondrial function, for instance, may link reduced fitness to a higher incidence of cardiovascular diseases.29 However, no previous studies identified specific molecules in the complex IV. Our study is thus the first one showing an association between low MT‐COI and the risk of new cardiovascular events independent of established cardiovascular risk factors and extent of CAD.
The finding that MT‐COI is related with incident CAD is novel in view of sparse observations of gene changes in monocytes according to disease state or disease risk adjusting for other risk factors. A previous study comparing 18 patients with severe triple‐vessel CAD and 13 control patients without angiographic signs of CAD concluded that large interindividual variability prevented the use of a single gene as biomarker, whereas a monocyte gene expression signature consisting of 7 genes predicted patient status with an accuracy of 84%.30 In agreement with a previous study, we did not find an association of gene expressions in monocytes with coronary artery stenosis after adjustment for other risk factors. But we did observe an association with new cardiovascular events in CAD patients. In addition, we observed a significant within‐individual longitudinal stability of gene expressions together with a rather small interindividual variability in COX gene expression. This may be attributed to the use in our study of a recent method determining PCR efficiency correction, multiple reference gene normalization, inter‐run calibration, and error propagation for quality control.24 Indeed, replicate variability was within the set limit of 0.5 cycles for 98.2% of sample‐target combinations in monocytes and for 94.27% of sample‐target combinations in microvesicles.
Because microvesicles, and especially exosomes, are considered to be novel sources for plasma‐derived biomarkers,19 a most important observation is that expression profiles of monocytes are recapitulated in monocyte‐derived exosomes. Reports of the association between content of microvesicles and cardiovascular diseases are indeed very sparse. Microvesicles derived from activated endothelial and inflammatory cells, such as monocytes, and especially those expressing cell adhesion and procoagulant molecules, reflected early vascular dysfunction.31 Other studies showed that cardiovascular risk factors may change the content of circulating plasma microvesicles.32 A circulating microvesicle protein network involved in inflammatory response was found to be associated with STEMI.33 More than simply cell dust, extracellular vesicles are thus capable of transferring biological information to neighboring cells and play an active role in inflammatory diseases, including atherosclerosis and angiogenesis.20, 34
A limitation of our study is that the number of patients was rather small, requiring independent prospective validation. We also did not obtain serial samples, so we do not yet know whether subsequent measurements likewise predict risk. Presence of CAD was assessed using conventional QCA; although logistically challenging on a larger scale, our results should ideally be replicated using intracoronary imaging techniques that also take plaque morphology into account. In addition, the evolution of MT‐COI expression in microvesicles during and after an ACS deserves further study. Finally, measuring MT‐COI directly in the plasma, without selecting total exosomes or CD14+ exosomes, would be faster. However, this might reduce sensitivity and specificity, given that we have already experienced with MT‐COI measurements in peripheral blood mononuclear cells compared to CD14+ monocytes. We already noticed a lower expression of MT‐COI in total exosomes than in CD14+ exosomes, normalizing for validated housekeeping genes.
It is, as yet, not possible to conclude whether MT‐COI is a marker or a causally related pathogenic mediator in the development of cardiovascular diseases. However, this is the first prospective study showing the relation of low MT‐COI with risk of new events, and we demonstrated the possibility to translate findings in monocytes to microvesicles.
Conclusions
We found that expression of MT‐COI in monocytes and microvesicles is downregulated in CAD patients with increased risk of new events. Measuring MT‐COI expression may offer a promising tool for better risk stratification and patient monitoring. The finding that the signature of MT‐COI in monocytes can be recapitulated in monocyte‐specific microvesicles in plasma with a similar predictive power suggests that plasma biobanks can be used for further assessments of its predictive power.
Sources of Funding
This work was funded by the Bijzonder Onderzoeksfonds of the KU Leuven (PF/10/014; Centre of Excellence), by the Interdisciplinair Ontwikkelingsfonds‐Kennisplatform (Centre of Excellence KP/12/009), and by the Fonds voor Wetenschappelijk Onderzoek‐Vlaanderen (G0846.11, and Vascular Biology Network). Sinnaeve is a clinical researcher of the Fonds voor Wetenschappelijk Onderzoek‐Vlaanderen. Funding organizations had no role in design, in the collection, analysis, and interpretation of data; in the writing of the manuscript; and in the decision to submit the manuscript for publication.
Author Contributions
Holvoet had full access to all of the data in the study and takes responsibility for the integrity of the data and the accuracy of the data analysis. Study concept and design: Holvoet, Sinnaeve, and Janssens. Acquisition of data: Holvoet, Vanhaverbeke, Bloch, and Baatsen. Analysis and interpretation of data: Holvoet, Sinnaeve, Vanhaverbeke, and Janssens. Drafting the manuscript: Holvoet, Vanhaverbeke, Sinnaeve, and Janssens. Obtained funding: Holvoet and Janssens. Study supervision: Holvoet and Janssens.
Disclosures
None.
Acknowledgments
We thank Roxane Menten for her excellent technical support.
(J Am Heart Assoc. 2016;5:e004207 doi:10.1161/JAHA.116.004207)
References
- 1. Ridker PM, MacFadyen J, Libby P, Glynn RJ. Relation of baseline high‐sensitivity C‐reactive protein level to cardiovascular outcomes with rosuvastatin in the Justification for Use of statins in Prevention: an Intervention Trial Evaluating Rosuvastatin (JUPITER). Am J Cardiol. 2010;106:204–209. [DOI] [PubMed] [Google Scholar]
- 2. Ghattas A, Griffiths HR, Devitt A, Lip GY, Shantsila E. Monocytes in coronary artery disease and atherosclerosis: where are we now? J Am Coll Cardiol. 2013;62:1541–1551. [DOI] [PubMed] [Google Scholar]
- 3. van der Laan AM, Ter Horst EN, Delewi R, Begieneman MP, Krijnen PA, Hirsch A, Lavaei M, Nahrendorf M, Horrevoets AJ, Niessen HW, Piek JJ. Monocyte subset accumulation in the human heart following acute myocardial infarction and the role of the spleen as monocyte reservoir. Eur Heart J. 2014;35:376–385. [DOI] [PMC free article] [PubMed] [Google Scholar]
- 4. Wallace DC. A mitochondrial paradigm of metabolic and degenerative diseases, aging, and cancer: a dawn for evolutionary medicine. Annu Rev Genet. 2005;39:359–407. [DOI] [PMC free article] [PubMed] [Google Scholar]
- 5. Poyton RO, McEwen JE. Crosstalk between nuclear and mitochondrial genomes. Annu Rev Biochem. 1996;65:563–607. [DOI] [PubMed] [Google Scholar]
- 6. Villani G, Attardi G. In vivo control of respiration by cytochrome c oxidase in wild‐type and mitochondrial DNA mutation‐carrying human cells. Proc Natl Acad Sci USA. 1997;94:1166–1171. [DOI] [PMC free article] [PubMed] [Google Scholar]
- 7. Holvoet P, Lee DH, Steffes M, Gross M, Jacobs DR Jr. Association between circulating oxidized low‐density lipoprotein and incidence of the metabolic syndrome. JAMA. 2008;299:2287–2293. [DOI] [PMC free article] [PubMed] [Google Scholar]
- 8. Park K, Gross M, Lee DH, Holvoet P, Himes JH, Shikany JM, Jacobs DR Jr. Oxidative stress and insulin resistance: the coronary artery risk development in young adults study. Diabetes Care. 2009;32:1302–1307. [DOI] [PMC free article] [PubMed] [Google Scholar]
- 9. Capaldi RA. Structure and assembly of cytochrome c oxidase. Arch Biochem Biophys. 1990;280:252–262. [DOI] [PubMed] [Google Scholar]
- 10. Acin‐Perez R, Bayona‐Bafaluy MP, Bueno M, Machicado C, Fernandez‐Silva P, Perez‐Martos A, Montoya J, Lopez‐Perez MJ, Sancho J, Enriquez JA. An intragenic suppressor in the cytochrome c oxidase I gene of mouse mitochondrial DNA. Hum Mol Genet. 2003;12:329–339. [DOI] [PubMed] [Google Scholar]
- 11. Fukuda R, Zhang H, Kim JW, Shimoda L, Dang CV, Semenza GL. HIF‐1 regulates cytochrome oxidase subunits to optimize efficiency of respiration in hypoxic cells. Cell. 2007;129:111–122. [DOI] [PubMed] [Google Scholar]
- 12. Arnold S. Cytochrome c oxidase and its role in neurodegeneration and neuroprotection. Adv Exp Med Biol. 2012;748:305–339. [DOI] [PubMed] [Google Scholar]
- 13. Arnold S. The power of life–cytochrome c oxidase takes center stage in metabolic control, cell signalling and survival. Mitochondrion. 2012;12:46–56. [DOI] [PubMed] [Google Scholar]
- 14. Diaz F, Thomas CK, Garcia S, Hernandez D, Moraes CT. Mice lacking COX10 in skeletal muscle recapitulate the phenotype of progressive mitochondrial myopathies associated with cytochrome c oxidase deficiency. Hum Mol Genet. 2005;14:2737–2748. [DOI] [PMC free article] [PubMed] [Google Scholar]
- 15. Van der Schueren B, Vangoitsenhoven R, Geeraert B, De Keyzer D, Hulsmans M, Lannoo M, Huber HJ, Mathieu C, Holvoet P. Low cytochrome oxidase 4I1 links mitochondrial dysfunction to obesity and type 2 diabetes in humans and mice. Int J Obes (Lond). 2015;39:1254–1263. [DOI] [PubMed] [Google Scholar]
- 16. Baron M, Boulanger CM, Staels B, Tailleux A. Cell‐derived microparticles in atherosclerosis: biomarkers and targets for pharmacological modulation? J Cell Mol Med. 2012;16:1365–1376. [DOI] [PMC free article] [PubMed] [Google Scholar]
- 17. Hulsmans M, Holvoet P. MicroRNA‐containing microvesicles regulating inflammation in association with atherosclerotic disease. Cardiovasc Res. 2013;100:7–18. [DOI] [PubMed] [Google Scholar]
- 18. Huber HJ, Holvoet P. Exosomes: emerging roles in communication between blood cells and vascular tissues during atherosclerosis. Curr Opin Lipidol. 2015;26:412–419. [DOI] [PMC free article] [PubMed] [Google Scholar]
- 19. Hoefer IE, Steffens S, Ala‐Korpela M, Back M, Badimon L, Bochaton‐Piallat ML, Boulanger CM, Caligiuri G, Dimmeler S, Egido J, Evans PC, Guzik T, Kwak BR, Landmesser U, Mayr M, Monaco C, Pasterkamp G, Tunon J, Weber C. Novel methodologies for biomarker discovery in atherosclerosis. Eur Heart J. 2015;36:2635–2642. [DOI] [PubMed] [Google Scholar]
- 20. Loyer X, Vion AC, Tedgui A, Boulanger CM. Microvesicles as cell‐cell messengers in cardiovascular diseases. Circ Res. 2014;114:345–353. [DOI] [PubMed] [Google Scholar]
- 21. Pickl WF, Majdic O, Kohl P, Stockl J, Riedl E, Scheinecker C, Bello‐Fernandez C, Knapp W. Molecular and functional characteristics of dendritic cells generated from highly purified CD14+ peripheral blood monocytes. J Immunol. 1996;157:3850–3859. [PubMed] [Google Scholar]
- 22. Boing AN, van der Pol E, Grootemaat AE, Coumans FA, Sturk A, Nieuwland R. Single‐step isolation of extracellular vesicles by size‐exclusion chromatography. J Extracell Vesicles. 2014;3:23430. doi: 10.3402/jev.v3.23430. eCollection 2014. [DOI] [PMC free article] [PubMed] [Google Scholar]
- 23. Cerkovnik P, Perhavec A, Zgajnar J, Novakovic S. Optimization of an RNA isolation procedure from plasma samples. Int J Mol Med. 2007;20:293–300. [PubMed] [Google Scholar]
- 24. Hellemans J, Mortier G, De Paepe A, Speleman F, Vandesompele J. qBase relative quantification framework and software for management and automated analysis of real‐time quantitative PCR data. Genome Biol. 2007;8:R19. [DOI] [PMC free article] [PubMed] [Google Scholar]
- 25. Hulsmans M, Geeraert B, De Keyzer D, Mertens A, Lannoo M, Vanaudenaerde B, Hoylaerts M, Benhabiles N, Tsatsanis C, Mathieu C, Holvoet P. Interleukin‐1 receptor‐associated kinase‐3 is a key inhibitor of inflammation in obesity and metabolic syndrome. PLoS One. 2012;7:e30414. [DOI] [PMC free article] [PubMed] [Google Scholar]
- 26. Akers JC, Gonda D, Kim R, Carter BS, Chen CC. Biogenesis of extracellular vesicles (EV): exosomes, microvesicles, retrovirus‐like vesicles, and apoptotic bodies. J Neurooncol. 2013;113:1–11. [DOI] [PMC free article] [PubMed] [Google Scholar]
- 27. Camussi G, Deregibus MC, Bruno S, Grange C, Fonsato V, Tetta C. Exosome/microvesicle‐mediated epigenetic reprogramming of cells. Am J Cancer Res. 2011;1:98–110. [PMC free article] [PubMed] [Google Scholar]
- 28. Goto M, Miwa H, Suganuma K, Tsunekawa‐Imai N, Shikami M, Mizutani M, Mizuno S, Hanamura I, Nitta M. Adaptation of leukemia cells to hypoxic condition through switching the energy metabolism or avoiding the oxidative stress. BMC Cancer. 2014;14:76. [DOI] [PMC free article] [PubMed] [Google Scholar]
- 29. Wisloff U, Najjar SM, Ellingsen O, Haram PM, Swoap S, Al‐Share Q, Fernstrom M, Rezaei K, Lee SJ, Koch LG, Britton SL. Cardiovascular risk factors emerge after artificial selection for low aerobic capacity. Science. 2005;307:418–420. [DOI] [PubMed] [Google Scholar]
- 30. Schirmer SH, Fledderus JO, van der Laan AM, van der Pouw‐Kraan TC, Moerland PD, Volger OL, Baggen JM, Bohm M, Piek JJ, Horrevoets AJ, van Royen N. Suppression of inflammatory signaling in monocytes from patients with coronary artery disease. J Mol Cell Cardiol. 2009;46:177–185. [DOI] [PubMed] [Google Scholar]
- 31. Miller VM, Lahr BD, Bailey KR, Hodis HN, Mulvagh SL, Jayachandran M. Specific cell‐derived microvesicles: linking endothelial function to carotid artery intima‐media thickness in low cardiovascular risk menopausal women. Atherosclerosis. 2016;246:21–28. [DOI] [PMC free article] [PubMed] [Google Scholar]
- 32. Badrnya S, Baumgartner R, Assinger A. Smoking alters circulating plasma microvesicle pattern and microRNA signatures. Thromb Haemost. 2014;112:128–136. [DOI] [PubMed] [Google Scholar]
- 33. Velez P, Parguina AF, Ocaranza‐Sanchez R, Grigorian‐Shamagian L, Rosa I, Alonso‐Orgaz S, de la Cuesta F, Guitian E, Moreu J, Barderas MG, Gonzalez‐Juanatey JR, Garcia A. Identification of a circulating microvesicle protein network involved in ST‐elevation myocardial infarction. Thromb Haemost. 2014;112:716–726. [DOI] [PubMed] [Google Scholar]
- 34. Li J, Zhang Y, Liu Y, Dai X, Li W, Cai X, Yin Y, Wang Q, Xue Y, Wang C, Li D, Hou D, Jiang X, Zhang J, Zen K, Chen X, Zhang CY. Microvesicle‐mediated transfer of microRNA‐150 from monocytes to endothelial cells promotes angiogenesis. J Biol Chem. 2013;288:23586–23596. [DOI] [PMC free article] [PubMed] [Google Scholar]