Abstract
The database JET2 Viewer, openly accessible at http://www.jet2viewer.upmc.fr/, reports putative protein binding sites for all three-dimensional (3D) structures available in the Protein Data Bank (PDB). This knowledge base was generated by applying the computational method JET2 at large-scale on more than 20 000 chains. JET2 strategy yields very precise predictions of interacting surfaces and unravels their evolutionary process and complexity. JET2 Viewer provides an online intelligent display, including interactive 3D visualization of the binding sites mapped onto PDB structures and suitable files recording JET2 analyses. Predictions were evaluated on more than 15 000 experimentally characterized protein interfaces. This is, to our knowledge, the largest evaluation of a protein binding site prediction method. The overall performance of JET2 on all interfaces are: Sen = 52.52, PPV = 51.24, Spe = 80.05, Acc = 75.89. The data can be used to foster new strategies for protein–protein interactions modulation and interaction surface redesign.
INTRODUCTION
Proteins regulate biological processes through a complex network of dynamical interactions. Protein–protein interactions (PPIs) are considered as increasingly important therapeutic targets (1–3) and their accurate prediction becomes particularly relevant. Over the past 25 years, a number of computational methods have been developed for predicting protein interfaces (4–15). Some of them are very popular and reach very high accuracy. Nevertheless, they rarely address the complexity associated to protein sites of multiple origins and/or binding to multiple partners. Many questions regarding PPIs cannot be answered by just knowing that two proteins might be partners, or by knowing the approximate location of the interaction site but demand a precise description of the geometrical organization of the interacting residues. Some interaction sites might be shared by partners at different times, and some other sites might be large enough to be used by several proteins at once. Predicting these differences is of crucial importance to understand the PPI network and to design artificial interactions.
JET2 Viewer is a web server that provides binding site predictions for the full set of structures collected in the Protein Data Bank (PDB). The predictions were produced by JET2, a new tool (16) that addresses the problem of identifying multiple interaction sites. The predictive model for protein interfaces implemented in JET2 is inspired by a thorough analysis of known protein complexes which revealed a geometrical pattern observed for many binding sites (17). Namely, experimental sites can be described as comprising three concentric layers: a layer of residues mostly buried and occupying the central zone of the interface (support), a layer of surface residues that become buried upon association with the partner (core) and a layer of residues remaining partially exposed to the solvent in the complex (rim). We exploited the Support-Core-Rim (SCR) analysis and developed strategies to predict each layer. JET2 uses three sequence- and structure-based descriptors of protein residues: evolutionary conservation, physico–chemical properties and local geometry. A rational combination of these descriptors yields very precise predictions for a wide range of protein–protein interfaces and discriminates them from small-molecule binding sites. The method led us to go beyond the three-layer description and to highlight that interaction sites previously difficult to detect (8) are actually formed by either one or two layers (16). We could also identify interfaces shared by several partners, decrypt surfaces with several binding sites and decipher the evolutionary constraints that apply to different types of recognition patches.
JET2 Viewer is freely available to the community. It gives access to JET2 results in a variety of ways, including interactive visualization of the binding sites mapped on PDB structures.
JET2 PREDICTIVE STRATEGY
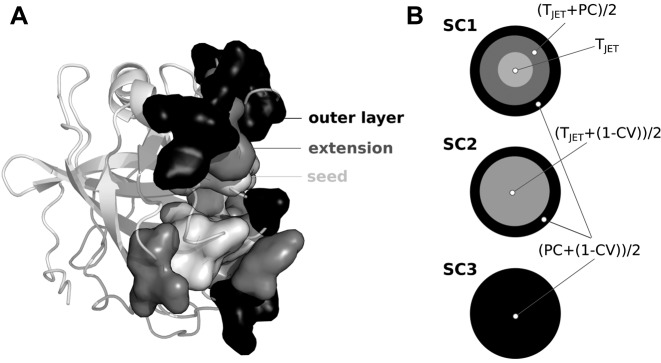
The varied nature of protein interfaces emphasizes the need for adapted modeling approaches to correctly predict them. Following the SCR model (17), JET2 implements specific clustering strategies, aiming at detecting support, core and rim residues in a wide range of interfaces (Figure 1A). It proposes three scoring schemes (SC) that combine evolutionary conservation from the sequence (TJET), amino-acid interface propensities (PC) and local geometry of the structure (circular variance, CV) as follows (Figure 1B):
SC1 uses the three descriptors for defining the three components of the binding sites. Very conserved residues (TJET only) are detected and grouped to form a core cluster which is then extended using TJET and PC. An outer layer is added considering PC and CV. SC1 is intended to detect diverse protein binding sites.
SC2 combines TJET and CV for the core cluster detection and extension. This ensures that strong evolutionary signals are captured while avoiding residues too buried inside the protein. The outer layer is defined based on PC and CV, as in SC1. SC2 specifically distinguishes protein interfaces from small-ligand binding sites.
SC3 disregards evolutionary information and detects all three components by combining PC and CV. The development of SC3 was motivated by the observation that some protein interfaces, e.g. antigen-binding sites, display very low conservation signal. SC3 is expected to yield consistent predictions for difficult cases.
Figure 1.
Predicted interface structure and JET2 scoring schemes. (A) Section of the JET2 prediction of an interface (1N8O). Predicted interface residues are displayed in opaque surface: cluster seed, extension and outer layer are in light gray, gray and dark gray. (B) Schematic icons picturing JET2 scoring schemes. TJET: conservation level, PC: interface propensity, CV: circular variance. Different gray levels correspond to different formulas.
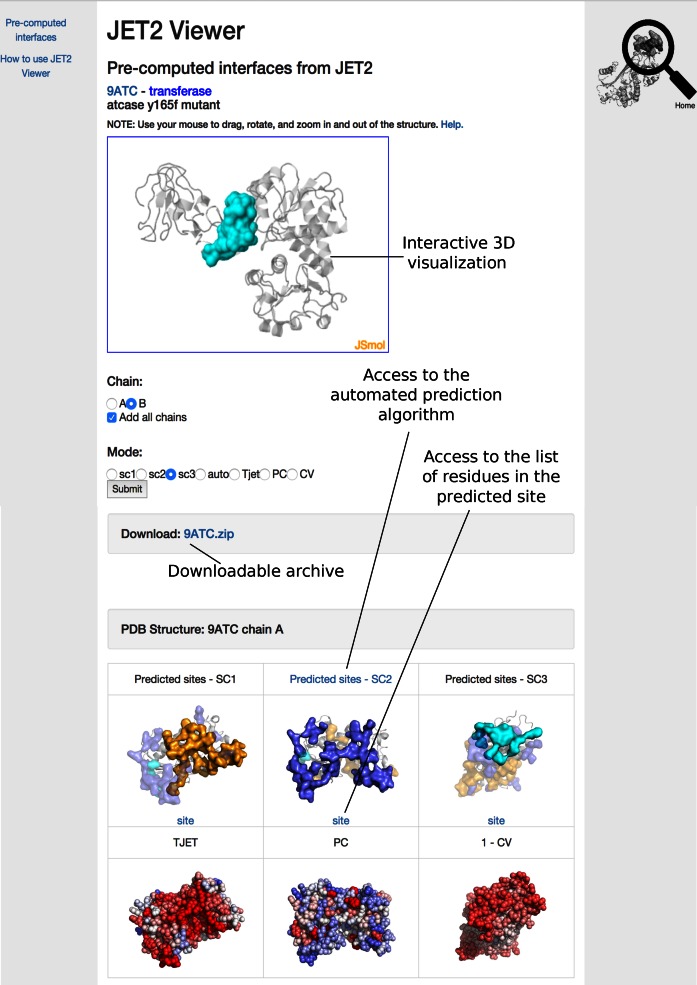
Precise definitions of TJET, PC and CV are given in (16). The method to compute the evolutionary trace TJET and the propensity PC was first described in (8). Depending on the chosen SC, the predicted site may be highly conserved, display peculiar physico–chemical and/or geometrical properties. The same protein structure might display regions on its surface that are prone to different types of interactions and the different SCs are aimed to reveal the corresponding potential sites. JET2 Viewer reports the three types of predictions (Figure 2), along with the results of JET2 fully automated clustering algorithm. This algorithm detects interacting residues with the SC supporting the strongest interaction signal (depending on the system studied) and enriches the predictions with extra signal of interaction by using a complementary SC (16).
Figure 2.
Example of online JET2 Viewer display. On top, the 3D interactive JSmol plugin shows the site predicted by SC3 for chain B of the PDB entry 9ATC. The two chains, A and B, are displayed as transparent gray cartoons. At the bottom, the sites predicted for chain A with scoring schemes SC1 (orange), SC2 (purple) and SC3 (cyan) are displayed. Each interface is oriented toward the user, and plotted (solid surface) with the other two (transparent). TJET, PC and 1-CV values are also shown for each residue of the protein. Different colors, ranging from red (high) to blue (low), are used to highlight the level of the property for the residue.
JET2 VIEWER DATA AND FUNCTIONALITIES
JET2 Viewer reports pre-computed interface predictions obtained by running the iterative version of JET2 (iJET2, 10 iterations) on the non-redundant set (at 40% identity) of all chains for which a high-quality three-dimensional (3D) structure is available in the PDB. The user can give as input a valid PDB identifier or he/she can browse the list of all treated PDBs. If the PDB code provided by the user is not part of the set of explicitly treated PDB files, the user will be guided to access the JET2 results computed for chains homologous to the chains of the query structure. JET2 results can be interactively visualized in 3D through the JavaScript version of Jmol (18), JSmol (Figure 2). The user can choose to display all chains in the PDB to see if the predicted sites lie at the interface between chains. Two dimensional (2D) images also show front views of the sites predicted by SC1, SC2, SC3 and the automated algorithm, and the values of the three residue-based descriptors, TJET, PC and CV (Figure 2). The user can access a table with the list of residues comprised in each site by clicking on the link ‘site’ below each 2D image. The table contains the values of TJET, PC, CV and the confidence in the prediction (number of occurrences over 10 independent runs of JET2) for each residue. Finally, an archive is provided with all JET2 results, the PNG files displayed on the web page and PML files to enable the user to locally visualize the results by running PyMOL (19).
JET2 VIEWER STATISTICS
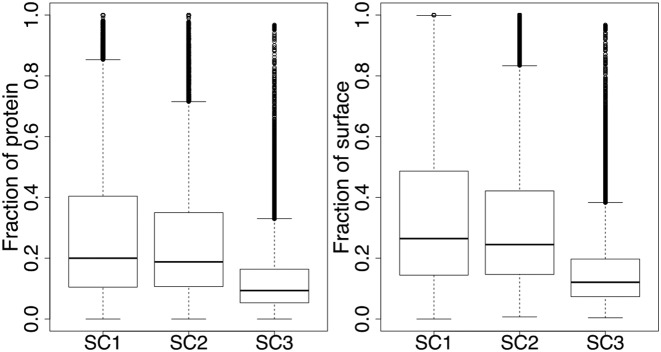
JET2 was applied to 21 840 chains. The automated clustering algorithm chose SC1 in 68%, SC2 in 22% and SC3 in 10% of the cases. All three scoring schemes were applied separately to each entry to provide the user all the patches detectable by JET2 (Figure 2). SC1, SC2 and SC3 produced some predictions for 78, 81 and 81% of the chains, respectively. On average, 33, 31 and 16% of the protein surface residues are predicted as interacting by the three different SC (Figure 3).
Figure 3.
Size of JET2 predictions. Proportions of protein residues (on the left) and surface residues (on the right) predicted as interacting by JET2 scoring schemes. Surface residues have more than 5% accessible surface area.
The patches predicted by using SC1 and SC2 are often largely overlapping, with more than 60% of their residues in common in 79% of the cases. About half of the patches obtained by using SC3, namely 56 and 50%, are almost completely included (at least 70% of their residues) in the patches obtained by using SC1 and SC2, respectively. By contrast, in 24% (resp. 28%) of the cases, the patches obtained by using SC1 (resp. SC2) and SC3 are almost completely disjoint (<30% of residues in common).
Performances assessed at large scale
All the biological interfaces known for the 21 840 chains treated by JET2 were retrieved using the EPPIC web server (20). The EPPIC method relies on evolutionary data and a geometric criterion to distinguish biologically relevant interfaces from lattice contacts in protein crystals. At least one known biological binding site was found in the PDB for about half of the chains (Table 1). The identified sites can be highly redundant because of the presence of multiple copies of the same chain(s) in the crystal asymmetric unit. To cope with this issue in the evaluation, binding sites sharing more than 80% of their residues were merged.
Table 1. Statistics on the known biologically relevant interfaces.
| # chains | total | # predicted | # missed | |
|---|---|---|---|---|
| with sites | # sites | sites | sites | |
| Query PDBs | 11 072 | 13 948 | 12 092 (87%) | 1856 (13%) |
| All PDBs | 12 008 | 18 541 | 15 071 (81%) | 3470 (19%) |
The numbers of chains for which at least one biological binding site was found in the query PDB file on which JET2 was run or in the whole PDB are reported, along with the total numbers of sites, the numbers of sites predicted by JET2 (with Sens ≥15%) and of those missed by JET2 (Sens <15%).
From the query PDB files on which JET2 was run, 13 948 sites were retrieved and 87% of them were correctly predicted by JET2 (sensitivity > 15%, Table 1). About 5 000 additional sites could be identified by considering the whole PDB, leading to 18 541 sites in total. The proportion of correctly detected sites drops down to 81% on the whole set (Table 1), which may be explained by conformational changes occurring in the PDB entries on which JET2 was not run.
JET2 performance was computed on the 15 071 predicted sites (Table 2). On average, JET2 covered 53% of their interacting residues with a precision of 51%. The performance varies with the size of the protein. Small proteins (<100 residues) display high sensitivity (>75%) and rather low specificity (<50%), indicating that a very large portion of the surface of these proteins is involved in interactions and is correctly detected by JET2. The sensitivity decreases with the increasing size of the protein. The highest accuracies are obtained for proteins of medium size (200–500 residues).
Table 2. JET2 performance on more than 15 000 interacting sites.
| # chains | Sen | PPV | Spe | Acc | |
|---|---|---|---|---|---|
| All | 10 900 | 52.52 | 51.24 | 80.05 | 75.89 |
| x < 100 | 1 548 | 75.73 | 52.83 | 47.48 | 60.23 |
| 100 ≤ x < 200 | 3 747 | 57.44 | 48.02 | 77.21 | 71.63 |
| 200 ≤ x < 300 | 2 630 | 45.95 | 49.73 | 89.81 | 81.76 |
| 300 ≤ x < 500 | 2 413 | 39.57 | 55.24 | 94.24 | 86.24 |
| x ≥ 500 | 562 | 42.44 | 59.79 | 79.69 | 74.34 |
Statistical performance values averaged over 15 071 predicted interacting sites are given in percentages. iJET2 predictions were obtained from a consensus of 2 runs out of 10. For all interacting sites, the three scoring schemes were systematically used and the best patch or combination of patches was retained. x represents the size (number of residues) of the protein considered.
EXAMPLES OF PREDICTIONS IN JET2 VIEWER
We illustrate the usefulness and accuracy of JET2 Viewer data by a few examples.
Multiple partners for a single site
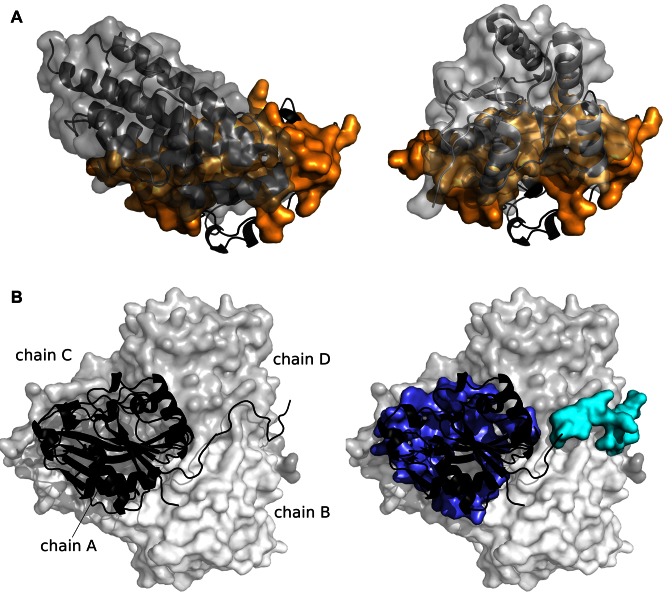
The patch detected by SC1 in the phosphorelay intermediate protein YPD1 (PDB code: 2R25, chain A) matches the homodimeric interface of the protein at 90% sensitivity and 51% precision (Figure 4A, on the left). It also matches the interface with the osmosensing histidine protein kinase SLN1 with sensitivity of 93% and precision of 49% (Figure 4A, on the right).
Figure 4.
Examples of JET2 predictions. (A) Usage of a site by multiple partners. The phosphorelay intermediate protein YPD1 (2R25, chain A) is shown in black cartoon. The patch predicted by SC1, displayed as an orange opaque surface, is used by two partners of the protein represented as gray cartoons and transparent surfaces: on the left, itself (1C03) ; on the right, the histidine protein kinase SLN1 (2R25). (B) Multiple recognition patches in a single site. The thuA-like protein (1T0B) forms a homotetramer. One monomer (chain A) is shown as a black cartoon and the other chains as transparent surfaces in different gray tones. The patches predicted by SC2 and SC3 are displayed as opaque surfaces in purple and in cyan.
Multiple patches
The thuA-like protein (PDB code: 1T0B) forms a homotetramer. The patches predicted by JET2 on chain A using SC2 and SC3 detected 77% and 84% of the residues at the corresponding interfaces with precision of 63 and 40% (Figure 4B).
Large assemblies
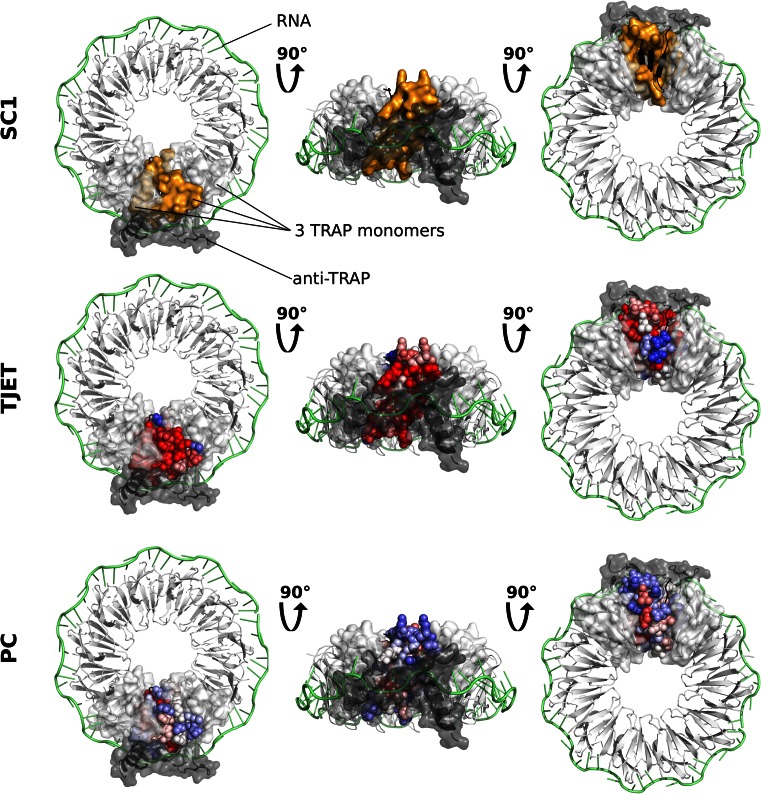
The TRP RNA-binding attenuation protein (TRAP) forms a ring-shaped 11-mer that binds to RNA. It is regulated by the inhibitor anti-TRAP, which sterically prevents RNA binding. JET2 predicts 63% of the residues involved in TRAP interactions with a precision of 82% (Figure 5).
Figure 5.
JET2 predictions for the TRP RNA-binding attenuation protein (TRAP). Three different views (on the left, in the middle and on the right) of a homo 11-mer of TRAP in complex with a 53-base single-stranded RNA (1C9S) are shown. The RNA is colored in lime, 10 TRAP monomers are colored in white and 1 TRAP monomer is in black. The transparent surfaces of the two white monomers adjacent to the black one are displayed. A protein partner, anti-TRAP (2ZP8), is also shown as dark gray cartoon and transparent surface. The results of JET2 applied to TRAP (3ZZS) are mapped onto the structure of the black monomer: the binding site predicted by SC1 as orange surface, the values of the evolutionary trace TJET and of the interface propensities PC as blue through white to red spheres.
DETAILS ON THE INPUT DATA
The non-redundant set of all chains in the PDB was assembled with the PISCES server (http://dunbrack.fccc.edu/PISCES.php) (21) by imposing a filter of ≤40% sequence identity. Chains smaller than 40 and longer than 10 000 residues were not considered. Only PDB files of acceptable resolution (<3.5Å) and quality (R-value ≤ 0.3) were retained. Nuclear magnetic resonance (NMR) entries were included, Cα-only entries were excluded. The final set was comprised of 22 015 PDB files annotated as XRAY or NMR by PISCES. JET2 produced results for 21 840 chains (0.7% error rate). Let us stress that JET2 was run on entire PDB files. Consequently, each chain of the non-redundant set may be present more than once in the database. Furthermore, as new JET2 predictions are computed in the lab, we add them to the database. To date, results have been produced for about 70 000 non-unique chains. The user has access to all the information contained in the database.
JET2 implementation allows to handle frequent problematic issues associated to structural data deposited in the PDB. For X-ray structures, only the conformation displaying the highest occupancy is considered. For NMR entries, the calculation is performed on every conformer. Residues whose number contains an alphabetic insertion code are included. The most common non-standard amino acid residue types: selenomethionine (MSE), methyllysine (MLY), hydroxyproline (HYP), phosphoserine (SEP), phosphothreonine (TPO) and phosphotyrosine (PTR), are replaced by the corresponding standard amino acids. Amino acids of other non-standard types are ignored. Chains with no, lower-case or numeric identifiers are treated as chains with upper-case identifiers. Chemical compounds, ions and cofactors, small peptides, nucleic acid polymers and water molecules are discarded. The iterative version of JET2, iJET2, was run on 10 iterations in ‘chain’ mode, with default parameters.
DISCUSSION
JET2 Viewer is a web server providing to the community binding site predictions for all structures available in the PDB. It enables to visualize the data interactively in 3D and as intelligently oriented 2D images. The data were generated by JET2, a computational method for the prediction of protein–protein binding sites that takes as input the 3D structure of a single protein and exploits both sequence and structural information. The combination of the geometric descriptor (circular variance) with sequence descriptors (conservation and physico–chemical properties of the residues) enables to capture with remarkable precision intrinsic features of protein binding patches (16).
JET2 performance was assessed on more than 15 000 protein binding sites, whose predictions are included in JET2 Viewer. This is, to our knowledge, the first evaluation of a protein interface prediction tool performed at such a large scale. JET2 is able to retrieve a number of interfaces with high sensitivity (5 717 sites detected with Sens >60%) or high precision (5516 sites detected with PPV >60%). However, on average, there is a significant number of interacting residues that are not detected by JET2. As a possible explanation, we can hypothesize that some of these residues may be present at an interface because of specific crystallization conditions and/or crystal packing, and may not significantly contribute to the association/affinity between the protein partners. Residues wrongly predicted by JET2 as interacting may be involved in interactions that have not been yet characterized experimentally. Let us also stress that the annotation provided by EPPIC, used in the evaluation, may be wrong in some instances. For example, in the PDB entry 1MAH, the interface between chains A and F, acetylcholinesterase and fasciculin 2, which is known to be biologically relevant and for which the affinity of the two partners was measured experimentally (22), is wrongly annotated as lattice contact.
JET2 predicted patches can be used to analyze docking conformations (23). The analysis of the patches can foster new strategies for PPIs modulation and interaction surface redesign.
Acknowledgments
We thank S. Bliven for providing access to the EPPIC database.
FUNDING
MAPPING project [ANR-11-BINF-0003, Excellence Program ‘Investissement d'Avenir’ in Bioinformatics]; Institute for Scientific Computing and Simulation at UPMC [Equip@Meso project—ANR-10-EQPX- 29-01]; Institut Universitaire de France (to A.C.). Funding for open access charge: MAPPING project [ANR-11-BINF-0003, Excellence Program ‘Investissement d'Avenir’ in Bioinformatics].
Conflict of interest statement. None declared.
REFERENCES
- 1.Meireles L.M., Mustata G. Discovery of modulators of protein-protein interactions: current approaches and limitations. Curr. Top Med. Chem. 2011;11:248–257. doi: 10.2174/156802611794072632. [DOI] [PubMed] [Google Scholar]
- 2.Laine E., Goncalves C., Karst J.C., Lesnard A., Rault S., Tang W.J., Malliavin T.E., Ladant D., Blondel A. Use of allostery to identify inhibitors of calmodulin-induced activation of Bacillus anthracis edema factor. Proc. Natl. Acad. Sci. U.S.A. 2010;107:11277–11282. doi: 10.1073/pnas.0914611107. [DOI] [PMC free article] [PubMed] [Google Scholar]
- 3.Wells J.A., McClendon C.L. Reaching for high-hanging fruit in drug discovery at protein-protein interfaces. Nature. 2007;450:1001–1009. doi: 10.1038/nature06526. [DOI] [PubMed] [Google Scholar]
- 4.Esmaielbeiki R., Krawczyk K., Knapp B., Nebel J.C., Deane C.M. Progress and challenges in predicting protein interfaces. Brief. Bioinformatics. 2016;17:117–131. doi: 10.1093/bib/bbv027. [DOI] [PMC free article] [PubMed] [Google Scholar]
- 5.Segura J., Jones P.F., Fernandez-Fuentes N. A holistic in silico approach to predict functional sites in protein structures. Bioinformatics. 2012;28:1845–1850. doi: 10.1093/bioinformatics/bts269. [DOI] [PubMed] [Google Scholar]
- 6.Zellner H., Staudigel M., Trenner T., Bittkowski M., Wolowski V., Icking C., Merkl R. PresCont: predicting protein-protein interfaces utilizing four residue properties. Proteins. 2012;80:154–168. doi: 10.1002/prot.23172. [DOI] [PubMed] [Google Scholar]
- 7.Zhang Q.C., Deng L., Fisher M., Guan J., Honig B., Petrey D. PredUs: a web server for predicting protein interfaces using structural neighbors. Nucleic Acids Res. 2011;39:W283–W287. doi: 10.1093/nar/gkr311. [DOI] [PMC free article] [PubMed] [Google Scholar]
- 8.Engelen S., Trojan L.A., Sacquin-Mora S., Lavery R., Carbone A. Joint evolutionary trees: a large-scale method to predict protein interfaces based on sequence sampling. PLoS Comput. Biol. 2009;5:e1000267. doi: 10.1371/journal.pcbi.1000267. [DOI] [PMC free article] [PubMed] [Google Scholar]
- 9.Negi S.S., Schein C.H., Oezguen N., Power T.D., Braun W. InterProSurf: a web server for predicting interacting sites on protein surfaces. Bioinformatics. 2007;24:3397–3399. doi: 10.1093/bioinformatics/btm474. [DOI] [PMC free article] [PubMed] [Google Scholar]
- 10.Porollo A., Meller J. Prediction-based fingerprints of protein-protein interactions. Proteins. 2007;66:630–645. doi: 10.1002/prot.21248. [DOI] [PubMed] [Google Scholar]
- 11.Qin S., Zhou H.X. meta-PPISP: a meta web server for protein-protein interaction site prediction. Bioinformatics. 2007;23:3386–3387. doi: 10.1093/bioinformatics/btm434. [DOI] [PubMed] [Google Scholar]
- 12.Liang S., Zhang C., Liu S., Zhou Y. Protein binding site prediction using an empirical scoring function. Nucleic Acids Res. 2006;34:3698–3707. doi: 10.1093/nar/gkl454. [DOI] [PMC free article] [PubMed] [Google Scholar]
- 13.de Vries S.J., van Dijk A.D., Bonvin A.M. WHISCY: what information does surface conservation yield? Application to data-driven docking. Proteins. 2006;63:479–489. doi: 10.1002/prot.20842. [DOI] [PubMed] [Google Scholar]
- 14.Landau M., Mayrose I., Rosenberg Y., Glaser F., Martz E., Pupko T., Ben-Tal N. ConSurf 2005: the projection of evolutionary conservation scores of residues on protein structures. Nucleic Acids Res. 2005;33:299–302. doi: 10.1093/nar/gki370. [DOI] [PMC free article] [PubMed] [Google Scholar]
- 15.Neuvirth H., Raz R., Schreiber G. ProMate: a structure based prediction program to identify the location of protein-protein binding sites. J. Mol. Biol. 2004;338:181–199. doi: 10.1016/j.jmb.2004.02.040. [DOI] [PubMed] [Google Scholar]
- 16.Laine E., Carbone A. Local geometry and evolutionary conservation of protein surfaces reveal the multiple recognition patches in protein-protein interactions. PLoS Comput. Biol. 2015;11:e1004580. doi: 10.1371/journal.pcbi.1004580. [DOI] [PMC free article] [PubMed] [Google Scholar]
- 17.Levy E.D. A simple definition of structural regions in proteins and its use in analyzing interface evolution. J. Mol. Biol. 2010;403:660–670. doi: 10.1016/j.jmb.2010.09.028. [DOI] [PubMed] [Google Scholar]
- 18.Herraez A. Biomolecules in the computer: Jmol to the rescue. Biochem. Mol. Biol. Educ. 2006;34:255–261. doi: 10.1002/bmb.2006.494034042644. [DOI] [PubMed] [Google Scholar]
- 19.Schrödinger L. The PyMOL molecular graphics system. 2010. https://www.pymol.org/citing Version 1.8. [Google Scholar]
- 20.Duarte J.M., Srebniak A., Schärer M.A., Capitani G. Protein interface classification by evolutionary analysis. BMC Bioinformatics. 2012;13:1–16. doi: 10.1186/1471-2105-13-334. [DOI] [PMC free article] [PubMed] [Google Scholar]
- 21.Wang G., Dunbrack R.L.J. PISCES: a protein sequence culling server. Bioinformatics. 2003;19:1589–1591. doi: 10.1093/bioinformatics/btg224. [DOI] [PubMed] [Google Scholar]
- 22.Bourne Y., Taylor P., Marchot P. Acetylcholinesterase inhibition by fasciculin: crystal structure of the complex. Cell. 1995;83:503–512. doi: 10.1016/0092-8674(95)90128-0. [DOI] [PubMed] [Google Scholar]
- 23.Lopes A., Sacquin-Mora S., Dimitrova V., Laine E., Ponty Y., Carbone A. Protein-protein interactions in a crowded environment: an analysis via cross-docking simulations and evolutionary information. PLoS Comput. Biol. 2013;9:e1003369. doi: 10.1371/journal.pcbi.1003369. [DOI] [PMC free article] [PubMed] [Google Scholar]


