


Abstract
SNP2TFBS is a computational resource intended to support researchers investigating the molecular mechanisms underlying regulatory variation in the human genome. The database essentially consists of a collection of text files providing specific annotations for human single nucleotide polymorphisms (SNPs), namely whether they are predicted to abolish, create or change the affinity of one or several transcription factor (TF) binding sites. A SNP's effect on TF binding is estimated based on a position weight matrix (PWM) model for the binding specificity of the corresponding factor. These data files are regenerated at regular intervals by an automatic procedure that takes as input a reference genome, a comprehensive SNP catalogue and a collection of PWMs. SNP2TFBS is also accessible over a web interface, enabling users to view the information provided for an individual SNP, to extract SNPs based on various search criteria, to annotate uploaded sets of SNPs or to display statistics about the frequencies of binding sites affected by selected SNPs. Homepage: http://ccg.vital-it.ch/snp2tfbs/.
INTRODUCTION
The developmental program that generates a complex organism such as a human is executed via gene regulatory networks. Interactions between transcription factors (TFs) and target sites are the main edges of such networks as the regulatory output of such interactions determines the expression levels of target genes at a particular time point during development, in a given tissue and under specific conditions.
The human genome contains hundreds of thousands of experimentally documented transcription factor binding sites (TFBSs) and perhaps a hundred times more predicted sites. Precise knowledge of the genetic variants that disrupt TFBSs is thus essential for understanding the gene regulatory mechanisms underlying population diversity and genetic disorders. The abundance and importance of single nucleotide polymorphisms (SNPs) that affect TFBSs is underscored by a large number of recent genome-wide association studies (GWAS). It has been estimated that >90% of the SNPs identified in such studies lie outside the protein coding regions (1). There is a growing belief that a substantial fraction of these SNPs affect gene regulation by altering transcription factor binding onto DNA though other mechanisms (e.g. ncRNA-mediated) cannot be excluded, and a recent study suggests that only a minority of regulatory SNPs act through TF binding (2).
Knowing whether a SNP potentially disrupts or creates a new TFBS is thus of paramount importance for interpreting diverse results from human population studies. In particular, it will help elucidate the molecular mechanisms by which a SNP affects a macroscopic or molecular phenotype. Whereas the goal of earlier GWAS studies was to identify genes implicated in a particular disease or a complex genetic trait, the same approach is now increasingly used to study gene regulatory processes at the molecular level (3).
Existing bioinformatics resources that help users to identify SNPs that affect TFBSs comprise two categories: computer programs to be used on a local computer and web-based resources. Examples of the former class include atSNP (4), sTRAP (5) and motifbreakR (6). Currently active web-based resources include Raven (7), rSNP-MAPPER (8), OncoCis (9) and HaploReg (10). Raven, rSNP-MAPPER and OncoCis compute the TF binding phenotypes on the fly, based on input provided by the user. A comprehensive database of SNPs affecting TFBSs, which can be queried in a variety of different ways and used for prioritization of large SNP collections upstream of GWAS to gain statistical power, does not exist to our knowledge.
It is important to note that the above-mentioned resources do not always return congruent results for the same variants. Most methods use position weight matrices (PWMs), which are fixed length TFBS models represented by a matrix of probabilities reflecting the occurrence frequencies of bases at binding site positions. An exception is rSNP-MAPPER, which uses Hidden Markov Models (11). The arithmetic procedures differ in the way the statistical significance is evaluated, and on whether the score is derived from the single best site or integrated over suboptimal sites as well.
Here, we describe SNP2TFBS, which is an automatically generated comprehensive database of SNPs affecting one or several TFBSs from the JASPAR database (12). For each such SNP it provides the list of TFBSs (PWMs) affected, sorted by the magnitude of the effects. SNP2TFBS is a multiform resource, which is made available to users in three different ways: (i) as a collection of text files in various formats, (ii) via a web interface and (iii) as a collection of scripts enabling the user to regenerate the database from scratch, possibly with other filtering parameters or from other source files.
AUTOMATIC DATA GENERATION PIPELINE
Transcription factor binding site scoring
SNP2TFBS uses integer log-odds weight matrices from JASPAR as provided by the MEME motif database. JASPAR provides PWMs as base frequency matrices. The conversion of base counts into weights is given by:
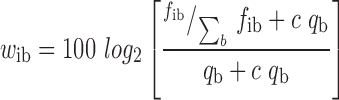 |
where fib is the frequency of base b at PWM position i, qb the background frequency of base b and c the fraction of pseudo-counts added to the observed base frequencies. As mentioned, these weights are rounded to nearest integers to allow for efficient computation of the probability distribution for scores expected from random sequences.
SNP2TFBS reports raw binding scores, which are computed as the sum of the position-specific weights over all bases of the binding site. Note that these numbers have no absolute meaning and are not comparable across different PWMs. P-value thresholds are computed for each PWM by computing the complete probability distribution with a PERL script available from the SNP2TFBS FTP site (Table 1). The P-value of PWM score x is defined as the probability that a random k-mer sequence has a binding score ≥ x given the base composition of the human genome.
Table 1. Data Sources and Software Tools used for Generating SBP2TFBS.
| Source Data | ||
|---|---|---|
| SNP catalog (1000 Genomes) | VCF file from 1000 Genomes (version v5a.20130502), filtered for minor allele frequency > 0.001 | [a] |
| Human reference genome (UCSC) | Human reference genome GRCh37/hg19 in FASTA format | [b] |
| PWM collection (JASPAR/MEME) | JASPAR Core Vertebrate 2014 PWM from MEME motif database version 12.1 | [c] |
| Gene annotation (RefSEQ, Annovar) | From RefSeq (version Feb 2016) as provided by ANNOVAR version v2016-02-0 | [d] |
| External and in-house software tools | ||
| vcf2diploid (v0.2.6) | Mapping alleles from VCF in reference to generate alternate genome | [e] |
| GATK (v3.6) | Liftover variants from reference to alternate assembly | [f] |
| Samtools (v0.1.14) | Generating genome assembly index file (required for Picard) | [g] |
| Picard (v1.131) | Building genome dictionary for GATK | [h] |
| ANNOVAR (v2016-02-01) | Annotating variants of interest with refGene annotation (version Feb 2016) | [d] |
| PWMTools (v1.0.0) | Scanning a whole genome with a PWM (matrix_scan) and determining the P-value threshold for PWM scores (matrix_prob.pl) | [i] |
| Scripts available from the SNP2TFBS FTP site | ||
| makeAltGenome.sh | Wrapper to generate alternate genome assembly | |
| makeSNP2TFBS.sh | Wrapper for scanning genomes with PWMs and output both mapped files (single PWM format) and SNP2TFBS master file | |
| makeDerivedFormats.sh | Wrapper to generate derived formats (BED, SGA and annotated) from both SNP2TFBS single PWM and master files | |
| vcf_filter.pl | Input is a single or multi-sample vcf file (with SNP and indels) and output is a single column vcf file with AF ≥ 0.001 and alleles with highest AF | |
| snp_table.pl | Merging and indexing variants for both genome assemblies | |
| variantPWMmatch.pl | Mapping variants in PWM sites of both genomes | |
| filterVariantPWMmatch.pl | Merging and filtering PWM sites with variants from both genome assemblies | |
| mergeMappedFiles.pl | Merging mapped files for all the factors and output a single file with PWM in rows sorted with absolute score difference between both genome assemblies | |
a1000 Genomes: ftp://ftp-trace.ncbi.nih.gov/1000genomes/ftp/.
cMEME motif database: http://jaspar2014.genereg.net/html/DOWNLOAD/.
dANNOVAR: http://annovar.openbioinformatics.org/en/latest/ (13).
evcf2diploid: http://alleleseq.gersteinlab.org/vcf2diploid_v0.2.6.zip (15).
fsamtools: https://sourceforge.net/projects/samtools/files/samtools/ (17).
iPWMTools: https://sourceforge.net/projects/pwmscan/.
Data sources
In general terms, the SNP2TFBS construction pipeline requires as inputs: (i) a reference genome, (ii) a SNP catalogue, (iii) a PWM collection and, optionally, a gene annotation file in ANNOVAR format (13). The current release was generated from a SNP catalog from 1000 Genomes (filtered by minor allele frequency > 0.001), the humane genome assembly GRCh37/hg19, the vertebrate subset of the JASPAR CORE PWM library from 2014, and gene annotations from RefSeq (14) as provided by ANNOVAR (Figure 1).
Figure 1.

SNP2TFBS data generation pipeline. The rectangular boxes represent data files. Duplicated frames indicate multiple files for each type, one for each position weight matrice (PWM). Encircled numbers refer to procedures: (1) Generation of the alternate human genome (hg19a) from reference genome (hg19) (2) Genome coordinates conversion of the reference single nucleotide polymorphisms (SNP) catalogue (VCF format) to the alternate genome. (3) Whole genome scan of both genomes with PWMs from JASPAR CORE 2014 at P-value threshold 10−5.(4) Extraction of SNPs overlapping PWM matches on the respective genomes. (5) Extraction of SNPs that disrupt, create or change score of overlapping PWM sites between the two genomes (6) Merging of essential information from single PWM files into master file, generation of gene-annotated and reformatted versions (e.g. BED) from primary data files. Variants annotation is carried out using an ANNOVAR input file (humandb/hg19_refGene.txt).
Generation of the alternate human genome
Identification of SNPs that disrupt a TFBS occurring in the reference genome is straightforward. The opposite is more complicated. In order to identify SNPs that create a new binding site via the alternate allele, we generate a so-called ‘alternate’ genome by systematically replacing all reference alleles by the corresponding alternate alleles. For SNPs with more than two known genotypes, we use the most abundant alternate allele. As we don't exclude indel SNPs, the chromosomes of the alternate genome will be of different length, and individual SNPs will map to different positions in the two genomes. We therefore have to generate an alternate SNP catalogue as well. The alternate genome is generated with AlleleSeq (15), a tool originally developed for generating diploid genomes for individuals whose genomes can be phased by comparing the heterozygous variants to the known maternal and paternal genomes. The remapping of the SNP catalogue to the alternate genome is done by first generating a ‘chain’ file with GATK (16) and then using this chain file for conversion of genomic coordinates with the liftOver routine from UCSC.
Mapping SNPs to TFBSs
For each PWM from the source library, we generate a complete list of predicted TFBSs, which match the PWM with a P-value threshold of 10−5 for both versions of the human genome. These lists contain the start and end positions, strand and sequence of each match, as well as the corresponding PWM score. These lists are then intersected with the corresponding SNP catalog. The result of this process is a list of SNPs that overlap with predicted binding sites (PWM matches) of a given TF on the corresponding genome.
Identification of SNPs that change a PWM scores
For each PWM, the two SNP lists from the previous step are compared and those SNPs, which are found in both files with the same PWM score, are discarded. The information pertaining to the remaining SNPs (which either occur in only one of the genomes or have different scores) is then merged in one line. An additional field is added to each line, indicating whether the SNP belongs to a subset of ‘interesting’ SNPs with high regulatory potential. A SNP is flagged as interesting if it overlaps a predicted TFBS with a high binding score with P-value < 3 × 10⁻⁶ in at least one of the two genomes.
The result of the above-described process consists of a series of tab-delimited files in ‘single PWM format’. A detailed description of this format can be found in the README accompanying the SNP2TFBS data files available from the FTP site. These files are then merged into a master file, which provides essential information from the single PWM files on one line for each SNP. Note that a sizable fraction of SNPs in this file affect predicted bindings for multiple factors. In those cases the names of the TFs and corresponding binding scores in the two genomes are listed in order of decreasing score difference.
WEB INTERFACE
The current FTP release is also accessible via a web interface. Besides documentation and hyperlinks to related resources, the web server features two types of tools, an entry viewer and a SNP selection and annotation tool.
Entry viewers
The entry viewers display SNP2TFBS-derived information for individual SNPs and PWMs. SNPs are identified by dbSNP IDs. PWMs are identified by JASPAR accession numbers. Examples of entry URLs are shown below:
http://ccg.vital-it.ch/cgi-bin/snp2tfbs/snpviewer_form_parser.cgi?snpid=rs11603840
http://ccg.vital-it.ch/cgi-bin/snp2tfbs/pwmviewer?ID=MA0139.1&name=CTCF
The SNP viewer displays a list of transcription factor binding sites affected by the sequence variation along with the binding scores for the two alleles. The PWM viewer displays the binding specificity matrix in text form (exactly as used by the SNP2TFBS data generation pipeline) and as a sequence logo, as well as the binding score probability distribution for random matches.
SNP selection and annotation tools
Users have the possibility to select sets of SNPs in four possible ways: (i) by uploading SNP identifiers, (ii) by specifying a set of genomic regions, (iii) by a PWM identifier or (iv) by a gene identifier. Selected are those SNPs, which fulfill the search criteria and are recorded to affect at least one TFBS according to the current version of SNP2TFBS. The results page contains links for downloading the lists of selected SNPs in various annotated formats such as the ‘single PWM’ and ‘master file format’ described in the previous Section. In addition, it displays statistical summary plots for the returned SNP sets. For reasons of transparency, a link to the shell script that has produced the results page on the server side is always provided at the bottom of the page.
SNP identifiers can be uploaded in a basic text format with one ID per line, or in VCF format, possibly including genotype information for individuals. SNPs selected from an uploaded file are always returned in the original format to the user (in addition to the annotated formats). The SNP2TFBS web interface can thus be used for prioritizing potential regulatory SNPs prior to a GWAS study for the sake of gaining statistical power.
There are two ways of specifying genomic regions as search criteria: either by uploading a bed file or by specifying the start and end positions of genomic regions relative to a server-resident list of anchor points. Currently such lists are composed of promoters (transcription start sites) and ChIP-seq peak center positions. The user can thus restrict the query results to SNPs that fall into promoter regions or overlap with an in vivo TFBS validated by a ChIP-seq experiment.
There are five types of statistical plots posted on the output pages: (i) a histogram indicating the number of SNPs that affect the binding of 0, 1, 2, etc. factors (Figure 2), (ii) a plot showing the relative enrichment for different factors (Figure 2), (iii) the distribution of SNPs over gene compartments (exons, introns, etc.) (Figure 2), (iv) a pie-chart showing the number of genomic regions that overlap with zero, one or multiple SNPs and (v) a Venn diagram for SNP sets affecting a single TF, showing the number of SNPs associated with a detectable (above threshold) PWM match in the reference or alternate genome, or both. Only those plots are displayed that make sense with regard to the selection criteria.
Figure 2.

Example of results page returned by the SNP2TFBS selection and annotation tool. Left side: upper part of the results page with three summary statistics plots. Right side: magnified TF enrichment plot. Input to the analysis was a set of SNPs known from multiple GWAS studies to be associated with diabetes.
EXAMPLE
As an example, we use a set of variants reportedly associated with diabetes according to multiple GWAS studies. The list was downloaded from the NHGRI-EBI catalog of published genome-wide association studies (https://www.ebi.ac.uk/gwas/home). (The list can be automatically uploaded to the SNP2TFBS server via an action button on the input form labeled ‘Example 1’.) The TF enrichment plot (Figure 2) obtained for this set shows diabetes-related TFs among the top-ranked factors. For instance, over-expression of SRF leads to insulin resistance in skeletal muscle and is therefore considered a therapeutic target for type 2 diabetes (18).
DISCUSSION
Comparison with other resources
To our knowledge, there is no other comprehensive, downloadable database providing information on SNPs affecting TFBSs with a flexible query interface. The software tools for computing the effects of SNPs on TF binding such as atSNP (4) and sTRAP (5) use more elaborate algorithms but superior performance has not been demonstrated by large-scale benchmarking efforts. Moreover, these tools are more demanding in computer resources and thus less suitable for genome-wide scans with large PWM libraries. A comparison with similar web severs is more interesting. Among the resources we know of, is-rSNP (19) is no longer accessible at the URL indicated in the paper, and RAVEN (7) is declared a retired software tool by the authors although the server still accepts requests. We are thus left with rSNP-MAPPER (8) and HaploReg (10).
We compared the behavior of SNP2TFBS with the two other web servers using a small number of test SNPs, including known regulatory SNPs and randomly selected examples. The results for a few representative cases are summarized in Table 2. Not so surprisingly, they are generally rather divergent, which in case of rSNP-MAPPER may be due to the fact that this tool uses HMMs instead of PWMs as models for TF binding specificity. Overall, there is better agreement between SNP2TFBS and HaploReg than between the other two pairs. Effects on TFBSs not reported by our resources may have been missed because we scanned the genome for PWM matches using a more stringent P-value threshold. This is consistent with the observation that SNP2TFBS on average reports fewer TFs per SNP.
Table 2. Results for selected SNPs returned by SNP2TFB, rSNP-MAPPER and HaploReg.
| SNP ID | SNP2TFBS | rSNP-MAPPER | HaploReg v4.1 |
|---|---|---|---|
| rs72875823 | IRF1/MA0050/ up (3) | IRF2/MA0051/ down (3) (IRF2 up) | STAT_disc3/ up (10) (IRF/ up) |
| rs374186138 | IRF1/MA0050/ up (2) | (no results) | (no results) |
| rs7765514 | (no results) | Sox17/ MA0078/ up (3) | Gm397/ up (1) |
| rs2549007 | ZEB1/MA0103/ down (1) | Sp1/M00932 up (4) | ZEB1_known5/ down (4) |
| rs2549003 | STAT2::STAT1/MA0517/ down (2) | PPARG/ MA0066/ up (1) | STAT_disc6/ down (3) |
| rs58979014 | CTCF/MA0139/ down (1) | NF-muE1/M00651/ down (1) | RXRA_disc5/ down (7) (CTCF/ down) |
Each cell contains the name and PWM ID of the most strongly affected TF according to the corresponding resource. The total number of affected TFs is given in parenthesis. Additional TF hits for a given SNP are shown in parenthesis if they correspond to the top-ranked TF hit from another resource. TF/PWM names are reproduced as displayed by the corresponding resource.
Like HaploReg, SNP2TFBS uses pre-computed results stored in a database. Compared to on-the-fly computation, this mode of implementation guarantees rapid response time for large-scale or even genome-wide SNP queries. Moreover, for computational biologists intending to use our resource on a local computer, it is more convenient to download the pre-computed database files than to regenerate the information with the scripts we provide.
Limitations and future extensions
SNP2TFBS is a specialized database with a narrowly defined scope and exclusively based on computationally predicted binding sites. The reliability of the TFBS phenotypes reported by our resource is a function of the accuracy of the PWM model used for binding strength prediction. One has to keep in mind that, inevitably, some of these PWMs are less accurate than others. Perhaps more importantly, high affinity of a DNA sequence to a TF is not sufficient for in vivo binding, as other factors may interfere with binding such as chromatin accessibility. Experiment-based information on in vivo TF binding and cell type-specific chromatin-state is provided by SNP annotation resources such as HaploReg (10), RegulomeDB (20) and OncoCis (9).
SNP2TFBS is currently only available for the human genome assembly GrCH37/hg19 and limited to TF binding specificity models from the JASPAR database. We plan to support more genome assemblies and PWM collections in the near future. So far, we considered only SNPs from the 1000 genomes SNP catalog with MAF > 0.001. We are aware that some known SNPs satisfying the MAF criterion are missing in this catalog and thus plan to consider SNPs from additional sources for the next database release.
SNP2TFBS reports effects for individual SNPs independently of other SNPs. This is an over-simplification in the rare cases where two or more SNPs fall within the same TFBS. In such cases, the effects on the TFBS should be reported for each haplotype (combination of SNPs). For the moment, we do not see a simple solution to this problem compatible with the current structure and organization of the database.
Currently we apply relatively stringent cut-offs for PWM matches. We are considering using more permissive criteria in the future together with adding new PWM score-based filtering options to the web interface. In any case, the current limitations concern only users of the pre-computed database. Researchers interested in using the methodology behind SNP2TFBS will find it easy to generate their own customized version of the database from source data with the scripts that can be downloaded from the FTP site.
DATABASE AVAILABILITY
SNP2TFBS is freely available without registration at ftp://ccg.vital-it.ch/snp2tfbs/ and http://ccg.vital-it.ch/snp2tfbs/.
Acknowledgments
Computationally intensive tasks were performed at the Vital-IT high performance computing center of the Swiss Institute of Bioinformatics.
FUNDING
Swiss National Science Foundation [CRSII3_154500 to S.K.]. Funding for open access charge: Swiss Institute of Bioinformatics.
Conflict of interest statement. None declared.
REFERENCES
- 1.Hrdlickova B., de Almeida R.C., Borek Z., Withoff S. Genetic variation in the non-coding genome: involvement of micro-RNAs and long non-coding RNAs in disease. Biochim. et Biophys. Acta. 2014;1842:1910–1922. doi: 10.1016/j.bbadis.2014.03.011. [DOI] [PubMed] [Google Scholar]
- 2.Farh K.K., Marson A., Zhu J., Kleinewietfeld M., Housley W.J., Beik S., Shoresh N., Whitton H., Ryan R.J., Shishkin A.A., et al. Genetic and epigenetic fine mapping of causal autoimmune disease variants. Nature. 2015;518:337–343. doi: 10.1038/nature13835. [DOI] [PMC free article] [PubMed] [Google Scholar]
- 3.Pai A.A., Pritchard J.K., Gilad Y. The genetic and mechanistic basis for variation in gene regulation. PLoS Genet. 2015;11:e1004857. doi: 10.1371/journal.pgen.1004857. [DOI] [PMC free article] [PubMed] [Google Scholar]
- 4.Zuo C., Shin S., Keles S. atSNP: transcription factor binding affinity testing for regulatory SNP detection. Bioinformatics. 2015;31:3353–3355. doi: 10.1093/bioinformatics/btv328. [DOI] [PMC free article] [PubMed] [Google Scholar]
- 5.Thomas-Chollier M., Hufton A., Heinig M., O'Keeffe S., Masri N.E., Roider H.G., Manke T., Vingron M. Transcription factor binding predictions using TRAP for the analysis of ChIP-seq data and regulatory SNPs. Nat. Protoc. 2011;6:1860–1869. doi: 10.1038/nprot.2011.409. [DOI] [PubMed] [Google Scholar]
- 6.Coetzee S.G., Coetzee G.A., Hazelett D.J. motifbreakR: an R/Bioconductor package for predicting variant effects at transcription factor binding sites. Bioinformatics. 2015;31:3847–3849. doi: 10.1093/bioinformatics/btv470. [DOI] [PMC free article] [PubMed] [Google Scholar]
- 7.Andersen M.C., Engstrom P.G., Lithwick S., Arenillas D., Eriksson P., Lenhard B., Wasserman W.W., Odeberg J. In silico detection of sequence variations modifying transcriptional regulation. PLoS Comput. Biol. 2008;4:e5. doi: 10.1371/journal.pcbi.0040005. [DOI] [PMC free article] [PubMed] [Google Scholar]
- 8.Riva A. Large-scale computational identification of regulatory SNPs with rSNP-MAPPER. BMC Genomics. 2012;13(Suppl. 4):S7. doi: 10.1186/1471-2164-13-S4-S7. [DOI] [PMC free article] [PubMed] [Google Scholar]
- 9.Perera D., Chacon D., Thoms J.A., Poulos R.C., Shlien A., Beck D., Campbell P.J., Pimanda J.E., Wong J.W. OncoCis: annotation of cis-regulatory mutations in cancer. Genome Biol. 2014;15:485. doi: 10.1186/s13059-014-0485-0. [DOI] [PMC free article] [PubMed] [Google Scholar]
- 10.Ward L.D., Kellis M. HaploReg v4: systematic mining of putative causal variants, cell types, regulators and target genes for human complex traits and disease. Nucleic Acids Res. 2016;44:D877–D881. doi: 10.1093/nar/gkv1340. [DOI] [PMC free article] [PubMed] [Google Scholar]
- 11.Wu J., Xie J. Hidden Markov model and its applications in motif findings. Methods Mol. Biol. 2010;620:405–416. doi: 10.1007/978-1-60761-580-4_13. [DOI] [PubMed] [Google Scholar]
- 12.Mathelier A., Fornes O., Arenillas D.J., Chen C.Y., Denay G., Lee J., Shi W., Shyr C., Tan G., Worsley-Hunt R., et al. JASPAR 2016: a major expansion and update of the open-access database of transcription factor binding profiles. Nucleic Acids Res. 2016;44:D110–D115. doi: 10.1093/nar/gkv1176. [DOI] [PMC free article] [PubMed] [Google Scholar]
- 13.Wang K., Li M., Hakonarson H. ANNOVAR: functional annotation of genetic variants from high-throughput sequencing data. Nucleic Acids Res. 2010;38:e164. doi: 10.1093/nar/gkq603. [DOI] [PMC free article] [PubMed] [Google Scholar]
- 14.O'Leary N.A., Wright M.W., Brister J.R., Ciufo S., Haddad D., McVeigh R., Rajput B., Robbertse B., Smith-White B., Ako-Adjei D., et al. Reference sequence (RefSeq) database at NCBI: current status, taxonomic expansion, and functional annotation. Nucleic Acids Res. 2016;44:D733–D745. doi: 10.1093/nar/gkv1189. [DOI] [PMC free article] [PubMed] [Google Scholar]
- 15.Rozowsky J., Abyzov A., Wang J., Alves P., Raha D., Harmanci A., Leng J., Bjornson R., Kong Y., Kitabayashi N., et al. AlleleSeq: analysis of allele-specific expression and binding in a network framework. Mol. Syst. Biol. 2011;7:522. doi: 10.1038/msb.2011.54. [DOI] [PMC free article] [PubMed] [Google Scholar]
- 16.McKenna A., Hanna M., Banks E., Sivachenko A., Cibulskis K., Kernytsky A., Garimella K., Altshuler D., Gabriel S., Daly M., et al. The genome analysis toolkit: a MapReduce framework for analyzing next-generation DNA sequencing data. Genome Res. 2010;20:1297–1303. doi: 10.1101/gr.107524.110. [DOI] [PMC free article] [PubMed] [Google Scholar]
- 17.Li H., Handsaker B., Wysoker A., Fennell T., Ruan J., Homer N., Marth G., Abecasis G., Durbin R., Genome Project Data Processing, S. The sequence alignment/map format and SAMtools. Bioinformatics. 2009;25:2078–2079. doi: 10.1093/bioinformatics/btp352. [DOI] [PMC free article] [PubMed] [Google Scholar]
- 18.Jin W., Goldfine A.B., Boes T., Henry R.R., Ciaraldi T.P., Kim E.Y., Emecan M., Fitzpatrick C., Sen A., Shah A., et al. Increased SRF transcriptional activity in human and mouse skeletal muscle is a signature of insulin resistance. J. Clin. Invest. 2011;121:918–929. doi: 10.1172/JCI41940. [DOI] [PMC free article] [PubMed] [Google Scholar]
- 19.Macintyre G., Bailey J., Haviv I., Kowalczyk A. is-rSNP: a novel technique for in silico regulatory SNP detection. Bioinformatics. 2010;26:i524–i530. doi: 10.1093/bioinformatics/btq378. [DOI] [PMC free article] [PubMed] [Google Scholar]
- 20.Boyle A.P., Hong E.L., Hariharan M., Cheng Y., Schaub M.A., Kasowski M., Karczewski K.J., Park J., Hitz B.C., Weng S., et al. Annotation of functional variation in personal genomes using RegulomeDB. Genome Res. 2012;22:1790–1797. doi: 10.1101/gr.137323.112. [DOI] [PMC free article] [PubMed] [Google Scholar]