Abstract
We find that single- and double-stranded oligonucleotides have different propensities to adsorb on gold nanoparticles in colloidal solution. We use this observation to design a hybridization assay based on color changes associated with gold aggregation. Because the underlying adsorption mechanism is electrostatic, no covalent functionalization of the gold, the probe, or the target DNA is required. Hybridization conditions can be optimized because it is completely separated from the detection step. The assay is complete within 5 min, and <100 femtomoles of target produces color changes observable without instrumentation. Single-base-pair mismatches are easily detected.
Detection of specific oligonucleotide sequences has important applications in medical research and diagnosis, food and drug industry monitoring, and environmental monitoring (1). Most assays identify specific sequence through hybridization of an immobilized probe to the target analyte after the latter has been modified with a covalently linked label such as a fluorescent or radioactive tag (2, 3). Oligonucleotide detection schemes that avoid analyte tagging such as surface plasmon resonance (4), imaging ellipsometry (5), and sandwich assays using chemically functionalized gold nanoparticles (6–9) have been invented. These approaches use complex labeling or surface functionalization chemistry and usually require expensive measurement instrumentation. Here, we show that the difference in electrostatic properties of single- and double-stranded oligonucleotides (ssDNA and dsDNA) can be used to design a colorimetric method to sense oligonucleotide hybridization. As with some previous assays (6, 10), the color change derives from colloidal gold particle aggregation, but the mechanism in the present work is different so that no modification of the gold or the ssDNA probe or target strands is required. Moreover, hybridization is completely separate from detection so that it can be done under optimal conditions without steric constraints of surface-bound probes that slow hybridization dramatically and make it less efficient.
The central idea in our work is that double- and single-stranded oligonucleotides (dsDNA and ssDNA) have different electrostatic properties. The essential difference arises because ssDNA can uncoil sufficiently to expose its bases, whereas dsDNA has a stable double-helix geometry that always presents the negatively charged phosphate backbone (11, 12). Gold nanoparticles in solution are typically stabilized by adsorbed negative ions (e.g., citrate) whose repulsion prevents the strong van der Waals attraction between gold particles from causing them to aggregate (13, 14). Repulsion between the charged phosphate backbone of dsDNA and the adsorbed citrate ions dominates the electrostatic interaction between the gold and dsDNA so that dsDNA will not adsorb. Because the ssDNA is sufficiently flexible to partially uncoil its bases, they can be exposed to the gold nanoparticles. Under these conditions, the negative charge on the backbone is sufficiently distant so that attractive van der Waals forces between the bases and the gold nanoparticle are sufficient to cause ssDNA to stick to the gold. The same mechanism is not operative with dsDNA because the duplex structure does not permit the uncoiling needed to expose the bases.
In the present article, we document the selective adsorption of ssDNA on gold nanoparticles. In addition, we show that adsorption of ssDNA stabilizes the gold nanoparticles against aggregation at concentrations of salt that would ordinarily screen the repulsive interactions of the citrate ions. Because the color of gold nanoparticles is determined principally by surface plasmon resonance, and because this is dramatically affected by aggregation of the nanoparticles (15–17), we can use the difference in the electrostatic properties of ssDNA and dsDNA to design a simple colorimetric hybridization assay. The assay can be used for sequence-specific detection of untagged oligonucleotides by using unmodified commercially available materials. The assay is easy to implement for visual detection at the level of 100 fmol, and we show that it is easily adapted to detect single-base mismatches between probe and target. We also present initial studies of how length mismatches between target and probe sequence affect the propensity for oligonucleotides to adsorb on gold nanoparticles.
Materials and Methods
We used a colloidal solution of gold nanoparticles ≈13 nm in diameter synthesized by means of citrate reduction of HAuCl4 (18). The concentration of the colloidal solution was typically 17 nM. Lyophilized oligonucleotide sequences and their complements were purchased from MWG Biotech and dissolved in deionized water. Typically, attempted hybridization of the probe and the target was conducted at room temperature for 5 min in 10 mM phosphate buffer solution containing 0.3 M NaCl. Specific salt concentrations vary with experiment and are stated in the figure legends. After the trial hybridization, the trial solution was mixed with gold colloid and immediately followed by addition of salt/buffer solution.
Samples were placed in quartz cuvettes with a 5-mm path length to record absorption spectra by using a PerkinElmer Lambda 19 UV/visible/near infrared spectrometer with water as a reference. For fluorescence spectra and intensities versus time, dye-labeled oligonucleotides purchased from MWG Biotech were used. Solutions in quartz cells with a 1-cm path length were studied on a Jobin Yvon (Longjumeau, France) Fluorolog-3 spectrometer with frontface collection geometry and a 4-nm resolution. Resonance Raman spectra were taken on these dye-labeled oligonucleotides with steady-state, 532-nm excitation and detection by an Ocean Optics (Dunedin, FL) charge-coupled device array with a holographic notch filter to reject Rayleigh scattering. The resolution was ≈10 cm–1. Photographs were taken with a Canon S-30 digital camera.
Results and Discussion
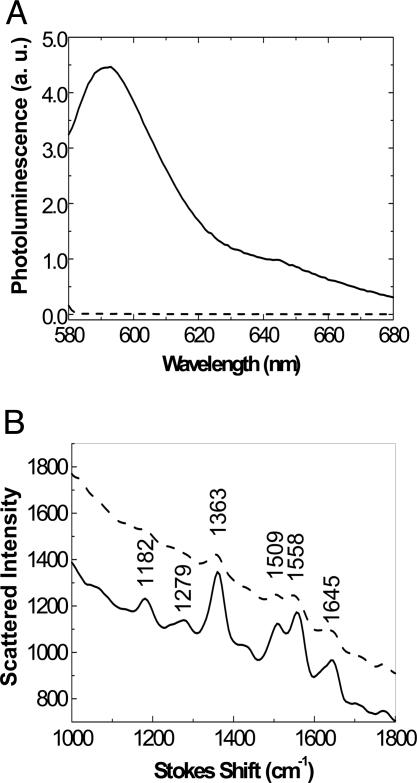
Direct evidence for the preferential interaction between dye-tagged ssDNA and gold nanoparticles is illustrated in Fig. 1. The fact that dye-tagged ssDNA adsorbs on the gold and dsDNA does not can be seen through the effects of adding colloidal gold to solutions containing either dye-tagged ssDNA or dye-tagged dsDNA. In the case of dye-tagged ssDNA, quenching of the dye photoluminescence and enhancement of resonant Raman scattering from the dye are observed. Both of these require intimate contact between the dye and the gold because they are effects of electronic interactions with the gold plasmons.
Fig. 1.
Evidence for preferential adsorption of ssDNA on gold nanoparticles. (A) Fluorescence emitted from rhodamine red attached to ssDNA (dashed curve) and dsDNA (solid curve). The fluorescence spectra were recorded from mixtures consisting of the trial hybridization solution (final concentration of the dye-labeled ssDNA, 50 nM), 500 μl of gold colloid, and 500 μl of 10 mM phosphate buffer solution (PBS) containing 0.1 M NaCl. The ssDNA (dashed) curve was recorded from the mixture containing the probe and its noncomplementary target (nc-target). The solid curve was recorded from the mixture containing the probe and its complementary target (c-target). The sequence for the probe is rhodamine red-5′-AGG AAT TCC ATA GCT-3′ and for the nc-target is 5′-TAA CAA TAA TCC CTC-3′. (B) Surface-enhanced resonant Raman scattering (SERRS) from rhodamine green tagged on ssDNA (solid curve) and dsDNA (dashed curve). SERRS was recorded from the mixture consisting of 5 pmol of probe and 5 pmol of nc-target (solid curve) or 5 pmol of c-target (dashed curve) and 100 μl of 10 mM PBS containing 0.5 M NaCl as well as 300 μl of silver colloid. The Raman modes at 1,645, 1,558, 1,509, and 1,363 cm–1 are aromatic C–C stretching modes of the core of rhodamine green, and the Raman modes at 1,279 and 1,182 cm–1 are rhodamine C–O–C stretching vibrations and C–C stretching vibrations, respectively. The sequences of the probe and nc-target are rhodamine green-5′-TAG CTA TGG AAT TCC TCG TAG GCA-3′ and -5′-TAC GAG TTG AGA ATC CTG AAT GCG-3′, respectively.
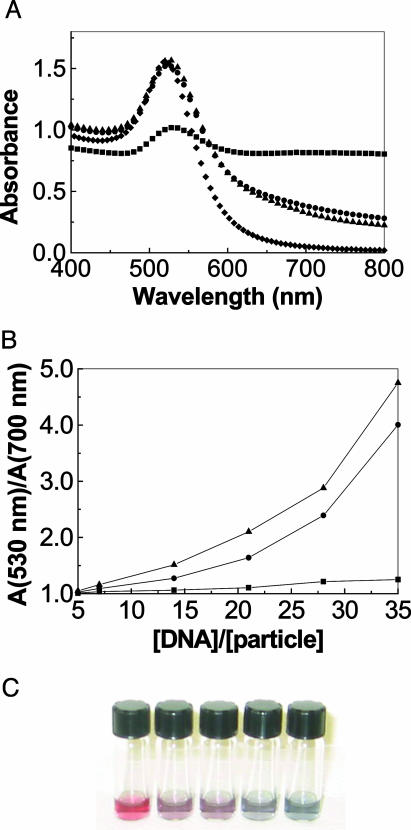
Fig. 2A presents spectra of the colloid before and after addition of ssDNA or dsDNA and salt/buffer solution. Ordinarily, exposure to salt screens the repulsive interactions and causes colloid aggregation (13, 14). Apparently, the adsorption of the ssDNA bases on the gold nanoparticles additionally stabilizes the colloidal gold particles against aggregation when salt is introduced. Thus, solutions with adequate quantities of ssDNA prevent aggregation and the gold colloid remains pink, whereas solutions with dsDNA do not affect the aggregation and the solutions turn blue. Presumably, the adsorption of ssDNA has to do with a redistribution of charge that makes the surface appear more negatively charged. Our Raman studies suggest that the ssDNA does not replace the citrate ions.
Fig. 2.
Colorimetric detection of oligonucleotide hybridization. (A) Absorption spectra of gold colloid (diamonds) and the mixtures containing ssDNA1 (circles), ssDNA2 (triangles), and dsDNA from the hybridization of ssDNA1 and ssDNA2 (squares), respectively. The gold colloid was diluted with water to the same concentration as in the mixtures. The mixtures consisted of trial hybridization solution (5 μlof60 μM ssDNA in salt buffer solution) added to 500 μl of 17 nM gold colloid followed by 200 μl of 10 mM PBS and 0.2 M NaCl. The sequences of ssDNA1 and ssDNA2 are ssDNA1–5′-TAG CTA TGG AAT TCC TCG TAG GCA-3′ and ssDNA2–5′-TGC CTA CGA GGA ATT CCA TAG CTA-3′, respectively. (B) Ratio of the absorbance at 520 nm to the absorbance at 700 nm versus oligonucleotide concentration expressed as the number of DNA per gold nanoparticle. The DNA sequences and the mixture are the same as in A except for variation of the amount of DNA. (C) Colorimetric detection of a DNA sequence fragment characteristic of severe acute respiratory syndrome (SARS) virus (26). All solutions contained 120 pmol of probe, 200 μl of gold colloid, and 100 μl of 10 mM PBS and 0.2 M NaCl. The ratio of the amount of target to the amount probe in the solutions was, from left to right, 0, 0.2, 0.4, 0.6, and 1, respectively. The sequences of probe and target are 5′-GTC ATG CAA CTA GAG ATG CT-3′ and its complement, respectively.
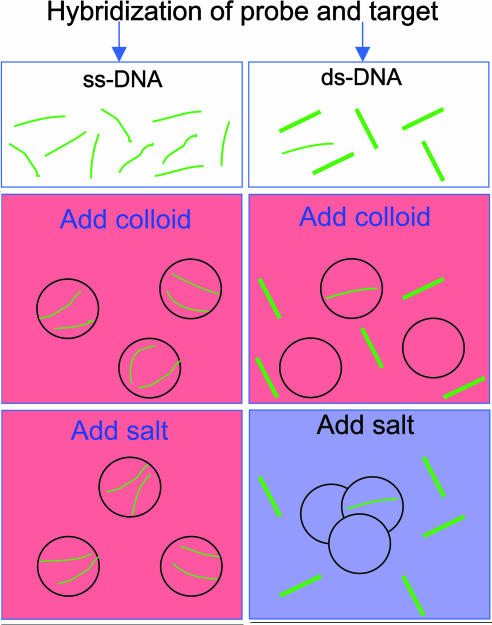
Fig. 2B illustrates a condensed form of the same data for two ssDNA sequences and documents how the color depends on the amount of ssDNA. Remarkably, solutions with only a few ssDNA per gold nanoparticle have distinctly different absorption spectra despite the fact that the surface area of the nanoparticles is sufficient to accommodate several hundred ssDNA 24-mers. With enough ssDNA, the colloid retains a pink color, whereas hybridization of the trial solution to form dsDNA leads to a bluish colloid (Fig. 2C). From a practical point of view, the difference in gold-particle aggregation caused by ssDNA adsorption allows us to design an assay to determine whether a given sample contains ssDNA or dsDNA along the lines of the protocol depicted in Scheme 1. An extremely important feature of the method is that hybridization can be done with label-free oligonucleotides under optimized conditions (pH, salt, and buffer concentrations) and is completely independent of the detection step. We have also investigated what happens with concentration mismatches between target and probe by using solutions where their ratio is varied from 0 to 1. The results (Fig. 2C) prove the technique to be surprisingly robust in its ability to detect the presence of the target. Calibrated colorimetric measurements could be used to determine the amount of target quantitatively.
Scheme 1.
Pictorial representation of the colorimetric method for differentiating between single- and double-stranded oligonucleotides. The circles represent colloidal gold nanoparticles. The mechanism is described in the text.
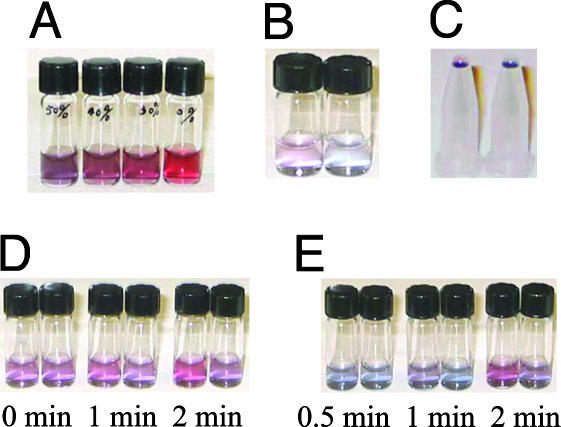
Similarly, we can consider the case where the analyte solution contains a mixture of oligonucleotide sequences as might occur in products of PCR where primers and other fragments are present (19). Fig. 3A illustrates the result for a mixed oligonucleotide analyte with various fractions of target sequence, and it is clear that as little as 30% target is easily detected. A situation similar to concentration mismatch occurs when the target and probe sequences are complementary but have different lengths. In that case, one could imagine that some of the hybridized chain appears to have the electrostatic properties of ssDNA, whereas other portions appear to be double stranded. Qualitatively, the results are similar to those with perfect length match, and even hybridized probe and target strands with relatively large length differences (of order 5–10 bp) behave as double stranded.
Fig. 3.
Colorimetric detection of targets in mixtures, low concentrations, low amounts, and with single-base mismatches. (A) Detection of a target sequence in a mixture. Three and one-half microliters of trial hybridization solution was mixed with 300 μl of gold colloid and 300 μl of 10 mM phosphate buffer solution containing 0.2 M NaCl. The c-target contained in the solutions from left to right were 50%, 40%, 30%, and 0% of the total oligonucleotide concentration with nc-target making up the remainder. All solutions contained the 105 pmol of probe, equal to the total of c-target and nc-target. The sequences of probe and nc-target are 5′-TGC CTA CGA GGA ATT CCA TAG CTA-3′ and 5′-TAC GAG TTG AGA ATC CTG AAT GCG-3′, respectively. (B) Detection of target DNA in low-concentration solution. One hundred microliters of gold colloid was diluted in 300 μl of water mixed with 1 μl of trial hybridization solution and 300 μl of 10 mM phosphate buffer solution containing 0.3 M NaCl (final target concentration, 4.3 nM). The left vial contained unmatched ssDNA strands, and the right vial contained complementary strands. The sequences of probe and nc-target are 5′-TAC GAG TTG AGA ATC CTG AAT GCG-3′ and 5′-TAG CTA TGG AAT TCC TCG TAG GCA-3′.(C) Detection of small amounts of target. Five microliters of gold colloid was mixed with 0.2 μl of trial hybridization solutions containing 0.3 μM oligonucleotide then mixed with 3 μl of 10 mM phosphate buffer solution containing 0.2 M NaCl. The resulting droplets of noncomplementary ssDNA mixture (Left) and complementary ssDNA (Right), each containing 60 fmol, were placed on inverted plastic vials for viewing. The sequences of probe and nc-target are the same as those in B.(D) Identification of single-base-pair mismatch in dsDNA via dehybridization kinetics in water. One microliter of dsDNA solution was dehybridized in 100 μl water for, from left to right, 0, 1, and 2 min, respectively, then mixed with 300 μl of gold nanoparticles and 300 μl of 10 mM phosphate buffer solution 0.3 M NaCl (final dsDNA concentration, 0.043 μM). The solution in the left vial of each dehybridization time group contained dsDNA with a single-base-pair mismatch, and the right vial contains perfectly matched target and probe strands. The red color indicates that part of the dsDNA has dehybridized. The oligonucleotide sequences are identified in the text. (E) Identification of single-base-pair mismatch in dsDNA via dehybridization kinetics in gold colloid. One microliter of oligonucleotide and 300 μl of gold nanoparticles were ultrasonicated, from left to right, for 0.5, 1, and 2 min, respectively, and then mixed with 300 μl of 10 mM phosphate buffer solution 0.3 M NaCl (final target concentration, 0.05 μM). The solution in the left vial of each dehybridization time group contained dsDNA with a single-base-pair mismatch, and the right vial contained perfectly matched target and probe strands. The red color indicates that part of the dsDNA has dehybridized. The oligonucleotide sequences are identified in the text.
The extraordinarily high extinction coefficient of gold nanoparticles (20) makes the colorimetric method extremely sensitive. At 17 nM concentration (18), a 1-cm path length provides optical densities near unity. Empirically, we have found it easy to visually identify the color in 5-μl droplets that contain <100 femtomoles of gold particles. Fig. 2B illustrates that ssDNA concentrations only slightly greater than the nanoparticle concentration are sufficient to stabilize the colloid against aggregation when exposed to salt. Consequently, one would expect to be able to differentiate between amounts of ssDNA and dsDNA of order 100 fmol without instrumentation. Even though adsorption of only one or two ssDNA strands per nanoparticle covers very little of the gold's surface area, it appears to add net negative charges that are distributed around the nanoparticle through rearrangement of charges in the citrate coating. Consistent with the above reasoning, target concentrations of 4.3 nM (Fig. 3B) or total amounts of target as low as 60 fmol (Fig. 3C) produce easily visible differences. Using an absorption spectrometer to evaluate color should produce at least an order of magnitude improvement in sensitivity, and the use of a null method for measuring absorption such as photothermal deflection would still further enhance sensitivity (21).
Our method is easily adapted to identifying single-base-pair mismatches between probe and target as is essential for detection of biologically important single nucleotide polymorphisms (19). We use the fact that the kinetics of dsDNA dissociation into ssDNA fragments depend on the binding strength (22, 23) and are therefore faster for mismatched dsDNA (ds′DNA) than for perfectly matched dsDNA. We therefore allow the dsDNA from the trial solution to dehybridize briefly in water without salt before adding gold colloid and the salt/buffer solution. We observe an obvious color difference between perfectly matched (5′-TAC GAG TTG AGA ATC CTG AAT GCG-3′ and its complement) and single-base-pair-mismatched dsDNA segments (5′-TAC GAG TTG AGA ATC CTG AAT GCG-3′ and 5′-CGC ATT CAG GCT TCT CAA CTC GTA-3′) if we wait for 2 min before performing our assay (Fig. 3D). Although dehybridization can also be done in the gold colloid solution simply by delaying the introduction of the buffer/salt solution, we find that the dsDNA is more stable in the colloid solution than in water and see no significant dehybridization as determined by our assay after 10 min in gold colloid. A single-base-pair-mismatched DNA segment showed obvious dehybridization after 5 min. Subjecting the mixture of oligonucleotide solution and gold colloid to ultrasound for 1 or 2 min before mixing with buffer/salt solution accelerates the dehybridization and also gives excellent contrast between dsDNA and ds′DNA (Fig. 3E).
Conclusions and Prospects
We have demonstrated that ssDNA and dsDNA have different propensities to adsorb on gold nanoparticles because of their electrostatic properties. We have used the differential adsorption to design an oligonucleotide recognition assay that uses only commercially available materials,† takes less than 10 min, requires no detection apparatus, is sensitive to single-base mismatches, and is reasonably tolerant of concentration or length mismatches. The assay we have described has additional benefits beyond its speed and simplicity. Because we are able to exploit the electrostatic properties of the DNA, hybridization is separated from detection so that the kinetics and thermodynamics of DNA binding are unperturbed by steric constraints associated with probe-functionalized surfaces. In addition, the assay is homogeneous because it occurs exclusively in the liquid phase, a feature that makes it easy to automate by standard robotic manipulation of microwell plates. We should point out that the ability to differentially adsorb ssDNA onto the gold particles can also form the basis for a sensitive assay based on fluorescence that still avoids tagging of the analyte. With fluorescent dyes incorporated onto the probe strands, we are able to selectively quench the fluorescence of the ssDNA as in Fig. 1 A because it forces the dye to be near the gold nanoparticles where the fluorescence is quenched (24, 25). If the tagged probe ssDNA binds the target, however, the dsDNA does not adsorb on the gold and the fluorescence persists. Further details of that variation and direct application of the present ideas to PCR-amplified genomic DNA are reported in refs. 27 and 28.
Acknowledgments
We are grateful to Howard Federoff for his encouragement and to Doug Turner for helpful discussions. This work was supported by National Institutes of Health Grant AG18231.
Abbreviations: c-target, complementary target; dsDNA, double-stranded DNA; nc-target, noncomplementary target; ssDNA, single-stranded DNA.
Footnotes
Although we have synthesized our own gold nanoparticles for this work, we have also shown that purchased colloidal gold suspensions can be used to obtain similar results.
References
- 1.Primrose, S. B. & Twyman, R. M. (2003) Principles of Genome Analysis and Genomics (Blackwell, Malden, MA), 3rd Ed.
- 2.Hames, B. D. & Higgins, S. J. (1995) Gene Probes 1 (IRL, New York).
- 3.Kricka, L. J. (1992) Nonisotopic DNA Probe Techniques (Academic, San Diego).
- 4.Brockman, J. M., Frutos, A. G. & Corn, R. M. (1999) J. Am. Chem. Soc. 121, 8044–8051. [Google Scholar]
- 5.Ostroff, R. M., Hopkins, D., Haeberli, A. B., Baouchi, W. & Polisky, B. (1999) Clin. Chem. 45, 1659–1664. [PubMed] [Google Scholar]
- 6.Elghanian, R., Storhoff, J. J., Mucic, R. C., Letsinger, R. L. & Mirkin, C. A. (1997) Science 277, 1078–1081. [DOI] [PubMed] [Google Scholar]
- 7.Taton, T. A., Mirkin, C. A. & Letsinger, R. L. (2000) Science 289, 1757–1760. [DOI] [PubMed] [Google Scholar]
- 8.Cao, Y. C., Jin, R. C. & Mirkin, C. A. (2002) Science 297, 1536–1540. [DOI] [PubMed] [Google Scholar]
- 9.Park, S. J., Taton, T. A. & Mirkin, C. A. (2002) Science 295, 1503–1506. [DOI] [PubMed] [Google Scholar]
- 10.Sato, K., Hosokawa, K. & Maeda, M. (2003) J. Am. Chem. Soc. 125, 8102–8103. [DOI] [PubMed] [Google Scholar]
- 11.Watson, J. D. (1968) The Double Helix: A Personal Account of the Discovery of the Structure of DNA (Weidenfeld and Nicholson, London).
- 12.Bloomfield, V. A., Crothers, D. M., Jr., & Tinoco, I. (1999) Nuclei Acids: Structures, Properties, and Functions (University Science Books, Sausalito, CA).
- 13.Hunter, R. J. (2001) Foundations of Colloid Science (Oxford Univ. Press, New York).
- 14.Shaw, D. J. (1991) Colloid and Surface Chemistry (Butterworth–Heinemann, Oxford).
- 15.Link, S. & El-Sayed, M. A. (2000) Int. Rev. Phys. Chem. 19, 409–453. [Google Scholar]
- 16.Kreibig, U. & Genzel, L. (1985) Surface Sci. 156, 678–700. [Google Scholar]
- 17.Quinten, M. & Kreibig, U. (1986) Surface Sci. 172, 557–577. [Google Scholar]
- 18.Grabar, K. C., Freeman, R. G., Hommer, M. B. & Natan, M. J. (1995) Anal. Chem. 67, 735–743. [Google Scholar]
- 19.Rolfs, A., Schuller, I., Finckh, U. & Weber-Rolfs, I. (1992) PCR: Clinical Diagnostics and Research (Springer, Berlin).
- 20.Doremus, R. H. (1964) J. Chem. Phys. 40, 2389–2396. [Google Scholar]
- 21.Jackson, W. B., Amer, N. M., Boccara, A. C. & Fournier, D. (1981) Appl. Opt. 20, 1333–1344. [DOI] [PubMed] [Google Scholar]
- 22.Owczarzy, R., Vallone, P. M., Gallo, F. J., Paner, T. M., Lane, M. J. & Benight, A. S. (1997) Biopolymers 44, 217–239. [DOI] [PubMed] [Google Scholar]
- 23.Santalucia, J., Kierzek, R. & Turner, D. H. (1991) J. Am. Chem. Soc. 113, 4313–4322. [Google Scholar]
- 24.Dubertret, B., Calame, M. & Libchaber, A. J. (2001) Nat. Biotechnol. 19, 365–370. [DOI] [PubMed] [Google Scholar]
- 25.Du, H., Disney, M. D., Miller, B. L. & Krauss, T. K. (2003) J. Am. Chem. Soc. 125, 4012–4013. [DOI] [PubMed] [Google Scholar]
- 26.Drosten, C., Gunther, S., Preiser, W., van der Werf, S., Brodt, H. R., Becker, S., Rabenau, H., Panning, M., Kolesnikova, L., Fouchier, R. A., et al. (2003) New Engl. J. Med. 348, 1967–1976. [DOI] [PubMed] [Google Scholar]
- 27.Li, H. X. & Rothberg, L. J. (September 15, 2004) Anal. Chem., 10.1021/ac049173n.
- 28.Li, H. X. & Rothberg, L. J. (2004) J. Am. Chem. Soc. 126, 10958–10961. [DOI] [PubMed] [Google Scholar]


