Abstract
Single-nucleotide polymorphisms are the largest source of genetic variation in humans. We report a method for the discovery of single-nucleotide polymorphisms within genomic DNA. Pooled genomic samples are amplified, denatured, and annealed to generate mismatches at polymorphic DNA sites. Upon photoactivation, these DNA mismatches are then cleaved site-specifically by using a small molecular probe, a bulky metallointercalator, Rhchrysi or Rhphzi. Fluorescent labeling of the cleaved products and separation by capillary electrophoresis permits rapid identification with single-base resolution of the single-nucleotide polymorphism site. This method is remarkably sensitive and minor allele frequencies as low as 5% can be readily detected.
Single-nucleotide polymorphisms (SNPs) have been the focus of research for both their roles in disease and use as markers in genetics (1, 2). Occurring as frequently as 1 SNP per 1,000 bp, they are by far the most common mutation present in the human genome (3, 4). Ten million SNPs with an allele frequency of >1% and ≈5 million so-called common SNPs with frequencies exceeding 10% are estimated to exist (5, 6). Most SNPs have no effect on gene expression or gene products and therefore appear to be phenotypically silent.
It has been suggested that developing a dense map of SNP locations can significantly aid in the identification of genetic factors associated with disease (7). Owing to the presence of recombination hot spots, the genome is organized into haplotype blocks that infrequently undergo recombination separated by areas of frequent recombination (8, 9). On which regions might SNP discovery efforts then be focused? Because of the great cost associated with full-scale mapping of SNPs throughout the genome, current efforts have been directed toward SNP discovery within genes likely associated with disease or disease predisposition (10). This strategy then necessarily excludes discovery within regions of the genome of unknown function.
Despite the value of discovery of SNPs throughout the genome, it remains a costly and time-consuming challenge. Current techniques require the sequencing of a particular region of the genome several times to locate a rare SNP (11, 12). In addition, these methods suffer from a high false-positive rate (11, 13). Once the SNP has been localized, many existing technologies can be applied to determine alleles and allele frequencies of the SNP for a broader population (14). For this reason, the development of an assay for the discovery and localization of SNPs would be particularly attractive.
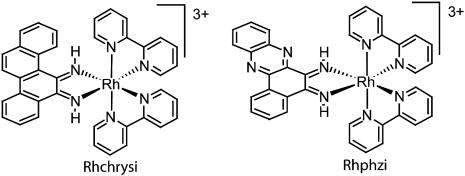
As an alternative to resequencing as a method of SNP discovery, we have adapted our mismatch-specific rhodium(III) intercalators to the task of detecting low-frequency sequence variations (15, 16). Although DNA mismatches may be of varied sequence and within varied sequence contexts, the factor that distinguishes mispaired DNA bases from Watson–Crick base pairs is the local instability arising from decreased hydrogen bonding and aromatic stacking of the mismatched bases (17). This destabilization is exploited in site recognition by [Rh(bpy)2(phzi)]3+ (phzi, 3,4-benzo[a]phenazine quinone diimine), Rhphzi, and [Rh(bpy)2(chrysi)]3+ (chrysi, 9,10-chrysene quinone diimine), Rhchrysi. (Fig. 1). Based on crystallography, the smaller phi (phenanthrenequinone diimine) ligand is an optimal size for intercalation in well matched DNA interbase pair sites (18). However, the analogous but more bulky phzi and chrysi ligands are wider than a well matched base pair. This shape-selective approach allows intercalation of the bulky chrysi and phzi complexes in the destabilized region of the DNA mismatch, but not within stable, well paired regions. [Rh(bpy)2(chrysi)]3+ (Rhchrysi) and [Rh(bpy)2(phzi)]3+ (Rhphzi) have been shown to bind DNA mismatches with remarkable specificity and high affinity. Upon irradiation, these complexes promote selective direct strand cleavage of the DNA backbone neighboring the mismatched site. It has been documented that Rhchrysi targets 80% of all possible base mismatches, with full variation of the sequence context and identity of the mismatch (19). Furthermore, the affinity for sites correlates with thermodynamic instability. Owing to the high specificity of these complexes, the targeting of a single base mismatch within a 2,725-bp DNA duplex by photocleavage has also been demonstrated (20).
Fig. 1.
Bulky metallointercalators targeted to mismatches: Rhchrysi (Left) and Rhphzi (Right).
Here, we exploit our mismatch-specific rhodium complexes to develop a previously unreported methodology for the detection of SNPs within genomic DNA. The site-specific targeting of DNA mismatches by the metal complexes provides a general approach to the discovery of SNPs within amplified regions of the genome.
Materials and Methods
Materials. [Rh(bpy)2(phzi)]Cl3 and [Rh(bpy)2(chrysi)]Cl3 were synthesized according to published procedures (15, 16). Restriction enzymes, XhoI and ClaI, calf intestinal alkaline phosphatase, and Taq DNA polymerase were purchased from Roche Molecular Biochemicals. The SNaPshot labeling kit was provided by Applied Biosystems. ExoI was purchased from New England Biolabs. Primers used were synthesized by using an ABI 394 DNA synthesizer (Applied Biosystems) by standard phophoramidite chemistry and purified by using PolyPakII columns (Glen Research, Sterling, VA). Plasmids used as templates in this assay were provided by Applied Biosystems; their sequence is included in the supporting information, which is published on the PNAS web site. Pooled human genomic DNA was purchased from Roche Molecular Biochemicals.
Preparation of Mismatched Templates. Both the plasmid templates and pooled human genomic DNA were amplified by using PCR with the primers, F 5′-TTT TTT ATC GAT CGC GTT GGC CGA TTC ATT AAT G-3′ andR5′-TTT TTT CTC GAG GCT GCG CAA CTG TTG GGA AG-3′, or F 5′-AAA ATC GAT AGA ACA AAA GGA TAA GGG CTC AG-3′ and R 5′-AAA CTC GAG GTG TGG CCA TAT CTT CTT AAA CG-3′, respectively. These products were sequenced by standard fluorescent dye terminator cycle sequencing (21). After the DNA amplification, primers and unincorporated dNTPs were degraded with a combination of 6 units of ExoI and 20 units of calf intestinal alkaline phosphatase. The DNA product was purified by using a QIAquick PCR purification column (Qiagen, Valencia, CA) eluting into 10 mM Tris·HCl (pH 8.5). DNA was thermally denatured under these low-ionic-strength conditions by heating at 99°C for 25 min. DNA was annealed in the presence of 60 mM Tris·HCl (pH 7.5)/10 mM MgCl2/100 mM NaCl/1 mM dithioerythritol, by heating to 95°C for 10 min, and linearly ramping temperature to 4°C over a period of 150 min. This procedure generates mismatches at heterozygous SNP sites. Restriction sites present in the primers were cut by using 5 units of ClaI and 5 units of XhoI incubated at 37°C for 60 min and denatured at 80°C for 20 min.
Detection of Mismatches Generated at the Polymorphic Sites. The annealed, mismatched DNA was cleaved by using 500 nM Rhchrysi or 200 nM Rhphzi, in 30 mM Tris·HCl (pH 7.5)/5 mM MgCl2/50 mM NaCl/0.5 mM dithioerythritol, by irradiating samples at 442 nm or 340 nm, respectively, for 60 min, or, as stated, by using a 1,000-W Oriel Hg/Xe arc lamp fitted with a monochromator, a 295-nm UV cutoff filter, and an IR filter (Thermo-Oriel, Stratford, CT). Cleavage can also be induced by using a standard 302-nm transilluminator, inverted at a distance of 4 cm from the top of the sample, or 365-nm “blacklight,” also at a distance of 4 cm. Irradiation times with a transilluminator or blacklight are longer than those required for the arc lamp. The rate of cleavage is ≈40-fold less with these other light sources; an irradiation time of ≈14 h is required to achieve complete cleavage of the template. After cleavage, samples were dried and fluorescent tags were introduced by single-base extension with the SNaPshot kit. The fluorescently labeled products were analyzed by capillary electrophoresis performed on an ABI Prism 310 instrument (Applied Biosystems) by using a 47 cm × 50 μm capillary, POP-4 polymer, dye set E5.
Varying Template Allele Frequency. Allele frequencies were varied by first amplifying both the G plasmid and the C plasmid, separately. The amount of DNA produced was quantitated by ethidium bromide fluorescence. These products were then mixed in varying ratios to create samples containing a fraction of G template from 0.01 to 0.99. These samples were denatured and annealed; then, the generated mismatches were cleaved and detected.
Results
Preparation of Mismatched DNA Templates for SNP Detection. Typically, rhodium-mediated cleavage of DNA has been performed on relatively short oligonucleotide duplexes and the cleavage products have been monitored by using denaturing PAGE (22). In addition, duplexes containing mismatches have been generated by the high-temperature annealing of synthetic singlestranded DNA (15). These conditions provide superb control and sensitivity over reaction conditions, allowing the determination of binding constants, etc. In contrast, for the detection of SNPs within longer biologically derived DNA duplexes, these methods are not applicable.
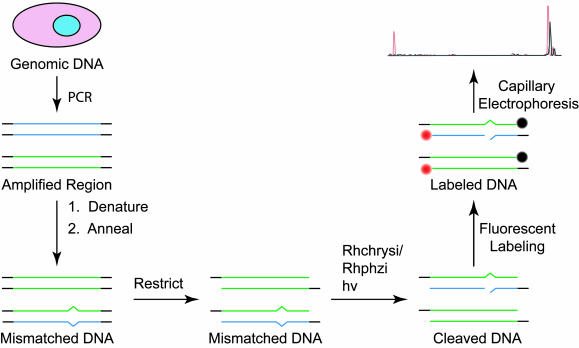
Our alternative strategy is shown in Fig. 2. DNA duplexes are first generated by PCR with a template. These duplexes are then fully denatured at high temperatures and low ionic strength to generate single-stranded DNA (23). These single strands are then annealed at a higher ionic strength by slow cooling to ambient temperature. In this way, the forward and reverse strands anneal randomly to obtain a mixture of products, in which DNA mismatches are generated at the sites of SNPs. The degree of strand exchange can be calculated from the maximum cleavage intensities observed for equimolar polymorphic templates. In this system, strand exchange exceeds 45% and approaches the statistical limit. We have chosen to use this low ionic strength denaturing over the previously demonstrated sodium hydroxide denaturing to eliminate the time-consuming desalting steps (20).
Fig. 2.
Strategy for detecting an SNP from genomic DNA in pooled samples. The portion of genomic DNA to be analyzed is selected and amplified by PCR. These PCR products are denatured and annealed to produce mismatches at the locations of heterozygous SNPs. The DNA is restricted to create a 3′ underhang to be labeled. The mismatched DNA is then treated with either Rhchrysi or Rhphzi and irradiated to cleave the DNA at the locations of the mismatches, corresponding to the SNP sites. The cleaved products are fluorescently labeled, followed by separation and detection by capillary electrophoresis.
In addition to the generation of mismatched templates for SNP cleavage, a method of detecting the DNA and its cleaved products was needed. Fluorescent tagging is preferable over radionucleotides and phosphorimagery used previously because of the abundance of instruments available for the rapid and high-throughput analysis of fluorescently labeled polynucleotides, primarily for sequencing (15, 16, 20). To incorporate fluorescent tags site-specifically, PCR primers used in amplification were prepared with a ClaI restriction site on the forward primer and an XhoI restriction site on the reverse primer. After cleavage with the restriction enzymes to generate 3′ underhangs, these restriction sites may be labeled by polymerase and standard dideoxyribonucleotide dye-terminators used in sequencing and primer extension genotyping (21, 24). This procedure results in unique fluorescent tagging of both 3′ ends of the DNA simultaneously.
Templates for these studies were derived from two sources. First, for basic characterization of the system, four plasmid templates, denoted the A, T, G, and C templates, are used, each containing a different base at the same position in the plasmid. Second, a pooled human genomic DNA sample from 80 individuals was used as a template in the detection of a known SNP in the tumor necrosis factor (TNF) gene.
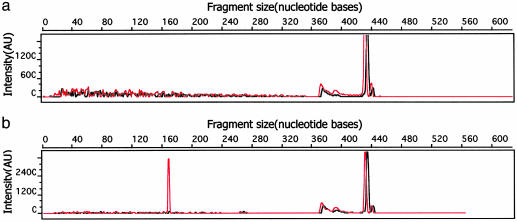
Discovery of SNPs by Photocleavage. Photocleavage and analysis by using the plasmid templates were performed, and representative results are shown in Fig. 3. For pure plasmid samples that are homozygous at the polymorphic site, no mismatches are generated and thus no cleaved products are detected. Irrespective of rhodium addition or time of irradiation, a low background is detected in all samples, typically present with an intensity of <2% of the parent peak. In contrast, samples containing a heterozygous locus, formed by the mixing of dissimilar templates before annealing, clearly show the formation of cleaved products after irradiation. Within the sequence context of our plasmid, the forward strand is preferentially cleaved in all cases. The size of the cleaved product aligns precisely with the location of the polymorphic site. Upon extensive irradiation, small amounts of cleaved reverse strand are also noted. This is expected because rhodium complexes of this type cleave the DNA duplex asymmetrically (20). Because of this asymmetric cleavage, our strategy requires fluorescent tagging of both strands.
Fig. 3.
Representative capillary electrophoresis traces demonstrating the detection of an SNP within a plasmid. The red trace represents the forward strand and the black trace corresponds to the reverse strand. (a) When a homozygous template, in this case, the homozygous plasmid A, is tested by the assay procedure, no cleaved products are detected. The full-length PCR product, 436 bases in length, is present. (b) When two templates, here G and C plasmids, are mixed, denatured, and reannealed to generate a heterozygous site, mismatches are generated. After photocleavage for 30 min at 442 nm with 500 nM Rhchrysi, and fluorescently tagging, the cleaved product, 170 bases in length, is evident (see Materials and Methods). The horizontal scale shows the fragment size in units of nucleotides. The vertical scale is fluorescent signal intensity in arbitrary units. We ascribe the small peak, ≈320 bases in length, to overloading of the sample.
A summary of the possible polymorphisms and their detected cleavage with both Rhchrysi and Rhphzi is shown in Table 1. As is evident, a variety of SNPs are detected by using both complexes. Also noteworthy, however, is the lack of reaction when the combination of A and C templates is used. These templates are expected to generate AG and CT mismatches. If we look at the surrounding sequence context of the polymorphic site, we obtain 5′-AAAGANAAATC-3′, where N is the polymorphic site (see supporting information). Within this sequence context, the thymine-containing mismatches are exceptionally stable because of base slippage; the mismatched thymine is stabilized by hydrogen bonding with the adenines present on the opposite strand. Because our Rhchrysi and Rhphzi only target destabilized DNA mismatches, the stabilized site is not targeted. These data emphasize the fact that specific cleavage is a clear indicator of the SNP, but the lack of reaction does not preclude the presence of an SNP creating a thermodynamically stable mismatch.
Table 1. Homozygous and heterozygous templates and their photocleavage.
| SNP alleles present* | Mismatches generated† | Rhphzi photocleavage‡ | Rhchrysi photocleavage‡ |
|---|---|---|---|
| AT | None | ||
| TA | None | ||
| GC | None | ||
| CG | None | ||
| AT + TA | AA + TT | X | |
| AT + GC | AC + GT | X | X |
| AT + CG | AG + CT | ||
| TA + GC | TC + GA | X | X |
| TA + CG | TG + CA | X | X |
| GC + CG | GG + CC | X | X |
The base pair(s) at the polymorphic site present in the template plasmid. The first base indicates the template plasmid used.
Upon denaturing and annealing of the PCR-amplified template, mismatches can be generated as indicated if heterozygousity exists. DNA duplexes are denatured in the presence of 10 mM Tris (pH 8.5) and annealed with the addition of buffer to make a final concentration of 60 mM Tris·HCl (pH 7.5)/10 mM MgCl2/100 mM NaCl/1 mM dithioerythritol. This buffer is diluted to half with the addition of metal complex to 500 nM Rhchrysi or 200 nM Rhphzi.
Both Rhphzi and Rhchrysi generate site-specific cleavage products, upon irradiation at 340 nm for 1 h or 442 nm for 1 h, respectively, as denoted by X.
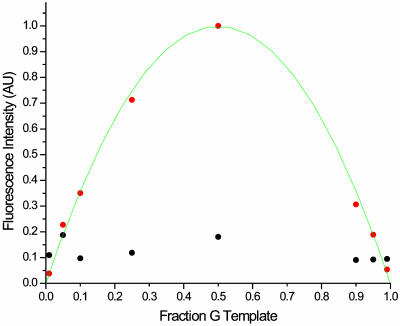
The effect of varying the allele frequency was also examined. Rather than mixing approximately equal amounts of two alleles, various fractions of the two alleles are mixed and assayed to simulate allele frequencies from 0.01 to 0.99. In this way the sensitivity of this method is measured. Frequencies as low as 0.05 are detectable above the background present (Fig. 4).
Fig. 4.
A plot showing the effect of varying the allele frequency on the fluorescent intensity of the cleaved products. The fraction of G template added to C template was varied over a range of 0.01–0.99 to imitate the effect of varying the allele frequencies on this assay. This fraction of G, which may be thought of as an allele frequency, is plotted on the horizontal axis. The normalized fluorescence intensity of the cleaved peak is plotted in red. The normalized background peak intensity is plotted in black. All fluorescence measurements are normalized to the uncleaved parent peak intensity. For fractions of 0.05 or greater, the cleaved peak exceeds background and can therefore be detected as an SNP. A line consistent with a fit to the statistical mixture is included to guide the eye.
Photolysis with Common Light Sources. A mercury-xenon arc lamp and monochromator are typically used in our photocleavage reactions. Although this lamp is convenient because of its high-intensity light, other more common laboratory light sources may be used in the photocleavage reaction. Both a 302-nm transilluminator used in the visualization of agarose gels and a 365-nm “blacklight” have been used to activate the metal complex for DNA cleavage, although at a somewhat diminished rate owing to the decreased intensity of these sources. For example, although the arc lamp is capable of driving the cleavage reaction to completion in 20 min, the 365-nm blacklight promotes 28% reaction in 4 h and the 302-nm transilluminator promotes 15% reaction in 4 h. Before any light source is used with this assay, controls are conducted in the absence of rhodium complex to determine whether the light alone can damage the DNA. None of these lamps are capable of detectably damaging DNA. Typical white fluorescent light and incandescent light do not produce sufficient UV light for strand scission with Rhchrysi or Rhphzi.
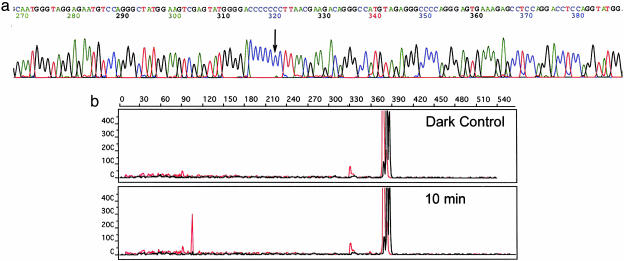
Detection of an SNP from a Biological Source. Ultimately, this method is not designed for the detection of an SNP present in a synthetic plasmid, but rather it is designed for the discovery of previously unknown SNPs from biological sources. We therefore sought to examine a target SNP known to be present in the general population and well characterized as to its allele frequency as a test of the methodology. Here then, the known SNP, –862, in the TNF promoter is targeted for detection (25).
To determine the presence and frequency of this SNP within our pooled genomic DNA sample, taken from a mix of genomic DNA from 80 individuals, this SNP may also be detected by the generally accepted resequencing method (Fig. 5a). These data demonstrate the presence of the –862 SNP within our genomic sample. By resequencing, the frequency of this SNP within this pooled sample is 11% A with the remaining 89% C.
Fig. 5.
The discovery of an SNP in the TNF promoter region by two methods: resequencing (a) and photocleavage (b) with Rhchrysi. In a, the TNF promoter was sequenced by using a pooled genomic DNA sample. A portion of these sequencing data is shown highlighting a polymorphic site, demonstrating C allele frequency of 89% with a minor A allele frequency of 11%. In b, with our targeting assay, this SNP is readily detected by capillary electrophoresis. After photocleavage with 500 nM Rhchrysi at 442 nm for 10 min, the parent band, 377 bases in length, is cleaved and a new peak appears at 105 bases. This fragment length corresponds exactly with the location of the SNP detected by sequencing in a.
To apply our methodology, this same pooled DNA sample was amplified by using PCR primers designed to target the region of the SNP in the TNF promoter (see supporting information). After amplification, the DNA is treated under the same conditions as the plasmid-derived DNA (see above). After denaturating and annealing of the 382-bp-long PCR products, incubation with 500 nM Rhchrysi, photolysis, and fluorescent tagging, the samples are analyzed by capillary electrophoresis. As is evident in Fig. 5b, a peak appears with a length corresponding precisely to the location of the SNP. The contrast in ease of discovery of this SNP by using sequencing versus our SNP photocleavage methodology is noteworthy.
Discussion
Design of an SNP Detection Assay. Although many methods exist for the genotyping of known SNPs, alternatives to resequencing exist for the initial discovery of these SNPs (14). Resequencing is expensive in terms of materials, labor, and information processing (11, 12). A relatively large population must be sequenced throughout the genome, or alternatively every haplotype block and intervening hotspots, to create a high-density SNP map of the genome (3, 7). Sequence data from each individual, or pool, must be compared with all other individuals, or pools, to detect the presence of an SNP within that sequence. However, resequencing does have some advantages over our method. Specifically, resequencing gives a clear picture of the alleles present and their frequencies, albeit approximately, in addition to the SNPs location. Regardless of the method of initial SNP discovery, larger populations could be more economically genotyped after the initial localization of the SNP to give a clearer picture of SNP frequency and distribution within a larger and more diverse population.
In contrast to the resequencing method, our assay allows for low-frequency SNPs to be detected directly and unambiguously from a pooled sample, greatly reducing the costs for the localization of new SNPs. Specifically, fewer PCRs and no cycle sequencing is required. Additionally, information processing is greatly reduced as individual samples need not be compared to determine the presence of a SNP.
Sensitivity and Generality. We have demonstrated the sensitivity of our method to low-frequency SNPs. We have been able to detect and localize a synthetic SNP in a plasmid, where we have ultimate control over allele frequencies, when allele frequencies are as low as 5%. The sensitivity of this method is limited by the background levels. A significant contribution to the background is PCR pause sites.
Using a general mismatch recognition complex should, in theory, allow for any SNP to be detected. In practice, however, neither Rhchrysi nor Rhphzi are able to detect all mismatches. Both complexes recognize mismatches because of their local destabilization within the DNA duplex. Thus, in our assay, SNPs that lead to a stable mismatch are not detected. In general, this is not a significant problem, because in a statistical mixture, two different mismatches are formed from any SNP. One tends to be a particularly destabilized mismatch, whereas the other is much less so. For example, G/C SNP will produce both a stable GG mispair and a destabilized CC mispair. Although our complexes are not able to detect a GG mispair, the CC mispair is easily recognized and cleaved. Nonetheless, illustrated here is an alternate example where photocleavage is not observed. In the A/C heterozygote, neither mismatch generated is cleaved. The sequence surrounding the mismatch is 5′-AXA-3′/3′-TYT-5′. Here, photocleavage is not observed because of slippage and site stabilization. Therefore, specific photocleavage by the Rh intercalator does indeed provide an unambiguous determination of the presence of a SNP. However, the lack of reaction does not establish the absence of an SNP. This assay is then expected to yield the rapid discovery of SNPs across the genome without the complication of false positives.
Supplementary Material
Acknowledgments
This work was supported by National Institutes of Health Grant GM33309.
Abbreviations: SNP, single-nucleotide polymorphism; phzi, 3,4-benzo[a]phenazine quinone diimine; chrysi, 9,10-chrysene quinone diimine; phi, phenanthrenequinone diimine; TNF, tumor necrosis factor.
References
- 1.Erichsen, H. C. & Chanock, S. J. (2004) Br. J. Cancer 90, 747–751. [DOI] [PMC free article] [PubMed] [Google Scholar]
- 2.Vignal, A., Milan, D., SanCristobal, M. & Eggen, A. (2002) Genet. Sel. Evol. 34, 275–305. [DOI] [PMC free article] [PubMed] [Google Scholar]
- 3.Carlson, C. S., Eberle, M. A., Rieder, M. J., Smith, J. D., Kruglyak, L. & Nickerson, D. A. (2003) Nat. Genet. 33, 518–521. [DOI] [PubMed] [Google Scholar]
- 4.Cooper, D. M., Simth, B. A., Cooke, H. J., Niemann, A. & Schmidtke, J. (1985) Hum. Genet. 69, 201–205. [DOI] [PubMed] [Google Scholar]
- 5.Botstein, D. & Risch, N. (2003) Nat. Genet. 33, Suppl., 228–237. [DOI] [PubMed] [Google Scholar]
- 6.Kruglyak, L. & Nickerson, D. A. (2001) Nat. Genet. 27, 234–236. [DOI] [PubMed] [Google Scholar]
- 7.Kruglyak, L. (1999) Nat. Genet. 22, 139–144. [DOI] [PubMed] [Google Scholar]
- 8.Patil, N., Berno, A. J., Hinds, D. A., Barrett, W. A., Doshi, J. M., Hacker, C. R., Kautzer, C. R., Lee, D. H., Marjoribanks, C., McDonough, D. P., et al. (2001) Science 294, 1719–1723. [DOI] [PubMed] [Google Scholar]
- 9.Gabriel, S. B., Schaffner, S. F., Nguyen, H., Moore, J. M., Roy, J., Blumenstiel, B., Higgins, J., DeFelice, M., Lochner, A., Faggart, M., et al. (2002) Science 296, 2225–2229. [DOI] [PubMed] [Google Scholar]
- 10.Martin, A.-M., Athanasiadia, G., Greshock, J. D., Fisher, J., Lux, M. P., Calzone, K., Rebbeck, T. R. & Weber, B. L. (2003) Hum. Hered. 55, 171–178. [DOI] [PubMed] [Google Scholar]
- 11.Kwok, P.-Y., Deng, Q., Zakeri, H., Taylor, A. L. & Nickerson, D. A. (1996) Genomics 31, 123–126. [DOI] [PubMed] [Google Scholar]
- 12.Taillon-Miller, P., Piernot, E. E. & Kwok, P.-Y. (1999) Genome Res. 9, 499–505. [PMC free article] [PubMed] [Google Scholar]
- 13.Rieder, M. J., Tobe, V. T., Taylor, S. L. & Nickerson, D. A. (1998) Nucleic Acids Res. 26, 967–973. [DOI] [PMC free article] [PubMed] [Google Scholar]
- 14.Kwok, P.-Y. (2001) Annu. Rev. Genomics Hum. Genet. 2, 235–258. [DOI] [PubMed] [Google Scholar]
- 15.Jackson, B. A. & Barton, J. K. (1997) J. Am. Chem. Soc. 119, 12986–12987. [Google Scholar]
- 16.Junicke, H., Hart, J. R., Kisko, J., Glebov, O., Kirsch, I. R. & Barton, J. K. (2003) Proc. Natl. Acad. Sci. USA 100, 3737–3742. [DOI] [PMC free article] [PubMed] [Google Scholar]
- 17.Peyret, N., Seneviratne, A., Allawi, H. T. & SantaLucia, J., Jr. (1999) Biochemistry 38, 3468–3477. [DOI] [PubMed] [Google Scholar]
- 18.Kielkopf, C. L., Erkkila, K. E., Hudson, B. P., Barton, J. K. & Rees, D. C. (2000) Nat. Struct. Biol. 7, 117–121. [DOI] [PubMed] [Google Scholar]
- 19.Jackson, B. A. & Barton, J. K. (2000) Biochemistry 39, 6176–6182. [DOI] [PubMed] [Google Scholar]
- 20.Jackson, B. A., Alekseyev, V. Y. & Barton, J. K. (1999) Biochemistry 38, 4655–4662. [DOI] [PubMed] [Google Scholar]
- 21.Rosenblum, B. B., Lee, L. G., Spurgeon, S. L., Khan, S. H., Menchen, S. M., Heiner, C. R. & Chen, S. M. (1997) Nucleic Acids Res. 25, 4500–4504. [DOI] [PMC free article] [PubMed] [Google Scholar]
- 22.Pyle, A. M., Long, E. C. & Barton, J. K. (1989) J. Am. Chem. Soc. 111, 4520–4522. [Google Scholar]
- 23.Gotoh, O., Wada, A. & Yabuki, S. (1979) Biopolymers 18, 805–824. [DOI] [PubMed] [Google Scholar]
- 24.Wenz, H.-M., Robertson, J. M., Menchen, S., Oaks, F., Demorest, D. M., Scheibler, D., Rosenblum, B. B., Wike, C., Gilbert, D. A. & Efcavitch, J. W. (1998) Genome Res. 8, 69–80. [DOI] [PMC free article] [PubMed] [Google Scholar]
- 25.Baena, A., Leung, J. Y., Sullivan, A. D., Landires, I., Vasquez-Luna, N., Quinones-Berrocal, J., Fraser, P. A., Uko, G. P., Delgado, J. C., Clavijo, O. P., et al. (2002) Genes Immun. 3, 482–487. [DOI] [PubMed] [Google Scholar]
Associated Data
This section collects any data citations, data availability statements, or supplementary materials included in this article.


