

Summary
Objective
Interictal [18F]fluorodeoxyglucose–positron emission tomography (FDG‐PET) is used in the presurgical evaluation of patients with drug‐resistant focal epilepsy. We aimed at clarifying its relationships with ictal high‐frequency oscillations (iHFOs) shown to be a relevant marker of the seizure‐onset zone.
Methods
We studied the correlation between FDG‐PET and epileptogenicity maps in an unselected series of 37 successive patients having been explored with stereo‐electroencephalography (SEEG).
Results
At the group level, we found a significant correlation between iHFOs and FDG‐PET interictal hypometabolism only in cases of temporal lobe epilepsy. This correlation was found with HFOs, and the same comparison between FDG‐PET and ictal SEEG power of lower frequencies during the same epochs did not show the same significance.
Significance
This finding suggests that interictal FDG‐PET and ictal HFOs may share common underlying pathophysiologic mechanisms of ictogenesis in temporal lobe epilepsy, and combining both features may help to identify the seizure‐onset zone.
Keywords: FDG‐PET, SEEG, Epileptogenicity map, Ictal HFO, Focal epilepsy
Key Points.
A novel methodology is presented to compare ictal high‐frequency oscillations and interictal FDG‐PET
Ictal HFOs recorded by SEEG are more likely to occur in regions showing hypometabolism, in temporal lobe epilepsy only
Regions showing ictal oscillations at frequencies in the beta band and below do not show significant interictal hypometabolism
Interictal FDG‐PET hypometabolism and ictal HFOs may highlight common pathophysiologic mechanisms in temporal lobe epilepsy
Interictal [18F]fluorodeoxyglucose–positron emission tomography (FDG‐PET) is useful in the presurgical evaluation of patients with drug‐resistant focal epilepsy.1 Hypometabolism overlies the seizure‐onset zone (SOZ) with a sensitivity of 86–90% in temporal lobe epilepsy (TLE) and of 45–60% in extra‐TLE.2, 3, 4, 5 Although it is a tool that has proven to be clinically useful, there is as yet no pathophysiologic explanation for the hypometabolism found in epilepsy. Recent findings suggest that FDG‐PET is reliable for localizing type 2 focal cortical dysplasia (FCD),6, 7 a highly epileptogenic lesion; however, it is not known whether the metabolic anomalies detected by FDG‐PET result from the same pathophysiologic process as the electrical anomalies seen in epilepsy.8, 9 The goal of this study is to determine whether electrical findings at seizure onset and interictal metabolic patterns can improve understanding of the pathophysiology of focal epilepsy.
The epileptogenicity map, a statistical parametric three‐dimensional (3D) map quantifying high‐frequency oscillations (HFOs) at seizure onset, may help gain a better understanding of the relationship between FDG‐PET metabolic patterns and the electrical activity recorded by intracranial electrodes. This tool is based on ictal HFOs (iHFOs) which are recorded by stereo‐electroencephalography (SEEG) at seizure onset, indicating the areas of high epileptogenicity.10 The iHFOs are isolated and quantified by computerized analysis for each intracranial electrode. An epileptogenicity index is calculated for the voxels located near the intracerebral electrodes. This index represents the likelihood that a region has high epileptogenicity. It is shown as a color scale overlying the magnetic resonance imaging (MRI) of the patient's brain. The epileptogenicity map has good reproducibility and sensitivity11 and has proved to be helpful to better understand the epileptogenic brain networks subserving different kinds of focal seizures.12, 13, 14 The map allows for a precise quantitative analysis of the SEEG signals and a direct comparison with other imaging tools,12 such as FDG‐PET scans.
This study used the epileptogenicity maps to compare the intracranial EEG activity with the interictal metabolism derived from FDG‐PET. iHFOs were selected as the marker of epileptogenic electrical activity, and two bands of lower frequencies, 2–7 Hz and 8–20 Hz, were selected as controls. The frequencies of the iHFOs varied from patient to patient, as they were individually selected based on the interval of frequencies with the highest power during seizure onset. FDG‐PET metabolism was analyzed semiquantitatively with a voxel‐based approach, by comparing the levels of metabolism to that of each patient's cerebellum taken as a reference. The association found helps gain a better understanding of the pathophysiologic relationship between the electrical and metabolic changes in epilepsy. The goal of this study was to determine whether iHFOs, as a biomarker of epileptogenicity, and interictal hypometabolism are anatomically related using a method that allows for precise quantification of anatomic and physiologic data.
Methods
Patient information
Patients with intractable focal epilepsy followed at the Centre Hospitalier Universitaire de Grenoble‐Alpes (CHUGA), who required a high‐resolution MRI, video‐EEG monitoring, an FDG‐PET scan, and SEEG as part of their presurgical evaluation during the 2008–2012 period, were retrospectively selected for this study. Thirty‐seven patients were included in the study based on these criteria. Of these, 15 patients had TLE and 22 patients had extra‐TLE. This was determined from a combined analysis of the ictal clinical semiology, EEG, MRI, SEEG, and FDG‐PET. As summarized in Table 1, the group of TLE patients was atypical and nonhomogenous: nine patients had a mesial predominance of seizure onset (patients 1–9), four patients had a neocortical predominance (patients 10–13), and two patients were classified as “temporal plus” (patients 14–15). Fifteen patients were MRI positive and 22 patients were MRI negative for brain anomalies. Surgical resection was performed in 31 patients, and after a mean postoperative follow‐up of 18 months, seizure outcome as assessed by Engel's classification15 showed that 17 patients were in class I (55%), 5 in class II (16%), 4 in class III (13%), and 5 in class IV (16%).
Table 1.
Patients’ characteristics
| Patient | Age at SEEG | Sex | Epilepsy onset | Seizure frequency | MRI findings | FDG‐PET scan visual findings | Electrode placement | Surgery | Histology | Postoperative follow‐up | Outcomea |
|---|---|---|---|---|---|---|---|---|---|---|---|
| 1 | 52 | F | 6y | Monthly (2–3/m) | N | R T pole | 12 R + 2 L | R T anteromesial | FCD IA | >1y | IA |
| 2 | 32 | M | 13y | Monthly (3–4/m) | N | L T mesial | 11 L + 2 R | L T anteromesial | FCD IA | 5 m | IA |
| 3 | 41 | F | 22y | Weekly (5–6/m) | N | F T + F Basal | 11 L + 3 R | L T anteromesial | FCD IA | >2y | ID |
| 4 | 35 | M | 27y | Daily | R P mesial gliosis | R P posterosuperior + mesial | 15 R | R T anteromesial | Gliosis | >2y | II |
| 5 | 16 | F | 15y | Weekly (2/w) | N | L T basal + posterior area | 9 R + 6 L | R T anteromesial | HS | >2y | IA |
| 6 | 26 | F | 20y | Monthly (2/m) | N | L F basolateral > L T1 > L T pole | 14 L | L T anteromesial | Normal | >1y | IA |
| 7 | 32 | F | 29.5y | Weekly | N | R T anteromesial | 15 R | R T anteromesial | Not found | >2y | IA |
| 8 | 35 | F | 13y | Monthly | N | R T pole | 12 R | R T anteromesial | Nonspecific | >2y | III |
| 9 | 26 | F | 2y | Monthly | N | L T pole | 4R + 10 L | No surgery | NA | NA | NA |
| 10 | 38 | F | 8y | Daily | L posterior T‐basal hypersignal | L T mesial | 12 L | L T‐basal | FCD IA | 1y | III |
| 11 | 52 | M | 25y | Weekly (15–20/m) | L posterior T‐basal hypersignal | L T‐O (+ L hemispheric) | 14 L | L T basal | FCD IIIB | >1y | II |
| 12 | 18 | F | 10y | Monthly (3/m) | N | L T pole | 12D + 2G | L temporobasal | Nonspecific | >2y | IV |
| 13 | 40 | M | 28y | Weekly | L thalamic cyst | L T posteromesial | 6R + 10L | L basal temporal | FCD IA | >1y | II |
| 14 | 34 | M | 34y | Monthly | N | R F basal + orbitary + < hippocampal + F polar | 10 L | L T anteromesial | HS | >2y | IB |
| 15 | 22 | M | 6y | Monthly (2–3/m) | N | L temporal pole + mesial | 13 L | L temporal | Gliosis | >2y | IA |
| 16 | 23 | F | 9y | Monthly | N | L paracentral lobule | 15 L | L SMA | FCD IIA | >2y | IVB |
| 17 | 29 | M | 17y | Weekly | N | F bilateral | 10 R + 7 L | No surgery | NA | NA | NA |
| 18 | 35 | M | 31y | Weekly | N | L T pole + perisylvian | 12 R + 5 L | R anterior insula | FCD IIA | 8 m | IIB |
| 19 | 32 | M | 29y | Monthly | N | L T‐P (+ bilateral multifocal) | 16 R | R prefrontal | FCD IA | >1y | ID |
| 20 | 23 | F | 9y | Weekly | L thalamic stroke | Bilateral (L>R) hippocampus + T pole | 15 L | L postcingulate | Nonspecific | >2y | IA |
| 21 | 29 | M | 12y | Monthly | Bilateral F basal posttraumatic scar (R>L) | R F | 15 R + 3 L | R premotor + prefrontal | Gliosis | >1y | IA |
| 22 | 20 | M | 17y | Monthly | N | L T anteromesial + L precuneus | 12 L + 4 R | L ventral premotor | Nonspecific | 8 m | IV |
| 23 | 19 | F | 12y | Daily | N | R F premotor (F1 > F2) | 15 R | R F premotor | FCD IIB | >1y | IA |
| 24 | 15 | F | 4y | Daily | N | R F anteromesial | 14 R | R F mesial | Nonspecific | >2y | IA |
| 25 | 11 | F | 6.5y | Monthly (1/m) | L premotor FCD | L premotor | 16 L | L premotor | FCD IIA | 1y | ID |
| 26 | 17 | M | 5y | Monthly (1/m) | L mesial O FCD | R T pole + T‐O | 8 R + 8 L | L O mesial | FCD IA | >2y | IA |
| 27 | 31 | F | 21y | Monthly (1/m) | N | R F mesial > L P operculum | 14 R | R prefrontal | Nonspecific | >1y | III |
| 28 | 44 | M | 33y | Weekly (1/w) | L motor opercular FCD | L perirolandic > L F polar | 17 L | L motor operculum | FCD IA | >1y | IV |
| 29 | 22 | M | 9y | Daily | N | R T‐perisylvian | 14 R + 7 L | R posterior insula | FCD IB | >2y | IIB |
| 30 | 6 | M | 2y | Monthly | R dorsal premotor FCD | Inconclusive | 13 R | R dorsal premotor | FCD IIB | >2y | IA |
| 31 | 31 | F | 25.5y | Daily | L inferior occipital surgery | L O laterosuperior | 13 L + 3 R | L occipitotemporal | FCD IA | >2y | IV |
| 32 | 46 | M | 43y | Weekly | R HS | R T | 13 R | R F basal + F‐P operculum | FCD IIIA | >1y | III |
| 33 | 19 | M | 15y | Daily | N | Normal | 8R + 8L | No surgery | NA | NA | NA |
| 34 | 19 | F | 5y | Daily | N | L T anterior | 3R + 14 L | No surgery | NA | NA | NA |
| 35 | 21 | F | 14y | Monthly (3/m) | Hippocampal bilateral nodular heterotopy | R T posteromesial+ precuneus, thalamus | 13 R + 3 L | No surgery | NA | NA | NA |
| 36 | 26 | M | 10y | Daily | N | R T pole | 14 G | R temporooccipital | FCD IA | 8 m | IA |
| 37 | 22 | F | 10y | Weekly | L rolandic FCD | L F polar + F basal | 10 L | No surgery | NA | NA | NA |
a according to Engel's classification; y, year; m, month; w, week; N, negative; R, right; L, left; T, temporal; F, frontal; O, occipital; P, parietal; FCD, focal cortical dysplasia; HS, hippocampal sclerosis; Na, not applicable.
FDG‐PET study
Data acquisition
The FDG‐PET scans were acquired either at the Department of Nuclear Medicine of CHUGA or at the CERMEP facility (Lyon). Patients fasted for a minimum of 6 h prior to the scan. The scans were not performed if patients had a seizure within the last 12 h, which was determined by interviewing patients and/or caregivers. Female patients of reproductive age were evaluated to ensure that they were not pregnant. In supine and resting patients, a dose of FDG corresponding to approximately 1.85 MBq/kg was injected 30–40 min prior to performing the scan. During the scans, patients were instructed to lie still and were clinically monitored for seizure activity. Scanning lasted approximately 10 min. The PET scanners were a TEP‐CT GE Discovery 690 scanner (CHUGA) or a SIEMENS HR+ (CERMEP). The scans were acquired in 3D mode with an axial resolution of 2.73 mm from the center at the CHUGA and 4.1 mm from the center at the CERMEP. Data were reconstructed using a 3D ordered subset expectation maximization algorithm (OSEM‐3D; 2 iterations, 24 subsets, 6.4 mm filter at CHUGA) or a 3D backprojection of filtered projections algorithm (Hanning filter 0.5 mm, image 128*128 at CERMEP) with attenuation correction and time‐of‐flight. Voxel size was 1 mm and slice thickness was 3.27 mm (CHUGA) or 2.43 mm (CERMEP). The attending specialists performed 3D reorientation and visual analysis of the scans (summarized in Table 1).
Image processing
The images were processed using Statistical Parametric Mapping software (SPM12, Wellcome Department of Imaging Neuroscience, www.fil.ion.ucl.ac.uk/spm12). T1‐MRI and PET images were first co‐registered. Spatial normalization onto the SPM12 T1‐MRI brain template in the Montreal Neurological Institute (MNI) referential was computed from T1‐MRI and applied to all images. Only the voxels that were part of the gray matter were kept in the analysis of PET images by thresholding at 0.4 the mask image of gray matter (grey.nii) produced by SPM12 unified segmentation procedure.16 To reduce intersubject variance before performing group analysis, the voxel value of each patient's FDG‐PET scan was divided by the average level of metabolism measured in the cerebellum.17 Before doing so, an expert visually assessed all images to ensure no metabolic changes in the cerebellum. Because the cerebellum is generally hypometabolic in comparison with the rest of the brain, a value slightly >1 was given for each voxel. The image obtained was smoothed using a 3D isotropic Gaussian kernel of 3 mm in width.
SEEG investigation
Electrode implantation and position
Patients were implanted with 10–21 electrodes (Dixi Medical, Besançon, France; diameter: 0.8 mm; 10–18 contacts, 2 mm long, and 1.5 mm apart) in stereotactic condition in regions that could correspond to the seizure‐onset zone (SOZ) based on previous investigations. Determination of the anatomic volume of the electrical activity recorded was done by interpolation of the values over a 5 mm radius of each electrode contact and a subsequent 3D linear interpolation for each voxel up to 10 mm away from the electrode contact. Electrode position was determined with a postimplantation T1‐weighted MRI co‐registered with the preimplantation MRI. The images were normalized using SPM12 software on the MNI (McGill University, Canada) referential.
SEEG recordings
Intracerebral recordings were conducted extraoperatively using an audio‐video‐EEG monitoring system (Micromed, Treviso, Italy) that allowed recording simultaneously up to 128 contacts, with a sampling rate of 512 Hz, and an acquisition band‐pass filter between 0.1 and 200 Hz. SEEG activity was considered between contiguous contacts at different levels along the axis of each electrode, and analysis of video‐SEEG traces was done visually to identify seizure‐onset times.
Epileptogenicity mapping
Electrical activity during and between seizures was recorded and analyzed using epileptogenicity mapping.11 The aim of the epileptogenicity mapping was to isolate the regions likely to produce iHFOs, which in this population generally remained around 80–140 Hz. The methodology was fully detailed in Ref. 11, and herein we present the main steps. A baseline void of any epileptic activity and of any artifact of at least 20 s was chosen within the 5 min preceding the seizure. The seizure onset of 4 s duration was isolated visually for all seizures recorded for each patient. This epoch of 4 s was determined by taking into account the timing of the clinical onset of the seizure, which was noted following revision of the video recording of the patients having the seizure, and the visual change of SEEG activity. Various patterns helped define the seizure‐onset zone: (1) low‐voltage fast activity over 20 Hz; (2) recruiting fast discharge (around 10 Hz or more) of spikes or polyspikes; and (3) rhythmic activity (around 10 Hz) of low amplitude.11 The placement of the seizure‐onset period did not take into account isolated or repetitive spikes at lower frequencies that might have preceded or started with few seizures in this group of patients, because this pattern could occur interictally without giving rise to any electroclinical seizures. For three patients, the duration of the onset period was reduced to 3 s because seizures were shorter. Figure 1 shows an example of seizure onsets, as visually defined by simultaneous inspection of all recorded channels.
Figure 1.

Examples of single bipolar SEEG recordings in 10 patients (left: TLE; right: extra‐TLE) showing the diversity of seizure‐onset dynamics (time = 0 s). Visual definition of seizure onset was based on the careful inspection of all SEEG channels simultaneously (not shown here) and the presence of fast oscillations and/or repetitive spikes followed or concomitant to fast activity.
The SEEG signals of each seizure were transformed into the time‐frequency space that was relevant to the patient's epilepsy, that is, −20 to 10 s and 1–130 Hz where time origin is seizure onset. The band of interest in high frequencies was selected based on visual analysis of power transforms. It varied from patient to patient (average, 81–139 Hz; lowest, 30–60 Hz; highest, 160–210 Hz). A log transform was applied to obtain data distribution that better resembled normal distribution, and images of ictal power were produced using local spatial projection of SEEG values on patient's cortical surface and smoothing with an isotropic Gaussian kernel of 3 mm in width. Statistical analysis was then performed in SPM12 via a standard two‐sample t‐test on the images, which determined the epileptogenicity index by comparing the seizure and baseline values. When several seizures were available for the same patient, the map of epileptogenicity was computed for the group of seizures in order to retain for further correlation with PET data only the ictal SEEG changes that were reproducible between seizures. 11
The same spectral analysis was systematically performed in the 2–7 Hz and 8–20 Hz bands, situated below the band of quantifying epileptogenicity in all patients. The goal of this second analysis was to confirm the specificity of the correlation between fast activity and hypometabolism, as opposed to a correlation that could be present with any type of recorded electrical activity.
Measure of SEEG/FDG‐PET correlation
The correlation analysis between SEEG ictal power and FDG‐PET was performed on a region of interest (ROI) basis. We used the MNI‐based canonical Destrieux parcellation to define 76 ROIs per hemisphere.18 In each ROI, only voxels in the gray matter and containing SEEG power values were considered. In other words, we ignored voxels for which both types of information were not available and did not try to predict the whole PET image from spatially limited SEEG recordings. For voxels sampled by SEEG, the average value of PET values (normalized by cerebellum activity, see FDG‐PET study) and epileptogenicity values in the different frequency bands (see SEEG investigation) were computed. For each patient, the SEEG/FDG‐PET correlation was computed using the Pearson cross‐correlation value of both features averaged in each ROI explored by SEEG electrodes. This approach does not quantify the SEEG/FDG‐PET correlation of the SOZ only, but operates at the level of the whole implanted network. This means that it might suffer from a lack of sensitivity for very focal epilepsies, or if the true ictal onset was missed, but is well adapted to also capture the effects in regions of propagation. According to the hypothesis that PET hypometabolism is correlated with epileptogenic regions, we anticipated finding a significantly negative SEEG/FDG‐PET correlation in high frequencies.
Results
In this section, first we report the detailed analysis of a single case in order to show how the correlation between SEEG and FDG‐PET is processed. Second we proceed to the group analysis of the SEEG/FDG‐PET correlation.
Case study
Patient 14 (Table 1), a 26‐year‐old, right‐handed female graduate student, started having seizures at the age of 20 years. Her familial and personal history was irrelevant. Seizures proved drug‐resistant from the onset, and occurred in cluster of 1 or 2 days, with seizure‐free intervals of 2–3 weeks. Seizure symptomatology was characterized by an initial loss of contact (no signal symptom), immobility for 30–60 s, short postictal confusion with a few word finding difficulties, and complete amnesia of the episode. Neurologic examination was normal, and neuropsychological evaluation revealed some working memory dysfunctions. Repeated high‐resolution MRI studies did not reveal any abnormalities. A careful visual analysis of FDG‐PET revealed hypometabolism of the left anterior temporal lobe (Fig. 3A). Functional MRI demonstrated a left predominance for language. During video‐EEG monitoring, interictal spikes were recorded over the left temporal lobe, whereas ictal activity appeared more extended, involving from the onset a large frontal‐centrotemporal area. Based on this information, a left temporoperisylvian SEEG study was judged necessary and 14 intracerebral electrodes were implanted to record activity of the temporal lobe, anterior cingulate gyrus and orbitofrontal cortex, and anterior insula and temporoparietal junction (Fig. 2C). Six stereotyped seizures were recorded, showing an initial involvement of the temporobasal cortex (T4) and mesiotemporal lobe structures (amygdala, hippocampus, and hippocampal gyrus) (Fig. 2A), with a secondary spread to the temporal neocortex, insula, and frontobasal cortex. Time‐frequency analysis of power on all seizures showed early high‐frequency oscillations up to 160 Hz in the temporobasal cortex followed by more diffuse, slower, and longer oscillations (Fig. 2B). The epileptogenicity analysis performed at between 80 and 160 Hz and during the first 4 s of seizures revealed a network involving mesiotemporal structures and temporobasal neocortex (Fig. 2D). An anteromesial temporal resection (from the temporal pole up to the posterior hippocampus) was performed, and the patient has remained seizure‐free for 44 months, with a mild verbal memory deficit. Pathologic examination showed only signs of nonspecific gliosis.
Figure 3.
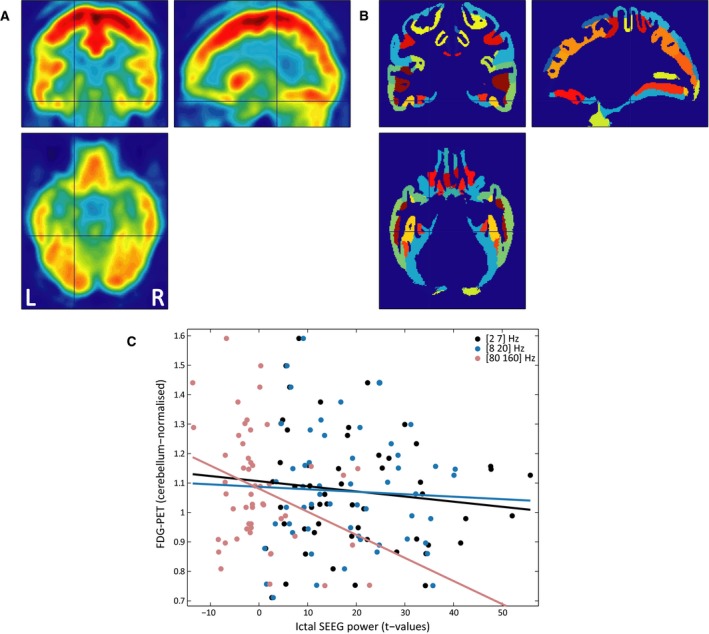
ROI‐based correlation of FDG‐PET and ictal SEEG power in patient 14 (see Table 1). (A) FDG‐PET map normalized in the MNI space, showing hypometabolism in the left anterior temporal lobe. L, left; R, right. (B) ROI of the Destrieux atlas in the MNI space. (C) ROI‐based correlation of FDG‐PET and ictal SEEG power in different frequency bands. Each dot represents for each ROI the values of ictal SEEG power (t‐value of the comparison of ictal vs. baseline period) and cerebellum‐normalized FDG‐PET. The lines show the linear regression on the data distribution for each frequency band (significance of correlation: p2–7 = 0.3738; p8–20 = 0.7324; and p80–160 = 0.0263).
Figure 2.

Epileptogenicity mapping of patient 14 (see Table 1). (A) Bipolar SEEG recordings of a seizure in (1) amygdala, (2) anterior parahippocampal gyrus, (3) posterolateral temporal gyrus (T3), (4) anterior hippocampus, and (5) posterior hippocampus. (B) Time‐frequency transform of SEEG power of the signals shown in (A). (C) Positions of electrodes in patient's MRI mesh of cortical surface. Numbers indicate locations of electrodes with signals shown in (A–B). (D) Epileptogenicity map in 80–160 Hz frequency band. L, left; R, right.
Using parcellation of Destrieux's atlas (Fig. 3B), we could compute the correlation between PET and SEEG data (Fig. 3C), which revealed a significant negative cross‐correlation only in the 80–160 Hz frequency band (cc2–7 = −0.1223, p2–7 = 0.3738; cc8–20 = −0.0472, p8–20 = 0.7324; cc80–160 = −0.3081, p80–160 = 0.0263). The negative value of the correlation indicates that regions showing iHFOs showed a tendency for interictal hypometabolism in this patient.
Group study of SEEG/FDG‐PET correlation
On the 37 patients, a total of 115 seizures were processed (from 1 to 10 seizures/patient, on average: 3.1). The frequency band of iHFOs was on average 81–139 Hz (lowest, 30–60 Hz; highest, 160–210 Hz). In the present group analysis, the outcome of visual analysis of FDG‐PET data and of SEEG data was ignored. We considered only the ROI‐based Pearson correlation coefficient of FDG‐PET and ictal SEEG power in different frequency bands, as shown in Figure 2C. At the group level (Fig. 4), a significant association was found between the ROIs showing HFOs and FDG‐PET hypometabolism (Mann‐Whitney U test, p2–7 = 0.5214; p8–20 = 0.1818; and p81–139 = 0.0021).
Figure 4.

ROI‐based correlation of FDG‐PET and ictal SEEG power for each patient (see Table 1) in the different frequency bands.
Figure 4 suggested that the SEEG/FDG‐PET correlation was more pronounced in patients with TLE (patient 1–15, as could have been anticipated from current knowledge on the overlap of the FDG‐PET hypometabolism and the SOZ2, 3, 4, 5). Therefore, we performed the same analysis but separated TLE patients from extra‐TLE patients. Of interest, we found a much higher correlation between SEEG and FDG‐PET hypometabolism in patients with TLE (p2–7 = 0.0554; p8–20 = 0.0353; p81–139 = 0.0020; after Bonferroni correction, only significant in high frequency band at 0.05 significance level) than in patients with extra‐TLE (p2–7 = 0.2491; p8–20 = 0.3896; p81–139 = 0.2360). This effect could not be explained by the choice of the frequency band of HFOs, as no significant difference was found on the mean of the frequency band of interest between the two groups (fTLE = 105 Hz, fextraTLE = 112 Hz, p = 0.4557, Mann‐Whitney U test), or by the number of seizures per month (nTLE = 7.8 seizures/month, nextraTLE = 11.3 seizures/month, p = 0.8739, Mann‐Whitney U test).
Finally, we checked whether the presence of a focal cortical dysplasia (18/37 patients with confirmed FCD, see Table 1) significantly changed the SEEG/FDG‐PET correlation. The similar results between FCD and No FCD cases (FCD: p2–7 = 0.9133, p8–20 = 0.6475; and p81–139 = 0.0429; No FCD: p2–7 = 0.4688, p8–20 = 0.0329, andp81–139 = 0.0196; SEEG/FDG‐PET was correlation significant only in high frequency, after Bonferroni correction) indicated that the presence of an FCD was not discriminant for the SEEG/FDG‐PET correlation.
Discussion
This study aimed to compare the presence of HFOs at seizure onset, recorded in implanted epilepsy patients, with the interictal patterns of metabolism for each patient. We showed that hypometabolic regions correlate with the presence of iHFOs, in TLE only. This was a consistent finding in a heterogeneous group of patients with focal intractable epileptic seizures, whereas most previous studies using FDG‐PET have been performed in selected patient groups with TLE. The value of FDG‐PET in extra‐TLE has been demonstrated, which warranted studies on the pathophysiology including multiple types of partial epilepsy.2, 3 We demonstrated that this correlation in TLE seems specific to iHFOs (>60 Hz), as no correlation was found when frequencies of 2–7 Hz and 8–20 Hz were selected.
Comparison with other studies
Few studies have considered the relationship between the electrical activity during seizures and the metabolic abnormalities in patients with epilepsy. However, this is not a new research question, as Engel et al.19 studied the relation between FDG‐PET, scalp‐sphenoidal EEG, and intracranial EEG in patients with epilepsy and found a correlation between the electrical and metabolic findings using a qualitative analysis. Lucignani et al.20 studied the correlation of FDG‐PET and SEEG with quantitative analysis of the FDG‐PET in partial epilepsy. This study found normal metabolic rates in the majority of the areas with abnormal SEEG activity. In the study of Lucignani et al.,20 16 ROIs for the FDG‐PET were manually drawn for each patient throughout the brain, and the FDG‐PET was analyzed by averaging the glucose uptake values in the 2–4 ROIs around each electrode. There have been improvements in the analysis of SEEG data since this study was published, and epileptogenicity mapping now allows us to use a quantitative approach to the analysis of the SEEG, by identifying iHFOs. Furthermore, MRI postimplantation of the electrodes allows for precise localization of each electrode and a comparison of the metabolic and electrical findings for each individual voxel, rather than an average of the glucose uptake of multiple larger ROIs around the intracranial electrodes.
Methodologic considerations
Two specific methodologic considerations must be kept in mind. First, this study was limited by the small spatial sampling of the SEEG, as already pointed out when correlating PET with SEEG data.21 Ideally, full sampling of the electrical discharges in the brain at seizure onset would help reach a better understanding of the exact correlation of the hypometabolic foci and the epileptogenic zone. SEEG was still the best method to assess electrical activity, as it recorded neuronal electrical activity with the highest precision.1 Second, although the presence of hypometabolism correlated with iHFOs, it cannot be excluded that it might correlate with other electrical signals. This has been explored in previous studies.20, 22 Gnatkovsky et al.22 have identified three biomarkers from SEEG data that correlate with the EZ: the fast activity at 80–120 Hz, the slow polarizing shift, and the flattening of background activity. Neither the slow polarizing shift nor the flattening of background activity was selected in this study. The relationship between SEEG recorded interictal spikes and FDG‐PET is also of interest but was not investigated. Furthermore, the HFOs are classically defined including frequencies up to 500 Hz,23 which were not selected in this study because the band of interest was selected based on the activity showing the highest power during the seizure onset, which remained at around 80–140 Hz. This does not exclude the possibility of studying higher frequencies in future studies. The method described earlier was replicable with other types of electrical activity. A better characterization of the specificity of the association between metabolism and other types of electrical activity associated with the epileptogenic zone might be helpful in future studies.
Pathophysiologic implications
The presence of a correlation between interictal hypometabolism and iHFOs is not surprising, given previous studies that have demonstrated their individual relationship with epileptogenesis. Of interest, we found that this correlation was present in TLE only. This effect could not be explained by a difference in the frequency band of interest, which on average was the same between the two groups. We could also speculate that this better correlation in TLE is supported by a better spatial sampling by SEEG electrodes of TLE, and that in general it is more likely to miss the true ictal onset in extra‐TLE. However, this fact is not supported by the data of this series, as the ratio of operated patients with an Engel's score of I was equivalent between the two groups (TLE: 11/20, 55%; extra‐TLE: 6/11, 54.5%). Because the size of perilesional FDG‐PET abnormalities was shown to correlate with the lifetime number of seizures,24 we also investigated whether the number of seizures per month was different between the two groups: Although the seizure frequency was higher in extra‐TLE, the difference with TLE was not found to be statistically significant in this series. Finally, we may interpret the observed difference on SEEG/FDG‐PET correlation between TLE and extra‐TLE as a relative lack of specificity for seizure‐onset zone of FDG‐PET in extra‐TLE.25 Of interest, recent data in the literature indicate a good co‐localization of FDG‐PET with interictal epileptiform activity in extra‐TLE.26 To go further, one may thus question the co‐localization of ictal HFO and interictal spikes in extra‐TLE.
The relationship between iHFOs and epileptogenesis is well‐established.27, 28 Jirsch et al.23 have shown the presence of iHFOs at seizure onset in a cohort of unselected patients with focal epilepsy occurring mostly in regions of primary epileptogenesis. A meta‐analysis of 11 studies showed that the extent of resection of iHFO‐generating areas, including both ripples and fast ripples, correlates with postsurgical outcome.29 Other studies indicate a possible role for hypometabolism in epileptogenicity. It is known that hypometabolic foci tend to be larger than the SOZ, and some studies have shown that, in fact, the extent of resection of the tissue that displays hypometabolism on FDG‐PET in temporal lobectomy correlated with surgical outcome.30 Furthermore, extratemporal hypometabolism in temporal lobe epilepsy was found to be associated with a poorer surgical outcome,31, 32, 33 and the extent of remote hypometabolism has a negative correlation with surgical outcome.34 These studies, along with our results, may indicate that the hypometabolic foci seen in partial epilepsies are a result of a pathologic process involved in seizure initiation and not just seizure propagation.9
This study could not determine a causal relationship between hypometabolism and iHFOs, but it could demonstrate an association specific to TLE. We can only speculate on the mechanisms that could drive a change in metabolism and neuronal networks. The presence of hypometabolism could be a characteristic of the neuronal assemblies generating iHFOs or a sign of injury to surrounding neurons resulting from this process. There is mounting evidence that neurons generating iHFOs in the gamma range undergo significant metabolic changes in order to maintain high activity.35, 36 The glucose uptake of these neurons generating excessive iHFOs could be reduced in interictal state, explaining the correlation between iHFOs and interictal hypometabolism. More research on the metabolic alterations resulting from an excessive generation of iHFOs may offer an explanation on the relationship between iHFOs and interictal hypometabolism.
Conclusion
Overall, this study has shown the need to continue efforts to explain the pathogenesis of hypometabolic foci in patients with intractable epilepsy, as these are related to iHFOs and may help elucidate the pathogenesis of metabolic and electrical changes in epilepsy. This association was found in various forms of TLE from a heterogeneous group of patients, with different types of epilepsy, in complex cases requiring aa SEEG, and including a large portion (22/37) of patients with normal MRI. This suggests that this association may be a core element in the pathogenesis of TLE. Finally, the results demonstrate that FDG‐PET should not be viewed only as a presurgical clinical diagnostic tool, but also as a tool to improve our understanding of the pathogenesis of epilepsy.
Disclosure
None of the authors has any conflict of interest to disclose. We confirm that we have read the Journal's position on issues involved in ethical publication and affirm that this report is consistent with those guidelines.
Acknowledgments
The research leading to these results has received funding from the European Research Council under the European Union's Seventh Framework Programme (FP/2007‐2013)/ERC Grant Agreement n. 616268 F‐TRACT. This work was also funded by a Grenoble‐Alpes University Hospital grant (DRCI 1325, EPISTIM study) and Agence Nationale pour la Recherche (project FORCE ANR‐2013‐TECS‐0013‐01).
Biography
Florence Lamarche is a third‐year medical student at McGill University and has previously completed a bachelor's degree in biology.

References
- 1. Rosenow F, Lüders H. Presurgical evaluation of epilepsy. Brain 2001;124:1683–1700. [DOI] [PubMed] [Google Scholar]
- 2. Swartz BE, Halgren E, Delgado‐Escueta AV, et al. Neuroimaging in patients with seizures of probable frontal lobe origin. Epilepsia 1989;30:547–558. [DOI] [PubMed] [Google Scholar]
- 3. Henry TR, Sutherling WW, Engel J, et al. Interictal cerebral metabolism in partial epilepsies of neocortical origin. Epilepsy Res 1991;10:174–182. [DOI] [PubMed] [Google Scholar]
- 4. Drzezga A, Arnold S, Minoshima S, et al. 18F‐FDG PET studies in patients with extratemporal and temporal epilepsy: evaluation of an observer‐independent analysis. J Nucl Med 1999;40:737–746. [PubMed] [Google Scholar]
- 5. Sarikaya I. PET studies in epilepsy. Am J Nucl Med Mol Imaging 2015;5:416–430. [PMC free article] [PubMed] [Google Scholar]
- 6. Chassoux F, Rodrigo S, Semah F, et al. FDG‐PET improves surgical outcome in negative MRI Taylor‐type focal cortical dysplasias. Neurology 2010;75:2168–2175. [DOI] [PubMed] [Google Scholar]
- 7. Chassoux F, Landré E, Mellerio C, et al. Type II focal cortical dysplasia: electroclinical phenotype and surgical outcome related to imaging. Epilepsia 2012;53:349–358. [DOI] [PubMed] [Google Scholar]
- 8. Chassoux F. Metabolic changes and electro‐clinical patterns in mesio‐temporal lobe epilepsy: a correlative study. Brain 2004;127:164–174. [DOI] [PubMed] [Google Scholar]
- 9. Guedj E, Bonini F, Gavaret M, et al. 18FDG‐PET in different subtypes of temporal lobe epilepsy: SEEG validation and predictive value. Epilepsia 2015;56:414–421. [DOI] [PubMed] [Google Scholar]
- 10. Bartolomei F, Chauvel P, Wendling F. Epileptogenicity of brain structures in human temporal lobe epilepsy: a quantified study from intracerebral EEG. Brain 2008;131:1818–1830. [DOI] [PubMed] [Google Scholar]
- 11. David O, Blauwblomme T, Job A‐S, et al. Imaging the seizure onset zone with stereo‐electroencephalography. Brain 2011;134:2898–2911. [DOI] [PubMed] [Google Scholar]
- 12. Blauwblomme T, Kahane P, Minotti L, et al. Multimodal imaging reveals the role of γ activity in eating‐reflex seizures. J Neurol Neurosurg Psychiatr 2011;82:1171–1173. [DOI] [PMC free article] [PubMed] [Google Scholar]
- 13. Blauwblomme T, David O, Minotti L, et al. Prognostic value of insular lobe involvement in temporal lobe epilepsy: a stereoelectroencephalographic study. Epilepsia 2013;54:1658–1667. [DOI] [PubMed] [Google Scholar]
- 14. Job A‐S, De Palma L, Principe A, et al. The pivotal role of the supplementary motor area in startle epilepsy as demonstrated by SEEG epileptogenicity maps. Epilepsia 2014;55:e85–e88. [DOI] [PubMed] [Google Scholar]
- 15. Engel J Jr, Van Ness PC, Rasmussen TB, Ojemann LM. Outcome with respect to epileptic seizures In Engel J., Jr (Ed) Surgical Treatment of the Epilepsies. New York: Raven Press; 1993:609–621. [Google Scholar]
- 16. Ashburner J, Friston KJ. Unified segmentation. NeuroImage 2005;26:839–851. [DOI] [PubMed] [Google Scholar]
- 17. Blum DE, Ehsan T, Dungan D, et al. Bilateral temporal hypometabolism in epilepsy. Epilepsia 1998;39:651–659. [DOI] [PubMed] [Google Scholar]
- 18. Destrieux C, Fischl B, Dale A, et al. Automatic parcellation of human cortical gyri and sulci using standard anatomical nomenclature. NeuroImage 2010;53:1–15. [DOI] [PMC free article] [PubMed] [Google Scholar]
- 19. Engel JJ, Henry TR, Risinger MW, et al. Presurgical evaluation for partial epilepsy: relative contributions of chronic depth‐electrode recordings versus FDG‐PET and scalp‐sphenoidal ictal EEG. Neurology 1990;40:1670–1677. [DOI] [PubMed] [Google Scholar]
- 20. Lucignani G, Tassi L, Fazio F, et al. Double‐blind stereo‐EEG and FDG PET study in severe partial epilepsies: are the electric and metabolic findings related? Eur J Nucl Med 1996;23:1498–1507. [DOI] [PubMed] [Google Scholar]
- 21. Kahane P, Merlet I, Grégoire MC, et al. An H(2) (15)O‐PET study of cerebral blood flow changes during focal epileptic discharges induced by intracerebral electrical stimulation. Brain 1999;122:1851–1865. [DOI] [PubMed] [Google Scholar]
- 22. Gnatkovsky V, de Curtis M, Pastori C, et al. Biomarkers of epileptogenic zone defined by quantified stereo‐EEG analysis. Epilepsia 2014;55:296–305. [DOI] [PubMed] [Google Scholar]
- 23. Jirsch JD, Urrestarazu E, LeVan P, et al. High‐frequency oscillations during human focal seizures. Brain 2006;129:1593–1608. [DOI] [PubMed] [Google Scholar]
- 24. Juhász C, Chugani DC, Muzik O, et al. Electroclinical correlates of flumazenil and fluorodeoxyglucose PET abnormalities in lesional epilepsy. Neurology 2000;55:825–835. [DOI] [PubMed] [Google Scholar]
- 25. Muzik O, da Silva EA, Juhász C, et al. Intracranial EEG versus flumazenil and glucose PET in children with extratemporal lobe epilepsy. Neurology 2000;54:171–179. [DOI] [PubMed] [Google Scholar]
- 26. Donaire A, Capdevila A, Carreño M, et al. Identifying the cortical substrates of interictal epileptiform activity in patients with extratemporal epilepsy: an EEG‐fMRI sequential analysis and FDG‐PET study. Epilepsia 2013;54:678–690. [DOI] [PubMed] [Google Scholar]
- 27. Rampp S, Stefan H. Fast activity as a surrogate marker of epileptic network function? Clin Neurophysiol 2006;117:2111–2117. [DOI] [PubMed] [Google Scholar]
- 28. Staba RJ, Bragin A. High‐frequency oscillations and other electrophysiological biomarkers of epilepsy: underlying mechanisms. Biomark Med 2011;5:545–556. [DOI] [PMC free article] [PubMed] [Google Scholar]
- 29. Höller Y, Kutil R, Klaffenböck L, et al. High‐frequency oscillations in epilepsy and surgical outcome. A meta‐analysis. Front Hum Neurosci 2015;9:574. [DOI] [PMC free article] [PubMed] [Google Scholar]
- 30. Vinton AB, Carne R, Hicks RJ, et al. The extent of resection of FDG‐PET hypometabolism relates to outcome of temporal lobectomy. Brain 2007;130:548–560. [DOI] [PubMed] [Google Scholar]
- 31. Swartz BE, Tomiyasu U, Delgado‐Escueta AV, et al. Neuroimaging in temporal lobe epilepsy: test sensitivity and relationships to pathology and postoperative outcome. Epilepsia 1992;33:624–634. [DOI] [PubMed] [Google Scholar]
- 32. Manno EM, Sperling MR, Ding X, et al. Predictors of outcome after anterior temporal lobectomy: positron emission tomography. Neurology 1994;44:2331–2336. [DOI] [PubMed] [Google Scholar]
- 33. Choi JY, Kim SJ, Hong SB, et al. Extratemporal hypometabolism on FDG PET in temporal lobe epilepsy as a predictor of seizure outcome after temporal lobectomy. Eur J Nucl Med Mol Imaging 2003;30:581–587. [DOI] [PubMed] [Google Scholar]
- 34. Wong CH, Bleasel A, Wen L, et al. The topography and significance of extratemporal hypometabolism in refractory mesial temporal lobe epilepsy examined by FDG‐PET. Epilepsia 2010;51:1365–1373. [DOI] [PubMed] [Google Scholar]
- 35. Kann O, Hollnagel J‐O, Elzoheiry S, et al. Energy and potassium ion homeostasis during gamma oscillations. Front Mol Neurosci 2016;9:47. [DOI] [PMC free article] [PubMed] [Google Scholar]
- 36. Kann O. The interneuron energy hypothesis: implications for brain disease. Neurobiol Dis 2016;90:75–85. [DOI] [PubMed] [Google Scholar]