

Abstract
Neurons in the lateral habenula (LHb) are transiently activated by aversive events and have been implicated in associative learning. Functional changes associated with tonic and phasic activation of the LHb are often attributed to a corresponding inhibition of midbrain dopamine (DA) neurons. Activation of GABAergic neurons in the rostromedial tegmental nucleus (RMTg), a region that receives dense projections from the LHb and projects strongly to midbrain monoaminergic nuclei, is believed to underlie the transient inhibition of DA neurons attributed to activation of the LHb. To test this premise, the effects of axon-sparing lesions of the RMTg were assessed on LHb-induced inhibition of midbrain DA cell firing in anesthetized rats. Quinolinic acid lesions decreased the number of NeuN-positive neurons in the RMTg significantly while largely sparing cells in neighboring regions. Lesions of the RMTg reduced both the number of DA neurons inhibited by, and the duration of inhibition resulting from, LHb stimulation. Although the firing rate was not altered, the regularity of DA cell firing was increased in RMTg-lesioned rats. Locomotor activity in an open field was also elevated. These results are the first to show that RMTg neurons contribute directly to LHb-induced inhibition of DA cell activity and support the widely held proposition that GABAergic neurons in the mesopontine tegmentum are an important component of a pathway that enables midbrain DA neurons to encode the negative valence associated with failed expectations and aversive stimuli.
SIGNIFICANCE STATEMENT Phasic changes in the activity of midbrain dopamine cells motivate and guide future behavior. Activation of the lateral habenula by aversive events inhibits dopamine neurons transiently, providing a neurobiological representation of learning models that incorporate negative reward prediction errors. Anatomical evidence suggests that this inhibition occurs via the rostromedial tegmental nucleus, but this hypothesis has yet to be tested directly. Here, we show that axon-sparing lesions of the rostromedial tegmentum attenuate habenula-induced inhibition of dopamine neurons significantly. These data support a substantial role for the rostromedial tegmentum in habenula-induced feedforward inhibition of dopamine neurons.
Keywords: firing pattern, prediction error, RMTg, salience, tVTA
Introduction
Motivationally salient stimuli, including appetitive and aversive events, elicit transient changes in the spontaneous activity of midbrain dopamine (DA) neurons that serve as a teaching signal to optimize action selection (Schultz et al., 1997; Steinberg et al., 2013; Hart et al., 2014; Chang et al., 2016). Positive prediction errors, encoded by phasic increases in DA cell activity, occur in response to unexpected rewards or neutral stimuli that, through training, acquire salience as a predictive cue (Ljungberg et al., 1992; Bayer and Glimcher, 2005; Pan et al., 2005; Roesch et al., 2007). Conversely, negative reward prediction errors, signaling the unexpected loss of a predicted reward (Schultz et al., 1997; Roesch et al., 2007) or a frankly aversive event (Mirenowicz and Schultz, 1996; Ungless et al., 2004), are associated with a transient cessation in DA cell activity. The role of DA neurons in encoding reward salience, valence, and magnitude have important implications for clinical syndromes such as substance abuse, depression, schizophrenia, and Parkinson's disease (Lammel et al., 2014; Napier et al., 2015).
The specific pathways conveying changes in an animal's sensorium to the ventral midbrain are incompletely understood. Although several excitatory projections have been implicated in mediating phasic increases in DA cell activity (Pan and Hyland, 2005; Lammel et al., 2012), the lateral habenula (LHb) appears to be the principal component of a circuit mediating phasic decreases that underlie negative prediction errors. LHb neurons, which are activated transiently by reward omission (Salas et al., 2010; Bromberg-Martin and Hikosaka, 2011) or strongly aversive stimuli (Benabid and Jeaugey, 1989; Dong et al., 1992; Gao et al., 1996) exert a powerful and widespread inhibitory influence on the activity of DA neurons in the substantia nigra pars compacta (SNc) and ventral tegmental area (VTA) (Christoph et al., 1986; Gao et al., 1990; Ji and Shepard, 2007; Matsumoto and Hikosaka, 2007). However, because the LHb is composed predominantly of glutamatergic projection neurons (Geisler et al., 2003; Brinschwitz et al., 2010) and LHb-induced inhibition of DA neurons is GABAA receptor dependent (Ji and Shepard, 2007), an intervening source of inhibitory input is implied.
The GABAergic rostromedial tegmental nucleus (RMTg) is well positioned anatomically to mediate the inhibitory effects of LHb stimulation on midbrain DA cell activity. RMTg neurons are heavily innervated by LHb efferents (Jhou et al., 2009a, 2009b; Kaufling et al., 2009; Yetnikoff et al., 2015), rapidly activated by LHb stimulation (Hong et al., 2011; Lecca et al., 2011), and project to both the VTA and SNc where they synapse preferentially on DA neurons (Balcita-Pedicino et al., 2011). Like the LHb, RMTg neurons are activated by aversive stimuli (Jhou et al., 2009a; Sánchez-Catalán et al., 2016) and stimulation of LHb terminals within the RMTg promotes behavioral avoidance (Stamatakis and Stuber, 2012). Furthermore, direct stimulation of the RMTg inhibits both VTA and SNc DA neurons rapidly and transiently (Hong et al., 2011; Bourdy et al., 2014) and, when RMTg stimulation coincides with reward delivery, biases subjects toward future selection of an alternative reward (Stopper et al., 2014). Although it is commonly assumed that LHb-induced inhibition of DA neuron firing occurs via the RMTg, this assumption has yet to be tested directly. In the present study, we compared the response of midbrain DA neurons to electrical stimulation of the LHb in anesthetized rats with and without excitotoxic, axon-sparing lesions of the RMTg. Our results support the involvement of the RMTg in LHb-mediated feedforward inhibition of DA neurons and suggest that the distribution of these cells within the mesopontine tegmentum or their topographical projections to the midbrain may be more diffuse than previously thought.
Materials and Methods
Animals.
Adult male Sprague-Dawley rats (200–375 g; Charles River Laboratories) were delivered to the animal facilities at the Maryland Psychiatric Research Center and maintained on a 12:12 h light:dark cycle with food and water ad libitum. A total of 50 rats (22 sham and 28 lesioned) were used for these experiments. NeuN cell counts were obtained in 24 rats (4 sham and 20 lesioned). Open-field activity was analyzed in 31 rats (13 sham and 18 lesioned). Electrophysiological recordings were made in 28 rats (13 sham and 15 lesioned). All stereotaxic coordinates are given relative to bregma and brain area boundaries were determined using the rat atlas of Paxinos and Watson (2007). This study was conducted in strict accordance with recommendations in the Guide for the Care and Use of Laboratory Animals (National Research Council, 2011). All procedures were approved by the University of Maryland School of Medicine Institutional Care and Use Committee.
RMTg lesion surgery.
Rats were anesthetized with halothane (induced at 3% and maintained at 1.5% in 100% O2) to the point of nonresponsiveness to a toe pinch and maintained at that level throughout the surgery. A feedback-controlled heating pad maintained body temperature at 36°C. Rats were mounted in a stereotaxic instrument using atraumatic ear bars (David Kopf Instruments) and a small burr hole was drilled through the skull above and lateral to the RMTg (AP: −7.2 mm; ML: 2.7 mm) before retracting the dura. A single barrel glass pipette (tip diameter, 20 μm; BF1401, WPI) containing either vehicle (0.9% saline) or 0.4 m quinolinic acid (QA) was attached to a gas-tight holder and lowered to the level of the RMTg (DV: −8.3 mm at a 20° angle) to deliver a single midline injection. A volume of 110 nl was ejected by pneumatic picospritzer (PDES-02DX; NPI) using nitrogen gas (110 nl/min) and pipettes remained in place for 15 min after ejection. Wound margins were closed with sterile wound clips and pentobarbital (50 mg/ml; Sigma-Aldrich) was administered twice postsurgically to rats in the QA lesion group to prevent seizure (25 mg/kg, i.p., at the end of surgery; 12.5 mg/kg, i.p., 45–60 min after surgery). Three rats in the sham-operated group were administered the same dose of pentobarbital and were not found to differ from other sham animals in any of the experimental measurements.
Open-field activity.
A subgroup of rats was analyzed for open-field activity after RMTg lesions [median 9 d after surgery, interquartile range (IQR) 8–9 d]. The large open-field arena was circular (diameter 250 cm, wall height 50 cm) and illuminated by two 40 W fluorescent bulbs. Rats were placed individually in the arena and allowed to explore freely for 30 minutes. A camera installed on the ceiling transmitted a video feed to a PC running video-tracking software (EthoVision; Noldus). Data were stored at a rate of 30 frames/s and analyzed for total distance traveled.
In vivo electrophysiology.
The median time to recording after RMTg lesions was 19 d (IQR 15–32 d). Rats were anesthetized with chloral hydrate (400 mg/kg, i.p.), tissues surrounding the ear canals and wound margins were infiltrated with 2% mepivacaine, and the rat was placed in a stereotaxic instrument. Body temperature was maintained at 36°C using a feedback-controlled heating pad. The scalp was incised and a rectangular skull section was removed to expose the cortex overlying the LHb and midbrain (AP: −3.0 to −6.5 mm; ML: 0.0–3.0 mm). A concentric, bipolar stimulating electrode (SNEX-100X; Rhodes Medical Instruments) was positioned within the LHb (AP: −3.4 mm; ML: 1.5 mm; DV: 5.2 mm) at a 10° angle. Recording electrodes were prepared from borosilicate glass capillary tubing (1.5 mm outer diameter, BF 1401; World Precision Instruments) using a vertical puller (PE-2; Narishige) and filled with a 1 m NaCl solution saturated with Fast Green FCF (Sigma-Aldrich). Tips were broken back to create microelectrodes with an in vitro impedance ranging from 5.8 to 8.2 MΩ. Recording electrodes were attached to a piezoelectric microdrive (Inchworm; Burleigh) and lowered into the SN/lateral VTA (AP: −5.4 mm to −6.2 mm; ML: 1.5–2.5 mm; DV: −6.8 to −8.5 mm). Electrodes were advanced slowly (1–2 μm/s) until a spontaneously active cell could be isolated from background noise. Electrode potentials were amplified, band-pass filtered (0.1–8 kHz), and monitored in real time using a digital oscilloscope and audiomonitor. Electrical activity was digitized at 20 kHz using a 16-bit laboratory interface (Micro 1401; CED) and stored for offline analysis using Spike 2 software (CED).
DA neurons were identified electrophysiologically using previously established criteria (Ungless and Grace, 2012). Briefly, a neuron was classified as DA containing only if it was recorded within the boundaries of the SN or lateral VTA and had the following three characteristics: (1) a firing rate of 1–10 Hz, (2) an action potential duration from initiation to the negative trough of 1.1 ms or greater, and (3) a “notch” in the ascending initial phase of the spike, a triphasic waveform, or evidence of burst firing. Neurons that failed to meet these criteria were not studied further.
Once a neuron with these characteristics was isolated, a baseline of ∼500 spike events was recorded. Cells were then tested for their response to repeated application (0.5 Hz) of rectangular current pulses (biphasic, 1.0 mA, 100 μs duration) with a minimum of 500 spikes collected during LHb stimulation. At the conclusion of a successful recording, Fast Green was ejected iontophoretically from the pipette tip by applying −25 μA of DC current for 30 min. Although multiple neurons may have been recorded during a single impalement, only one dye spot per track was made. At the end of the recording session, the position of the stimulating electrode was marked with an electrolytic lesion (−0.1 mA, 8 s). Subsequently, rats were deeply anesthetized and perfused transcardially with 100 ml of 4°C PBS followed by 500 ml of 6% formalin (pH 7.4, 4°C). Brains were removed and postfixed for 30 min before sectioning.
Electrophysiological analysis.
Individual spikes were isolated from background noise and stimulation artifacts offline using the waveform sorting algorithm provided in Spike 2. Basal firing properties were obtained from the initial prestimulation recording period and included firing rate, averaged waveform shape and duration, distribution of interspike intervals (ISIs), and bursting activity. The coefficient of variation (CV), a measure of the regularity of neuronal firing (Matthews et al., 1984), was calculated using ISI histograms [(SD of ISI/mean of ISI) * 100]. Bursting activity was calculated for all cells using previously validated criteria (Grace and Bunney, 1983). Burst initiation was defined by spike pairs with an ISI ≤ 80 ms. All subsequent spikes were considered part of that burst until an ISI exceeded 160 ms, which defined burst termination. Spike doublets were counted as bursts, but only neurons that exhibited a minimum of three three-spike bursts over the course of 500 spikes were classified as bursting neurons (Shepard and German, 1984). The percentage of spikes discharged in bursts and the percentage of short (two spike) bursts was determined for each cell that was classified as bursting.
Spontaneous firing patterns were analyzed by the construction of autocorrelograms from spike trains during baseline recording with a 2 s time window and 5 ms bin width (Tepper et al., 1995). Neurons not already classified as burst firing were further classified by autocorrelogram pattern. Neurons exhibiting three or more equally spaced peaks in the autocorrelogram occurring at integral multiples of the mean ISI were defined as pacemaker neurons. All other neurons were classified as irregular firing, which typically exhibited an autocorrelogram with a short initial period (50–150 ms) without spike events followed by a rise to a steady state. Autocorrelograms were analyzed by three raters blinded to the treatment condition of the subject with an interrater agreement on pacemaker/irregular assignment of 93%.
Peristimulus time histograms of spike events occurring 0.5 s before and 1.5 s after LHb stimulation were compiled using a 1 ms binwidth for individual neurons. Cumulative summation (CUMSUM) plots were constructed from peristimulus time histograms by adding the contents of each bin to a running sum of all previous events and were analyzed for excitation or inhibition using previously described techniques (Ji and Shepard, 2007). Briefly, control activity was determined from the slope of a least-squares regression line fit to 500 ms of prestimulus data. Stimulation-induced changes in firing probability were determined by comparing the slope of discrete regions (stimulation effect, recovery from stimulation) of each CUMSUM plot with control values (baseline). In accordance with previous reports (Ji and Shepard, 2007), a response was defined as an increase or decrease in slope exceeding 30% of baseline. Latency to onset and duration of the response to LHb stimulation were determined from the intersection of adjacent lines representing baseline, each phase of the response to stimulation, and return to prestimulation rates of activity.
A mean peristimulus time histogram was compiled for both groups (sham and RMTg lesioned) using 1 ms binwidths for spike events occurring 0.5 s before and 1.5 s after LHb stimulation. These histograms were smoothed by calculating a 25 point exponential weighted moving average (EWMA) using the formula [EWMAt = (α * FRt) + ((1 − α) * EWMAt−1)] where t is any given time point, α is the weighting factor [2/(1 + 25)], FRt is the firing rate at time point t, and given that EWMA0 is equal to a simple moving average of the first 25 ms. Delta scores [EWMARMTg lesion − EWMASham] were calculated at each time point as were the mean and SD for delta scores in the 0.5 s immediately before LHb stimulation.
Histological confirmation of electrode placement and quantification of RMTg lesions.
Brains were blocked and sectioned in the coronal plane at 40 μm on a vibrating tissue slicer (VT 1200; Leica) throughout the rostral–caudal extent of the LHb and RMTg. Sections containing stimulating electrode lesions and recording electrode dye spots were slide mounted and counterstained with 0.1% neutral red for contrast. Only rats with stimulating probes placed in or adjacent to the boundaries of the LHb/fr and with dye spots clearly localized within the SN or VTA were retained for analysis. Consequently, recordings obtained in two sham and three lesioned rats were excluded from the analysis, reducing the number of DA neurons analyzed from 34 in each group to 30 and 24 in the sham and lesioned groups, respectively.
The extent of neuronal loss after QA injection into the RMTg was determined in systematically random sampled sections throughout the injection area (200 μm intervals) processed for immunohistochemical visualization of the neuron specific protein NeuN as described previously (Brown and Shepard, 2013). Sections were incubated at room temperature successively, with 3 PBS rinses following each step, in the following: (1) 0.3% H2O2 in PBS for 30 min; (2) rabbit anti-NeuN polyclonal primary antibody (ABN 78, 1:10,000; Millipore), 3.0% NGS, 0.3% Triton-X in PBS overnight; (3) biotinylated goat anti-rabbit secondary antibody (BA-1000, 1:600; Vector Laboratories), 1.0% NGS, 0.3% Triton-X in PBS for 30 min; (4) avidin-biotin immunoperoxidase (Vectastain Elite, PK-6100; Vector Laboratories) in PBS for 30 min; and (5) 0.03% 3–3′-diaminobenzidine (DAB) in PBS for 2–5 min. Omission of the primary antibody was used as a negative control in all incubations. All sections were mounted on glass slides, dried overnight, and coverslipped.
Cell counts of the NeuN-positive objects were conducted in the RMTg and the rostral portion of both the median raphe (MRn) and pedunculopontine tegmentum (PPTg) using previously described parameters (Jhou et al., 2013). Briefly, photomicrographs of brain sections were captured digitally at a resolution of 12.2 MP (EOS Rebel/T3; Canon) using a microscope (BX41; Olympus America) with a 2× flat-field objective (PLAPON 2X; Olympus America). Templates delineating the boundaries of the bilateral RMTg through its rostral–caudal extent (six sections, boundaries determined by retrograde tracing from VTA, templates provided by Dr. Thomas Jhou, The Medical University of South Carolina), the MRn, and bilateral PPTg (two and four sections) were overlaid on digital photomicrographs of brain sections. All positively stained, ovular objects within the bounds of the three areas were counted and summed within the bilateral RMTg and PPTg. Cell counts in lesioned rats were compared with the mean cell counts in sham-operated animals to quantify the extent of the lesion.
Statistical analysis.
Categorical data were analyzed using Fisher's exact test, with post hoc significance determined by the adjusted standardized residual method with Bonferroni-adjusted α (Sharpe, 2015). Ordinal and non-normal data were analyzed with Mann–Whitney U test. All other data were analyzed by t test or ANOVA, as appropriate, with post hoc Fisher tests.
Results
LHb stimulation inhibits the activity of midbrain DA neurons in sham-lesioned rats
Single-unit recordings were obtained from 30 DA neurons in the ventral midbrain of 11 rats that had received an injection of saline into the RMTg 14–42 d earlier. All cells included in the study were located within the SN or adjacent lateral VTA of rats in which the placement of the stimulation electrode within the LHb had also been confirmed histologically (Fig. 1A). Action potentials frequently exhibited a notch in the rising phase of a triphasic spike that had to exceed 1.1 ms from initiation to trough to be included in the analysis (Ungless and Grace, 2012; Fig. 1B). Spontaneous firing rates ranged from 1.5 to 8.0 Hz (4.6 ± 0.3 Hz) and the firing pattern was categorized as pacemaker (17.4%, 4/23), irregular (26.1%, 6/23), or bursting (56.5%, 13/23). As reported previously (Ji and Shepard, 2007), single-pulse stimulation of the LHb inhibited the majority of DA cells recorded (93.3%, 28/30; Fig. 1C). Occasionally, the initial inhibition in firing rate was followed by a rebound excitation. One of the remaining two neurons was excited and the other showed no change in activity.
Figure 1.
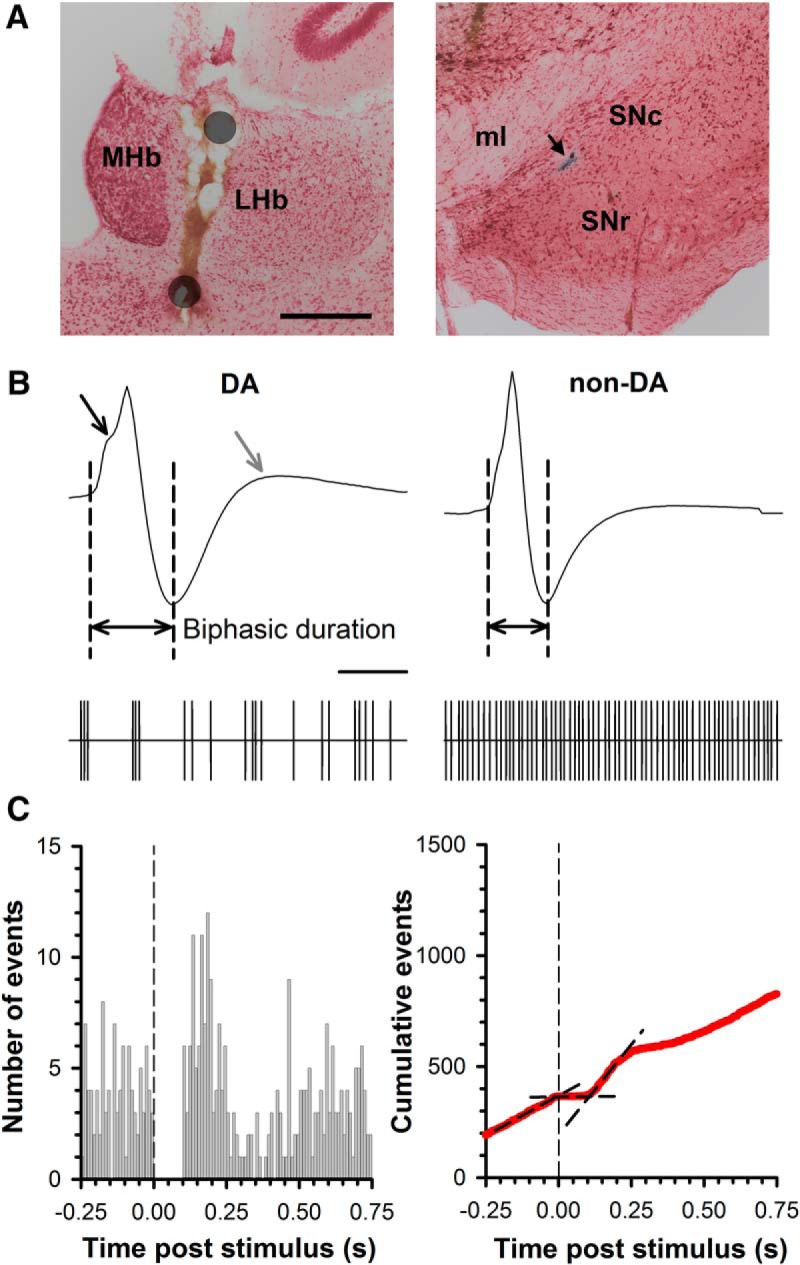
Representative electrode placements and electrophysiological properties of midbrain DA and non-DA neurons. A, Photomicrograph of stimulating electrode placement (left) and recording location (right). The position of the two poles of the stimulating electrode are approximated by the gray circles, with current flow between the poles confined largely to the LHb. A blue dye spot (arrow) marks the location of cell recording within the SNc. Scale bar, 0.4 mm. MHb, Medial habenula; SNr, substantia nigra pars reticulate; ml, medial lemniscus. B, Representative DA (left) and non-DA (right) action potential waveform (top) and spike train event marker (bottom). Note that the DA neuron waveform has a prolonged biphasic duration, a “notch” in the rising phase (black arrow), and a pronounced third phase (gray arrow) relative to the non-DA waveform. In addition, the DA neuron is slower firing and sometimes has bursting activity, in contrast to the high-frequency, regular activity common to non-DA neurons. Scale bar, 1 ms (waveform), 1 s (spike train event marker). C, Example of a peristimulus time histogram (left) and CUMSUM plot (right) from a DA neuron initially inhibited by LHb stimulation. At the time of stimulation (vertical dashed line), there is a transient inhibition in spontaneous activity that translates into a zero slope in the CUMSUM plot as demarked by the second black line. In this example, the inhibition is followed by a rebound excitation (third black line).
Midline QA injection reduces NeuN-positive cell counts in the RMTg
Templates delineating the boundaries of the bilateral RMTg (see Materials and Methods for details) were used to count the number of NeuN-positive cells within the RMTg of sham and QA-injected rats (Fig. 2A). The number of NeuN-positive objects in sham-lesioned rats varied along the rostral–caudal plane, with more neurons observed in the caudal regions of the nucleus (Fig. 2B). A single midline injection of QA reduced the total number of NeuN-labeled profiles in the RMTg by 72% (median reduction, IQR 60.8–84.6%). A significant reduction in NeuN-labeled cells was observed at each rostral–caudal section compared with sham-treated rats (ANOVA F(1,18) = 51.43, p < 0.001). QA injections also reduced the number of NeuN-positive neurons in the rostral portion of the MRn (F(1,21) = 9.71, p = 0.005; median 32.5% reduction, IQR 23.2–48.2%) without affecting the number of neurons in the more laterally positioned PPTg (F(1,21) = 0.91, p = 0.351; median 7.4% reduction, IQR 2.4–12.7%).
Figure 2.

Neuronal loss in the mesopontine tegmentum after QA injection. A, Representative photomicrographs of a sham-treated (left) and RMTg-lesioned (right) rat midbrain (∼−7.2 mm caudal to bregma) immunostained for NeuN with overlaid boundaries of the RMTg (red), MRn, and PPTg (black). Scale bar, 0.4 mm. B, Total NeuN-positive cell counts (mean ± SEM) within the boundaries of the RMTg, MRn, and PPTg by distance to bregma for sham (red squares, n = 4 all areas) and RMTg-lesioned (gray squares, n = 16 RMTg, n = 19 MRn and PPTg) rats. NeuN cell counts after lesion were significantly reduced in both the RMTg and MRn both overall (see text) and at each AP coordinate relative to sham-treated rats. *p < 0.05, Fisher's test.
RMTg lesions alter the basal firing properties of DA neurons
Single-unit recordings were analyzed from 24 DA neurons in the ventral midbrain of 12 rats that had received an injection of QA into the RMTg 12–35 d earlier. DA neurons recorded in RMTg-lesioned rats showed no changes in action potential morphology or duration and basal firing rates did not differ between sham and RMTg-lesioned rats (4.6 Hz for sham vs 4.4 Hz for lesion; t(43) = −0.38, p = 0.705). However, the CV of the ISI was significantly reduced in the lesioned group compared with sham controls (U(43) = 383.0, p = 0.003; Fig. 3A), indicating a greater regularity in spike firing. Consistent with this difference, an analysis of firing pattern phenotype (Fig. 3B) showed that DA neurons from RMTg-lesioned rats were more likely to present with a pacemaker discharge (54.5%, 12/22) than a bursting pattern (18.2%, 4/22) or irregular single spike discharge (27.3%, 6/22). Overall, the distribution of firing pattern phenotypes was altered significantly relative to sham controls (Fisher's exact test, p = 0.012; Fig. 3C), with a significant decrease in the prevalence of burst-firing neurons within the RMTg-lesioned group (adjusted standardized residual = −2.64, p = 0.008). Among burst-firing neurons, no significant differences were found between the sham and RMTg lesion groups in the percentage of spikes in bursts (46.0 vs 24.6%; U(15) = 39.0, p = 0.157) or the percentage of doublet bursts (36.2 vs 57.1%; U(15) = 22.0, p = 0.692).
Figure 3.

Effects of RMTg lesions on the basal firing properties of midbrain DA neurons. A, Distribution of ISI CV for neurons from sham (n = 23) and RMTg-lesioned (n = 22) rats superimposed on box-and-whisker plots illustrating the median, IQR, and 5–95% range. CV was significantly reduced in RMTg-lesioned rats. *p < 0.05, Mann–Whitney test. B, Representative samples of spike train event markers associated with pacemaker, irregular, and bursting DA cells (top) with corresponding autocorrelograms (bottom). Note that, despite having similar firing rates, these neurons have different CVs. Scale bar, 1 s. C, Pie charts illustrating the prevalence of pacemaker, irregular, and burst-firing neurons in sham-operated (left) and RMTg-lesioned (right) rats.
RMTg lesions attenuate LHb-induced inhibition of DA cell activity
The response to LHb stimulation of a representative DA neuron from an RMTg-lesioned rat is shown in Figure 4A. In contrast to the nearly uniform inhibition seen in sham-treated rats, the response of DA neurons to LHb stimulation was significantly altered in RMTg-lesioned rats (Fisher's exact test, p = 0.007; Fig. 4B). Stimulation parameters that inhibited >90% of DA neurons recorded in sham-treated rats inhibited 66.7% (16/24) of DA neurons recorded in lesioned rats. The remaining 33.3% (8/24) showed no response to LHb stimulation (adjusted standard residual = 2.94, adjusted p = 0.003), an outcome that was rarely (3.3%, 1/30) observed in unlesioned animals. Because there was variability in lesion size, we conducted a median split of the RMTg lesion group by lesion extent (median 84.6%; “small” lesion, n = 10; “large” lesion, n = 11) for further analysis. There was a lower prevalence of inhibited neurons in animals with larger lesions, but this trend did not reach significance (Fisher's exact p = 0.362; Fig. 4B). Similarly, neurons from the large lesion group tended to have a shorter duration of inhibition (32.0 vs 50.5 ms, large vs small median; U(12) = 40.0, p = 0.573) and reduced magnitude of inhibition (to 29.6% vs to 13.6% of the control firing rate, large vs small median; U(12) = 55.0, p = 0.228), with the contrasts falling short of significance, likely due to the small sample size.
Figure 4.

Effects of RMTg lesions on the response of DA neurons to LHb stimulation. A, Example of a peristimulus time histogram (left) and CUMSUM plot (right) from a DA neuron initially inhibited by LHb stimulation (vertical dashed line) in an RMTg-lesioned rat. Note the shorter duration of inhibition compared with the sham control example in Figure 1. B, Pie charts illustrating the prevalence of neurons exhibiting excitation, no effect, or inhibition in response to LHb stimulation in sham-operated (top) and RMTg-lesioned (middle) rats. A median split by lesion size of the RMTg-lesioned group is also shown (bottom; see text for details). C, Scatterplot of the duration of inhibition (abscissa) versus the magnitude of inhibition expressed as a percentage of control firing rate (ordinate) for neurons inhibited by LHb stimulation in sham (red, n = 28) and RMTg-lesioned (gray, n = 16) rats. Straight lines represent regression lines for the sham (red; Pearson's r(26) = −0.34, p = 0.077) and RMTg-lesioned (gray; Pearson's r(14) = 0.19, p = 0.481) groups. Median values for both groups are demarcated on the axes by correspondingly colored triangles. Note that RMTg-lesioned rats had a significantly shorter duration of inhibition overall (*, see text). Although the slopes have a different valence, they are not significantly different (t(40) = −1.53, p = 0.134). D, Scatterplot for RMTg-lesioned rats (gray) illustrating the percentage of neuronal loss in lesioned rats (abscissa) versus the percentage change in firing rate for the first 50 ms after LHb stimulation relative to baseline (ordinate). Sham rats (red) are shown at zero percentage for comparison. Median values for both groups are demarcated on the ordinate by correspondingly colored triangles and were significantly different (*, see text). A significant linear trend was present among RMTg-lesioned rats, with the percentage of neurons lost to the lesion correlating with a decrease in LHb-stimulation induced inhibition. Note that, in rats with the greatest lesion-induced cell loss, some cells showed a slight excitation in response to LHb stimulation. Only rats with fully quantified lesions were included in this analysis.
Among the neurons that continued to show an inhibition in response to LHb stimulation, the median duration of inhibition was shorter relative to sham controls (50.5 vs 95.0 ms; U(42) = 104.5, p = 0.004), with no difference in the median magnitude of inhibition (to 25.7% vs to 18.4% control firing rate; U(42) = 173.0, p = 0.218; Fig. 4C). The median firing rate immediately after LHb stimulation as a percentage of baseline was significantly less depressed in RMTg-lesioned rats relative to sham controls (65.2% vs 10.0%; U(49) = 133.0, p < 0.001; Fig. 4D). Furthermore, a significant positive correlation existed between this variable and the extent of neurons lost due to lesion within the RMTg (Pearson's r(19) = 0.51, p = 0.020), but not the rostral portion of the MRn (Pearson's r(19) = 0.40, p = 0.072) or PPTg (Pearson's r(19) = 0.11, p = 0.621).
To illustrate the overall effect of RMTg lesions on dopamine neuron firing at the population level, we compiled an average peristimulus time histogram of all neurons for both sham and RMTg-lesioned rats regardless of response type (Fig. 5A). Consistent with the previous data, the nadir of LHb-induced inhibition of DA firing was attenuated in RMTg-lesioned rats. Further analysis of RMTg-lesioned rats by the median split used previously suggests that, in rats with larger lesions, there is a shorter average duration of inhibition (Fig. 5B), which likely results from the trend for more neurons in the large lesion group to show no response to LHb stimulation. A comparison of the difference scores between the sham and lesioned groups (Fig. 5C) demonstrates that the difference in firing rate between the two groups exceeded three SDs for an extended period from 16 to 133 ms after LHb stimulation.
Figure 5.

Effect of RMTg lesions on both mean firing rate of all sampled DA neurons in response to LHb stimulation and open-field activity. A, Average peristimulus time histogram of firing rate for all DA neurons in both sham (red) and RMTg lesioned (gray) rats using 1 ms bins with a 25 bin exponential weighted moving average (see Materials and Methods for details). After LHb stimulation (vertical dashed line), DA neurons from RMTg-lesioned rats displayed an attenuated inhibition relative to sham rats. B, Average peristimulus time histogram of firing rate for all DA neurons in RMTg-lesioned rats using a median split by lesion size to form small (light gray) and large (dark gray) lesion groups. The average duration of inhibition appears to be shorter in the larger lesion group compared with the small lesion group, likely reflecting the trend for more neurons in the large lesion group to show no response to LHb stimulation. C, Difference in firing rate between groups from Figure 5A. SD of the delta scores was calculated from the baseline period preceding LHb stimulation (vertical dashed line); horizontal dotted lines represent a 3 σ deviation from the mean delta score. D, Bar graph of mean total distance traveled in an open field overlaid with individual scores from sham (n = 13, red) and RMTg-lesioned (n = 18, gray) rats. *p < 0.05, t test. Note that all sham data points are lower than the mean value for the RMTg-lesioned group.
Open-field activity is elevated in RMTg-lesioned rats
Recent studies have suggested that the RMTg exerts a tonic inhibitory influence over the activity of midbrain DA neurons (Bourdy et al., 2014; Kaufling and Aston-Jones, 2015; Fu et al., 2016). Accordingly, RMTg lesions would be expected to increase locomotor activity (Lavezzi et al., 2015). Therefore, we assessed the effects of RMTg lesions on locomotor activity in a subgroup of sham-treated (n = 13) and RMTg-lesioned (n = 18) rats. Locomotor activity, using total distance traveled in an open field, was significantly elevated in RMTg-lesioned rats relative to sham controls (t(29) = 2.67, p = 0.012; Fig. 5D). Although there was a positive correlation between total distance traveled and the extent of lesion within the RMTg, this did not reach significance (Pearson's r(13) = 0.42, p = 0.121), nor was total distance traveled correlated with lesion extent in the rostral portion of the MRn (Pearson's r(13) = 0.20, p = 0.481) or PPTg (Pearson's r(13) = −0.22, p = 0.428).
Discussion
In the present study, we demonstrate that the rapid, transient, population-wide inhibition of midbrain DA neurons elicited by single-pulse LHb stimulation is attenuated significantly by QA-induced lesions of the RMTg. Our primary finding was a 10-fold increase in the number of DA neurons that failed to respond to LHb stimulation in lesioned animals. Although approximately two-thirds of the DA cells recorded in RMTg-lesioned rats continued to exhibit an inhibition in response to LHb stimulation, the duration of inhibition was significantly reduced compared with sham-treated rats. It is worth noting that the proportion of DA neurons inhibited by LHb stimulation in RMTg-lesioned rats (∼67%) was similar to that seen in an earlier study during intranigral application of the GABAA receptor antagonist bicuculline (58%; Ji and Shepard, 2007). These results could suggest that the RMTg accounts for the majority of GABAA receptor-mediated inhibition of DA cell activity in response to LHb stimulation.
QA lesions of the RMTg: selectivity and effect size
The mesopontine lesions produced in these experiments were comparatively selective, confirming reports that QA lesions of the RMTg leave surrounding nuclei largely intact (Sheth et al., 2016). Cell loss in the MRn was limited to the rostral portion and was smaller in magnitude than neuronal loss within the RMTg. The PPTg, an important source of excitatory input to the ventral midbrain (Lokwan et al., 1999; Floresco et al., 2003), was not affected significantly. The degree of cell loss was quantified only within the rostral portions of the MRn and the PPTg that overlapped with the RMTg, accounting for ∼25% of the total MRn and 40% of the total PPTg rostral–caudal extent. Because both the MRn and PPTg extend farther caudally, it is likely that the actual proportional cell loss was significantly less than what was reported in the results. The existence of a significant correlation between cell loss in the RMTg (but not the MRn and PPTg) and the magnitude of the LHb-induced inhibition in DA cell firing suggests that these effects are attributable to RMTg lesions rather than incidental damage to surrounding nuclei.
It is somewhat surprising that the scope of the lesion, which reduced the number of NeuN-labeled neurons in the RMTg by ∼70%, was associated with only a 30% decline in the number of DA cells inhibited by LHb stimulation. Even among rats with the largest RMTg lesions (≥84.6%) LHb stimulation still inhibited more than half of the recorded dopamine neurons without a significant decrement in the duration of inhibition relative to rats with smaller lesions. This implies that the boundaries used to define the RMTg operationally likely excluded neurons that contribute to this pathway or that other sources of inhibitory input to midbrain DA neurons exist. Conversely, if individual RMTg neurons provide input to a topographically disparate group of DA neurons, anything less than a complete ablation of the RMTg would also result in a diminished inhibition rather than a complete loss of responsiveness to LHb stimulation.
RMTg lesions: potential involvement of compensatory mechanisms
Several lines of evidence suggest that the RMTg exerts a tonic inhibitory influence over midbrain DA neurons. Acute pharmacological inactivation of the region increases locomotor activity (Lavezzi et al., 2015) and RMTg lesions increase ambulation (Fu et al., 2016) and improve motor performance during rotarod testing (Bourdy et al., 2014). Consistent with these findings, we observed increased locomotor activity in an open field in RMTg-lesioned rats. However, in contrast to the marked increase in firing rate of DA neurons after inactivation of the RMTg (Bourdy et al., 2014), in the present study, QA lesions of the region did not alter the basal firing rate significantly. Changes in DA cell activity elicited by acute pharmacological inactivation of the RMTg probably differ from those associated with excitotoxic lesions of the region in part because of the compensatory changes that are likely to occur after extensive cell loss (e.g., changes in GABA receptor density). Given that 75% of our recordings were obtained >2 weeks after QA injections, it seems plausible that compensatory increases in GABAA receptor tone opposed a significant increase in firing rate. Indeed, a significant upregulation of GABAA receptors on SN DA neurons is known to occur within 2 weeks after loss of striatal input (Porceddu et al., 1985; Sanna et al., 1998; Fujiyama et al., 2002). Consistent with this interpretation, Bourdy et al. (2014) reported smaller increases in the basal activity of DA neurons 2 weeks after ibotenic lesions of the RMTg than those observed after acute pharmacological inactivation of the region. Furthermore, the elevation in locomotor activity in RMTg-lesioned rats appears to peak at 2 weeks after lesion before stabilizing at 3 weeks to a lower, but still significantly elevated, level (Fu et al., 2016).
Increases in GABA receptor expression on midbrain DA neurons after RMTg lesions could also explain the paradoxical increase in the incidence of pacemaker firing among DA neurons in RMTg-lesioned animals. Previous studies have shown that acute activation of GABAB receptors suppress burst firing of DA neurons and induce a pacemaker-like firing pattern similar to that observed in the present study (Grace and Bunney, 1980; Engberg et al., 1993). Therefore, a compensatory postsynaptic upregulation in the expression of GABAB receptors on DA neurons after loss of GABAergic input from the RMTg could explain the dramatic shift in the distribution of firing patterns between the sham and lesioned groups.
Summary
In addition to being activated by strongly aversive stimuli (Benabid and Jeaugey, 1989; Dong et al., 1992; Gao et al., 1996), the LHb has been implicated in the regulation of negative reward prediction errors (Matsumoto and Hikosaka, 2007; Salas et al., 2010) and incentive salience (Danna et al., 2013) via its influence on midbrain DA neurons. Although these actions have been attributed to feedforward inhibition arising from the RMTg (Jhou et al., 2009a, 2009b; Kaufling et al., 2009; Omelchenko et al., 2009; Brinschwitz et al., 2010; Balcita-Pedicino et al., 2011; Bourdy et al., 2014), before this study, only indirect evidence existed to support this contention. The results of the present study confirm the involvement of the RMTg in the LHb-induced inhibition of DA neurons while pointing to the need for careful evaluation of alternate pathways and compensatory mechanisms that could contribute to or obscure, respectively, the contribution made by this important source of GABAergic input to the activity of midbrain DA neurons.
Footnotes
This work was supported by the National Association for Research on Schizophrenia and Affective Disorders (Independent Investigator Award to P.D.S.), the National Institutes of Health (National Institute of Mental Health Research Grant R01MH094489 to P.D.S. and G.I.E. and Training Grant T32MH067533), and the National Institute on Drug Abuse (Ruth L. Kirschstein National Research Service Award Grant F31DA030893 to PLB). We thank Dana Cobb for help in reviewing and editing this manuscript.
The authors declare no competing financial interests.
References
- Balcita-Pedicino JJ, Omelchenko N, Bell R, Sesack SR. The inhibitory influence of the lateral habenula on midbrain dopamine cells: ultrastructural evidence for indirect mediation via the rostromedial mesopontine tegmental nucleus. J Comp Neurol. 2011;519:1143–1164. doi: 10.1002/cne.22561. [DOI] [PMC free article] [PubMed] [Google Scholar]
- Bayer HM, Glimcher PW. Midbrain dopamine neurons encode a quantitative reward prediction error signal. Neuron. 2005;47:129–141. doi: 10.1016/j.neuron.2005.05.020. [DOI] [PMC free article] [PubMed] [Google Scholar]
- Benabid AL, Jeaugey L. Cells of the rat lateral habenula respond to high-threshold somatosensory inputs. Neurosci Lett. 1989;96:289–294. doi: 10.1016/0304-3940(89)90393-5. [DOI] [PubMed] [Google Scholar]
- Bourdy R, Sánchez-Catalán MJ, Kaufling J, Balcita-Pedicino JJ, Freund-Mercier MJ, Veinante P, Sesack SR, Georges F, Barrot M. Control of the nigrostriatal dopamine neuron activity and motor function by the tail of the ventral tegmental area. Neuropsychopharmacology. 2014;39:2788–2798. doi: 10.1038/npp.2014.129. [DOI] [PMC free article] [PubMed] [Google Scholar]
- Brinschwitz K, Dittgen A, Madai VI, Lommel R, Geisler S, Veh RW. Glutamatergic axons from the lateral habenula mainly terminate on GABAergic neurons of the ventral midbrain. Neuroscience. 2010;168:463–476. doi: 10.1016/j.neuroscience.2010.03.050. [DOI] [PubMed] [Google Scholar]
- Bromberg-Martin ES, Hikosaka O. Lateral habenula neurons signal errors in the prediction of reward information. Nat Neurosci. 2011;14:1209–1216. doi: 10.1038/nn.2902. [DOI] [PMC free article] [PubMed] [Google Scholar]
- Brown PL, Shepard PD. Lesions of the fasciculus retroflexus alter footshock-induced cFos expression in the mesopontine rostromedial tegmental area of rats. PLoS One. 2013;8:e60678. doi: 10.1371/journal.pone.0060678. [DOI] [PMC free article] [PubMed] [Google Scholar]
- Chang CY, Esber GR, Marrero-Garcia Y, Yau HJ, Bonci A, Schoenbaum G. Brief optogenetic inhibition of dopamine neurons mimics endogenous negative reward prediction errors. Nat Neurosci. 2016;19:111–116. doi: 10.1038/nn.4191. [DOI] [PMC free article] [PubMed] [Google Scholar]
- Christoph GR, Leonzio RJ, Wilcox KS. Stimulation of the lateral habenula inhibits dopamine-containing neurons in the substantia nigra and ventral tegmental area of the rat. J Neurosci. 1986;6:613–619. doi: 10.1523/JNEUROSCI.06-03-00613.1986. [DOI] [PMC free article] [PubMed] [Google Scholar]
- Danna CL, Shepard PD, Elmer GI. The habenula governs the attribution of incentive salience to reward predictive cues. Front Hum Neurosci. 2013;7:781. doi: 10.3389/fnhum.2013.00781. [DOI] [PMC free article] [PubMed] [Google Scholar]
- Dong WQ, Wilson OB, Skolnick MH, Dafny N. Hypothalamic, dorsal raphe and external electrical stimulation modulate noxious evoked responses of habenula neurons. Neuroscience. 1992;48:933–940. doi: 10.1016/0306-4522(92)90281-6. [DOI] [PubMed] [Google Scholar]
- Engberg G, Kling-Petersen T, Nissbrandt H. GABAB-Receptor activation alters the firing pattern of dopamine neurons in the rat substantia nigra. Synapse. 1993;15:229–238. doi: 10.1002/syn.890150308. [DOI] [PubMed] [Google Scholar]
- Floresco SB, West AR, Ash B, Moore H, Grace AA. Afferent modulation of dopamine neuron firing differentially regulates tonic and phasic dopamine transmission. Nat Neurosci. 2003;6:968–973. doi: 10.1038/nn1103. [DOI] [PubMed] [Google Scholar]
- Fu R, Chen X, Zuo W, Li J, Kang S, Zhou LH, Siegel A, Bekker A, Ye JH. Ablation of μ opioid receptor-expressing GABA neurons in rostromedial tegmental nucleus increases ethanol consumption and regulates ethanol-related behaviors. Neuropharmacology. 2016;107:58–67. doi: 10.1016/j.neuropharm.2016.02.027. [DOI] [PMC free article] [PubMed] [Google Scholar]
- Fujiyama F, Stephenson FA, Bolam JP. Synaptic localization of GABAA receptor subunits in the substantia nigra of the rat: effects of quinolinic acid lesions of the striatum. Eur J Neurosci. 2002;15:1961–1975. doi: 10.1046/j.1460-9568.2002.02017.x. [DOI] [PubMed] [Google Scholar]
- Gao DM, Jeaugey L, Pollak P, Benabid AL. Intensity-dependent nociceptive responses from presumed dopaminergic neurons of the substantia nigra, pars compacta in the rat and their modification by lateral habenula inputs. Brain Res. 1990;529:315–319. doi: 10.1016/0006-8993(90)90843-Z. [DOI] [PubMed] [Google Scholar]
- Gao DM, Hoffman D, Benabid AL. Simultaneous recording of spontaneous activities and nociceptive responses from neurons in the pars compacta of substantia nigra and in the lateral habenula. Eur J Neurosci. 1996;8:1474–1478. doi: 10.1111/j.1460-9568.1996.tb01609.x. [DOI] [PubMed] [Google Scholar]
- Geisler S, Andres KH, Veh RW. Morphologic and cytochemical criteria for the identification and delineation of individual subnuclei within the lateral habenular complex of the rat. J Comp Neurol. 2003;458:78–97. doi: 10.1002/cne.10566. [DOI] [PubMed] [Google Scholar]
- Grace AA, Bunney BS. Effects of baclofen on nigral dopaminergic cell activity following acute and chronic haloperidol treatment. Brain Res Bull. 1980;5:537–543. doi: 10.1016/0361-9230(80)90087-8. [DOI] [Google Scholar]
- Grace AA, Bunney BS. Intracellular and extracellular electrophysiology of nigral dopaminergic neurons. 1. Identification and characterization. Neuroscience. 1983;10:301–315. doi: 10.1016/0306-4522(83)90135-5. [DOI] [PubMed] [Google Scholar]
- Hart AS, Rutledge RB, Glimcher PW, Phillips PE. Phasic dopamine release in the rat nucleus accumbens symmetrically encodes a reward prediction error term. J Neurosci. 2014;34:698–704. doi: 10.1523/JNEUROSCI.2489-13.2014. [DOI] [PMC free article] [PubMed] [Google Scholar]
- Hong S, Jhou TC, Smith M, Saleem KS, Hikosaka O. Negative reward signals from the lateral habenula to dopamine neurons are mediated by rostromedial tegmental nucleus in primates. J Neurosci. 2011;31:11457–11471. doi: 10.1523/JNEUROSCI.1384-11.2011. [DOI] [PMC free article] [PubMed] [Google Scholar]
- Jhou TC, Fields HL, Baxter MG, Saper CB, Holland PC. The rostromedial tegmental nucleus (RMTg), a GABAergic afferent to midbrain dopamine neurons, encodes aversive stimuli and inhibits motor responses. Neuron. 2009a;61:786–800. doi: 10.1016/j.neuron.2009.02.001. [DOI] [PMC free article] [PubMed] [Google Scholar]
- Jhou TC, Geisler S, Marinelli M, Degarmo BA, Zahm DS. The mesopontine rostromedial tegmental nucleus: a structure targeted by the lateral habenula that projects to the ventral tegmental area of Tsai and substantia nigra compacta. J Comp Neurol. 2009b;513:566–596. doi: 10.1002/cne.21891. [DOI] [PMC free article] [PubMed] [Google Scholar]
- Jhou TC, Good CH, Rowley CS, Xu SP, Wang H, Burnham NW, Hoffman AF, Lupica CR, Ikemoto S. Cocaine drives aversive conditioning via delayed activation of dopamine-responsive habenular and midbrain pathways. J Neurosci. 2013;33:7501–7512. doi: 10.1523/JNEUROSCI.3634-12.2013. [DOI] [PMC free article] [PubMed] [Google Scholar]
- Ji H, Shepard PD. Lateral habenula stimulation inhibits rat midbrain dopamine neurons through a GABAA receptor-mediated mechanism. J Neurosci. 2007;27:6923–6930. doi: 10.1523/JNEUROSCI.0958-07.2007. [DOI] [PMC free article] [PubMed] [Google Scholar]
- Kaufling J, Aston-Jones G. Persistent adaptations in afferents to ventral tegmental dopamine neurons after opiate withdrawal. J Neurosci. 2015;35:10290–10303. doi: 10.1523/JNEUROSCI.0715-15.2015. [DOI] [PMC free article] [PubMed] [Google Scholar]
- Kaufling J, Veinante P, Pawlowski SA, Freund-Mercier MJ, Barrot M. Afferents to the GABAergic tail of the ventral tegmental area in the rat. J Comp Neurol. 2009;513:597–621. doi: 10.1002/cne.21983. [DOI] [PubMed] [Google Scholar]
- Lammel S, Lim BK, Ran C, Huang KW, Betley MJ, Tye KM, Deisseroth K, Malenka RC. Input-specific control of reward and aversion in the ventral tegmental area. Nature. 2012;491:212–217. doi: 10.1038/nature11527. [DOI] [PMC free article] [PubMed] [Google Scholar]
- Lammel S, Lim BK, Malenka RC. Reward and aversion in a heterogeneous midbrain dopamine system. Neuropharmacology. 2014;76:351–359. doi: 10.1016/j.neuropharm.2013.03.019. [DOI] [PMC free article] [PubMed] [Google Scholar]
- Lavezzi HN, Parsley KP, Zahm DS. Modulation of locomotor activation by the rostromedial tegmental nucleus. Neuropsychopharmacology. 2015;40:676–687. doi: 10.1038/npp.2014.223. [DOI] [PMC free article] [PubMed] [Google Scholar]
- Lecca S, Melis M, Luchicchi A, Ennas MG, Castelli MP, Muntoni AL, Pistis M. Effects of drugs of abuse on putative rostromedial tegmental neurons, inhibitory afferents to midbrain dopamine cells. Neuropsychopharmacology. 2011;36:589–602. doi: 10.1038/npp.2010.190. [DOI] [PMC free article] [PubMed] [Google Scholar]
- Ljungberg T, Apicella P, Schultz W. Responses of monkey dopamine neurons during learning of behavioral reactions. J Neurophysiol. 1992;67:145–163. doi: 10.1152/jn.1992.67.1.145. [DOI] [PubMed] [Google Scholar]
- Lokwan SJ, Overton PG, Berry MS, Clark D. Stimulation of the pedunculopontine tegmental nucleus in the rat produces burst firing in A9 dopaminergic neurons. Neuroscience. 1999;92:245–254. doi: 10.1016/S0306-4522(98)00748-9. [DOI] [PubMed] [Google Scholar]
- Matsumoto M, Hikosaka O. Lateral habenula as a source of negative reward signals in dopamine neurons. Nature. 2007;447:1111–1115. doi: 10.1038/nature05860. [DOI] [PubMed] [Google Scholar]
- Matthews RT, McMillen BA, Speciale SG, Jarrah H, Shore PA, Sanghera MK, Shepard PD, German DC. Effects of zoxazolamine and related centrally acting muscle relaxants on nigrostriatal dopaminergic neurons. Brain Res Bull. 1984;12:479–486. doi: 10.1016/0361-9230(84)90163-1. [DOI] [PubMed] [Google Scholar]
- Mirenowicz J, Schultz W. Preferential activation of midbrain dopamine neurons by appetitive rather than aversive stimuli. Nature. 1996;379:449–451. doi: 10.1038/379449a0. [DOI] [PubMed] [Google Scholar]
- Napier TC, Corvol JC, Grace AA, Roitman JD, Rowe J, Voon V, Strafella AP. Linking neuroscience with modern concepts of impulse control disorders in Parkinson's disease. Mov Disord. 2015;30:141–149. doi: 10.1002/mds.26068. [DOI] [PMC free article] [PubMed] [Google Scholar]
- National Research Council. Guide for the care and use of laboratory animals. Ed 8. Washington, DC: National Academies; 2011. [Google Scholar]
- Omelchenko N, Bell R, Sesack SR. Lateral habenula projections to dopamine and GABA neurons in the rat ventral tegmental area. Eur J Neurosci. 2009;30:1239–1250. doi: 10.1111/j.1460-9568.2009.06924.x. [DOI] [PMC free article] [PubMed] [Google Scholar]
- Pan WX, Hyland BI. Pedunculopontine tegmental nucleus controls conditioned responses of midbrain dopamine neurons in behaving rats. J Neurosci. 2005;25:4725–4732. doi: 10.1523/JNEUROSCI.0277-05.2005. [DOI] [PMC free article] [PubMed] [Google Scholar]
- Pan WX, Schmidt R, Wickens JR, Hyland BI. Dopamine cells respond to predicted events during classical conditioning: evidence for eligibility traces in the reward-learning network. J Neurosci. 2005;25:6235–6242. doi: 10.1523/JNEUROSCI.1478-05.2005. [DOI] [PMC free article] [PubMed] [Google Scholar]
- Paxinos G, Watson C. The rat brain in stereotaxic coordinates. Ed 6. Waltham, MA: Academic; 2007. [DOI] [PubMed] [Google Scholar]
- Porceddu ML, Corda MG, Sanna E, Biggio G. Increase in nigral type II benzodiazepine recognition sites following striatonigral denervation. Eur J Pharmacol. 1985;112:265–267. doi: 10.1016/0014-2999(85)90507-2. [DOI] [PubMed] [Google Scholar]
- Roesch MR, Calu DJ, Schoenbaum G. Dopamine neurons encode the better option in rats deciding between differently delayed or sized rewards. Nat Neurosci. 2007;10:1615–1624. doi: 10.1038/nn2013. [DOI] [PMC free article] [PubMed] [Google Scholar]
- Salas R, Baldwin P, de Biasi M, Montague PR. BOLD responses to negative reward prediction errors in human habenula. Front Hum Neurosci. 2010;4:36. doi: 10.3389/fnhum.2010.00036. [DOI] [PMC free article] [PubMed] [Google Scholar]
- Sánchez-Catalán MJ, Faivre F, Yalcin I, Muller MA, Massotte D, Majchrzak M, Barrot M. Response of the tail of the ventral tegmental area to aversive stimuli. Neuropsychopharmacology. 2016 doi: 10.1038/npp.2016.139. Advance online publication. Retrieved December 5, 2016. [DOI] [PMC free article] [PubMed] [Google Scholar]
- Sanna E, Motzo C, Usala M, Pau D, Cagetti E, Biggio G. Functional changes in rat nigral GABAA receptors induced by degeneration of the striatonigral GABAergic pathway: an electrophysiological study of receptors incorporated into Xenopus oocytes. J Neurochem. 1998;70:2539–2544. doi: 10.1046/j.1471-4159.1998.70062539.x. [DOI] [PubMed] [Google Scholar]
- Schultz W, Dayan P, Montague PR. A neural substrate of prediction and reward. Science. 1997;275:1593–1599. doi: 10.1126/science.275.5306.1593. [DOI] [PubMed] [Google Scholar]
- Sharpe D. Your chi-square test is statistically significant: now what? Practical Assessment, Research & Evaluation. 2015;20:1–10. [Google Scholar]
- Shepard PD, German DC. A subpopulation of mesocortical dopamine neurons possesses autoreceptors. Eur J Pharmacol. 1984;98:455–456. doi: 10.1016/0014-2999(84)90300-5. [DOI] [PubMed] [Google Scholar]
- Sheth C, Furlong TM, Keefe KA, Taha SA. Lesion of the rostromedial tegmental nucleus increases voluntary ethanol consumption and accelerates extinction of ethanol-induced conditioned taste aversion. Psychopharmacology. 2016;233:3737–3749. doi: 10.1007/s00213-016-4406-7. [DOI] [PMC free article] [PubMed] [Google Scholar]
- Stamatakis AM, Stuber GD. Activation of lateral habenula inputs to the ventral midbrain promotes behavioral avoidance. Nat Neurosci. 2012;15:1105–1107. doi: 10.1038/nn.3145. [DOI] [PMC free article] [PubMed] [Google Scholar]
- Steinberg EE, Keiflin R, Boivin JR, Witten IB, Deisseroth K, Janak PH. A causal link between prediction errors, dopamine neurons and learning. Nat Neurosci. 2013;16:966–973. doi: 10.1038/nn.3413. [DOI] [PMC free article] [PubMed] [Google Scholar]
- Stopper CM, Tse MT, Montes DR, Wiedman CR, Floresco SB. Overriding phasic dopamine signals redirects action selection during risk/reward decision making. Neuron. 2014;84:177–189. doi: 10.1016/j.neuron.2014.08.033. [DOI] [PubMed] [Google Scholar]
- Tepper JM, Martin LP, Anderson DR. GABAA receptor-mediated inhibition of rat substantia nigra dopaminergic neurons by pars reticulata projection neurons. J Neurosci. 1995;15:3092–3103. doi: 10.1523/JNEUROSCI.15-04-03092.1995. [DOI] [PMC free article] [PubMed] [Google Scholar]
- Ungless MA, Grace AA. Are you or aren't you? Challenges associated with physiologically identifying dopamine neurons. Trends Neurosci. 2012;35:422–430. doi: 10.1016/j.tins.2012.02.003. [DOI] [PMC free article] [PubMed] [Google Scholar]
- Ungless MA, Magill PJ, Bolam JP. Uniform inhibition of dopamine neurons in the ventral tegmental area by aversive stimuli. Science. 2004;303:2040–2042. doi: 10.1126/science.1093360. [DOI] [PubMed] [Google Scholar]
- Yetnikoff L, Cheng AY, Lavezzi HN, Parsley KP, Zahm DS. Sources of input to the rostromedial tegmental nucleus, ventral tegmental area, and lateral habenula compared: a study in rat. J Comp Neurol. 2015;523:2426–2456. doi: 10.1002/cne.23797. [DOI] [PMC free article] [PubMed] [Google Scholar]