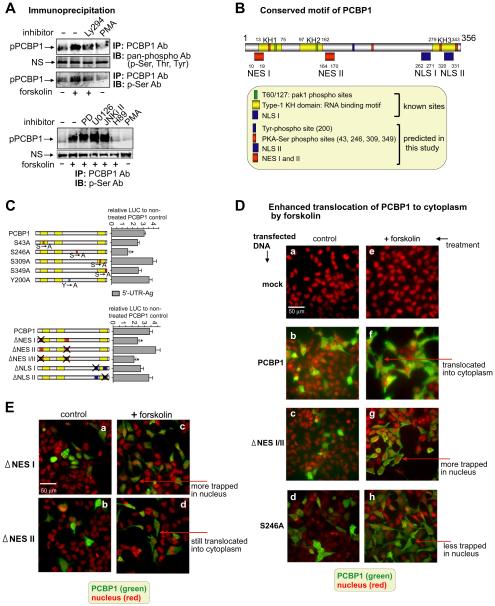
Fig. 5.
Forskolin treatment enhances serine phosphorylation of PCBP1 as analyzed by immunoprecipitation. A) The upper set of gel images shows the enhanced phosphorylation of PCBP1 with forskolin treatment by immunoprecipitation (IP) with antibody to PCBP1 and immunoblotting (IB) with antibody to pan-phospho. The second gel image shows that the nonspecific (NS) band used as the control is unchanged. The third gel image shows the increase in serine phosphorylation of PCBP1 with forskolin treatment detected with p-Ser antibody. Ly294 blocks the phosphorylation, and the basal level of phosphorylation was slightly decreased by treatment with only phorbol-12-myristate-13-acetate (PMA), the activator of PKC. The lower set of gel images show that an inhibitor of PKA, H89, blocks the serine phosphorylation of PCBP1 induced by forskolin although other inhibitors do not block the phosphorylation. PMA alone, used as a control, did not show any change in PCBP1 phosphorylation. B) Schematic representation of PCBP1. Numbers near each motif's symbol indicate the locations of conserved motifs, details of which are described in the box. C) Analysis of mutations of PCBP1 in 5′-UTR-Ag containing the rpL32 site. As seen in the upper panel, potential phosphorylation sites of PCBP1 were mutated as indicated and analyzed for their LUC reporter activities compared to wild-type PCBP1-transfectant. “S → A” and “Y → A” on the phosphorylation sites indicate the locations of amino acids mutated to alanine residues. In the lower drawing, either nuclear export signals (NES) or nuclear localization signals (NLS) sites were mutated as indicated and their relative reporter activities were analyzed as above. All samples were treated with forskolin. X indicates mutated sites. D) Cytoplasmic translocation of PCBP1 was enhanced by forskolin. Plasmid DNA from PCBP1, ΔNES I/II, and S246A was transfected into NMB cells and treated with forskolin. Myc antibody was used to detect the subcellular location of overexpressed myc-tagged PCBP1 and its mutants in green. Propidium iodide (PI) was used to stain the nuclei in red. In fluorescent image a, the scale bar represents 50 μm. E) Fluorescent images were obtained as described in the above Fig. 5D, except using two PCBP1 mutant plasmids (ΔNES I and ΔNES II).

