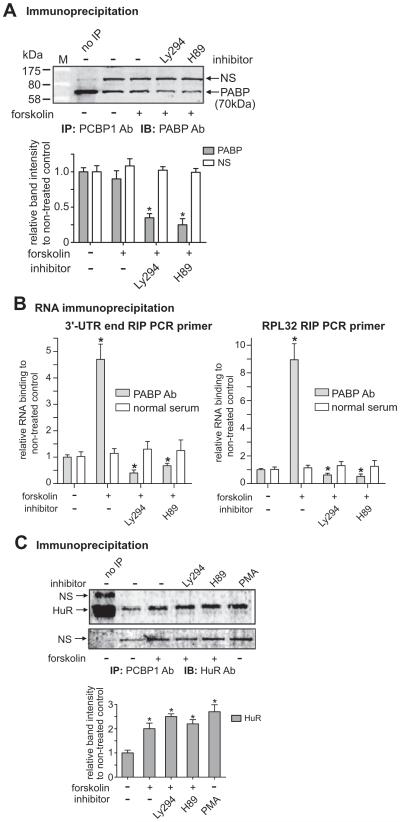
Fig. 6.
Constitutive interaction of PCBP1 with poly(A)-binding protein (PABP) was decreased by co-treatments with H89 as well as Ly294. A) Antibodies of PCBP1 and PABP were used for IP and IB, respectively. The graph shows the band intensities of PABP relative to the NS band. The same sized band was observed in IPs with other antibodies, AUF, PCBP1, and HuR, which suggests that the band represents ribonucleoproteins (RNPs) complex. The steady interaction of PCBP1 with PABP is reduced by co-treatments with Ly294 and H89. M is the Protein MW marker (Bio-Rad, P7708). B) The RIP was performed as in Fig. 2B except with PABP Ab. Two RIP PCR primer sets, 3′-UTR end (left graph) and RPL32 (right graph), were used for the RIPs as indicated. Normal goat serum (normal serum) was used for each control RIP. *P < 0.05 vs. non-treated control. C) The interaction of PCBP1 with HuR, known to be an mRNA stabilizing factor, is increased by forskolin treatment, and the interaction is not changed by co-treatments with Ly294 and H89. Antibodies of PCBP1 and HuR were used with protein extracts of NMB cells for IP and IB, respectively. The graph shows the relative band intensities of HuR compared to that of the non-treated control after normalizing to the respective NS bands (shown in the lower gel image). Cells were co-treated with forskolin and Ly294 or H89 as indicated. *P < 0.05 vs. non-treated control.

