
Figure 1.
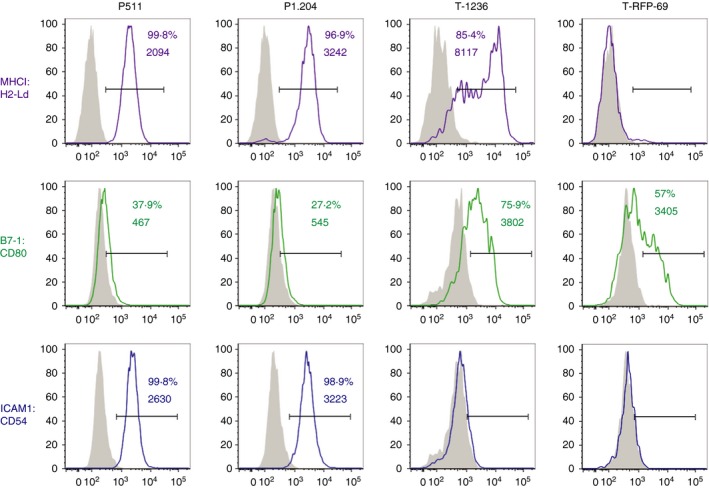
Characteristics of different P1A‐expressing tumour cells. FACS analysis for expression of H‐2Ld, B7.1 (CD80) and ICAM‐1 (CD54) was performed as described in the Material and methods. Numbers correspond to % positive cells and mean fluorescence intensity (MFI) of the positive cells.