

Summary
Objective
Acute neonatal exposure to some, but not all, anticonvulsant drugs induces a profound increase in neuronal apoptosis in rats. Phenobarbital, and phenytoin induce apoptosis at therapeutically-relevant dose range, lamotrigine and carbamazepine do so only at supratherapeutic doses or in polytherapy, and valproate does so even at subtherapeutic doses. Levetiracetam is devoid of pro-apoptotic effects. Retigabine, a new generation drug, acts uniquely by enhancing the M-type potassium current. Because its safety profile in developing animals is unstudied, we sought to determine if retigabine would induce apoptosis.
Methods
Postnatal day (P) 7 rat pups were treated with retigabine (5–30 mg/kg), vehicle (saline), or comparator drugs (phenobarbital, lamotrigine, levetiracetam, or carbamazepine). Cell death was assessed using AminoCupricSilver staining. A separate group of animals was treated repeatedly (3x) with retigabine (15 mg/kg) or vehicle over 24. To establish a pharmacokinetic profile for retigabine, we measured plasma and brain levels after drug treatment.
Results
Consistent with prior studies from us and others, we found phenobarbital induced cell death throughout thalamus, nucleus accumbens and several neocortical areas. By contrast, levetiracetam, lamotrigine, and carbamazepine were found to have no appreciable apoptotic effect on the aforementioned structures. Acute (single) exposure to retigabine, even at doses of 30 mg/kg was also without effect on apoptosis. However, repeated (3x) exposure to retigabine triggered apoptosis in a subset of brain areas. The half-life of retigabine in plasma was 2.5 h, with appreciable concentrations reached in the brain within 1 h of administration.
Significance
These data demonstrate that retigabine, like many other anticonvulsant drugs, is capable of triggering neuronal apoptosis in the developing rat brain. Unlike other drugs, repeated dosing of retigabine was necessary to induce this effect. This may be due to its shorter half-life as compared to other drugs, such as phenobarbital.
Keywords: cell death, neonatal, gestational, teratogen
Introduction
Normal brain development in the perinatal period requires a delicate balance between neurogenesis, synaptogenesis and pruning. These activity-dependent processes may be markedly altered by even brief perturbations in excitation and inhibition. This exquisite sensitivity of the developing brain has raised concerns about the selection and use of anticonvulsant drugs in the perinatal period, making the treatment of seizures in infancy, as well as in pregnant women with epilepsy, a particularly thorny issue in clinical epileptology 1,2.
Data from preclinical models demonstrates that certain anticonvulsant drugs, such as phenobarbital, phenytoin, and valproate, induce an increase in neuronal apoptosis 3–7. This effect, which centers around postnatal day (P) 7 in the developing rat, is marked by a profound increase in the number of apoptotic neurons in the developing cortex, thalamus, basal ganglia, and limbic system. Other drugs, such as carbamazepine, lamotrigine, and topiramate, induce apoptosis only at doses that exceed the therapeutically-relevant range, or as part of polytherapy with other drugs 4–6. Levetiracetam stands alone as one compound apparently devoid of proapoptotic action 6,8.
In addition to the induction of neuronal apoptosis, several of these anticonvulsant drugs (phenobarbital, phenytoin, lamotrigine) also cause profound disruptions in both structural and functional synaptic development 9, and long-term changes in the cortical proteome 10. Anticonvulsant exposure during the postnatal period also induces a host of long-lasting behavioral alterations, including deficits in learning and memory, alterations in anxiety-like behavior, deficits in social interactions, impairments in sensorimotor integration, and a decrease in behavioral flexibility 9,11–17. Across these measures, the ability to induce neuronal apoptosis, even at supratherapeutic doses or in polytherapy, appears to be a good indicator of longer term abnormalities.
Despite the growing attention placed on developmental neurotoxicity associated with anticonvulsant and anesthetic drugs, many anticonvulsant compounds remain unscreened. Retigabine is one such compound. Retigabine is a positive allosteric modulator of KCNQ channels, which mediate the hyperpolarizing M-type potassium current 18,19. By shifting the activation voltage of these channels to more negative potentials, retigabine decreases the likelihood of action potential generation.
Retigabine is currently labeled for adjunctive use in adults with partial onset seizures who have responded inadequately to several alternative treatments, however, given the association of KCNQ channel mutations with benign familial neonatal convulsions 20, exploring the effects of KCNQ modulators on brain development is of further interest.
We recently reported that retigabine is an effective anticonvulsant in neonatal rats at doses as low as 5 mg/kg 21. In the present study, we examined the ability of retigabine to induce neuronal apoptosis in the developing rat brain. We exposed animals to retigabine on P7 and examined the induction of apoptosis on P8 using the AminoCupricSilver method. Data from retigabine were compared to standard reference compounds.
Methods
Animals
Postnatal day (P)7, male Sprague-Dawley rat pups (Harlan, Indianapolis, IN, U.S.A.) were used. Treatments were counterbalanced within and across litters. Pups were born to timed-pregnant dams with P0 designated as the date of parturition. Animals were maintained in a temperature-controlled (21°C) room with a 12 h light cycle. All experiments were approved by the Georgetown University Animal Care and Use Committee.
Drug treatments
Drug treatments were administered intraperitoneally at a volume of 0.01 ml/g. Control groups received equivalent volumes of saline vehicle (0.01 ml/g body weight). Treatments occurred on P7, 24 h before sacrifice, as in prior studies 3–6. An additional group of animals was treated three times (spaced by 4 h) with either retigabine (15 mg/kg) or vehicle to determine the effect of repeated administration.
Drug solutions
Retigabine (given at doses of 5, 15, or 30 mg/kg, ezogabine; D-23129; ethyl N-[2-amino-4-[(4-fluorophenyl)methylamino]phenyl]carbamate) was provided by GlaxoSmithKline (Research Triangle, NC) and dissolved in sterile water containing 0.1% tween-20. Phenobarbital (75 mg/kg, Sigma-Aldrich) was dissolved in 0.9% saline, levetiracetam (200 mg/kg, Keppra, UCB Pharma) was diluted from a stock concentration of 100 mg/ml in normal saline, lamotrigine isethinonate (20 mg/kg, GlaxoSmithKline, Research Triangle NC) was dissolved in normal saline and carbamazepine (100 mg/kg, Sigma-Aldrich) was suspended in saline containing 0.1% tween-20.
Selection of drug doses
The drug doses used were selected to fall within the anticonvulsant range in neonatal rats.
Retigabine
We have previously reported that the minimal effective dose in P7 rats for retigabine is 5 mg/kg, whereas anticonvulsant effects plateau at 15–30 mg/kg 21. Thus, the doses selected (5, 15, and 30 mg/kg) fall at the low, middle and upper end of the anticonvulsant range.
Phenobarbital (positive control)
The dose of phenobarbital is based on prior reports from our group 22,23 and others 24 showing the efficacy of phenobarbital in P7 rats. The dose selected (75 mg/kg) is just below the dose that provides complete suppression against pentylenetetrazole (PTZ)-induced seizures (both minimal and maximal) in P7 rat pups 24. Moreover, this dose of phenobarbital consistently induces a profound increase in neuronal apoptosis 3,4.
Carbamazepine (negative control)
The dose of carbamazepine used (100 mg/kg) was equivalent to twice the highest dose previously shown to protect against maximal PTZ seizures in P7 rats 25. Despite being a high dose of carbamazepine, this dose was previously found to not cause significant neuronal apoptosis in P7 rat pups 4,6.
Lamotrigine (negative control)
The dose of lamotrigine selected (20 mg/kg) falls within the therapeutic range previously described in neonatal animals 26. This dose of lamotrigine does not induce apoptosis in the developing brain 5.
Levetiracetam (negative control)
The dose of levetiracetam selected (250 mg/kg) is well above the therapeutic range we have previously reported in rats 23, which plateaus between 50 and 100 mg/kg when tested against seizures evoked by methyl-6,7-dimethoxy-4-ethyl-β-carboline-3-carboxylate. This dose has been previously reported to be devoid of pro-apoptotic effects 6.
We included carbamazepine, lamotrigine and levetiracetam in part because AminoCupric Silver has not been previously employed to assess toxicity of these compounds. Silver staining has been previously used to examine phenobarbital and phenytoin toxicity.3 Prior reports examining carbamazepine, lamotrigine and levetiracetam have relied on terminal deoxynucleotidyl nick end labeling (TUNEL) staining and/or FluoroJade staining.4–6 These procedures produce similar patterns of labeling; while TUNEL offers the advantage of visualizing degenerating nuclei, silver staining clearly labels both degenerating somata and processes.
Tissue preparation
Twenty-four hours after drug treatment, pups were perfused transcardially with ice-cold phosphate buffer followed by 4% paraformaldehyde. Brains were left in the skull to post-fix for 24–48 h prior to removal and transfer to PBS. Brains were bisected at the midline and one hemisphere was shipped to Neuroscience Associated for histological processing (below).
Amino Cupric Silver staining
Brains were embedded in a MultiBrain block and 40 μm thick coronal sections were collected. Sheets of sections were collected and stained together to ensure consistency of staining across cases and slides. Tissue was pre-impregnated in a mixture of cupric nitrate, silver nitrate, cadmium nitrate, lanthanum nitrate, neutral red, alpha-amino butyric acid, alanine, pyridine, triethanolamine, isopropanol and deionized water at 47°C for 30 min, followed by overnight incubation at room temperature. Following pre-impregnation, sections were incubated in a silver diammine solution (silver nitrate, ethanol, acetone, lithium hydroxide, ammonium hydroxide and deionized water) for 50 min. Sections were reduced in a solution of ethanol, formaldehyde, citric acid and deionized water for 25 min and then bleached in a solution of potassium ferricyanide in potassium chlorate with lactic acid, and then in a solution of potassium permanganate with weak sulfuric acid. Sections were rinsed, fixed with sodium thiosulfate, mounted, stained with neutral red, dehydrated in alcohols, cleared in xylenes and coverslipped with Permount. Sections were returned to Georgetown University for microscopy and analysis.
Microscopy
Consistent with our prior reports, photomicrographs were taken of three sequential sections at 200μm intervals from each brain area. Brain regions were defined using a combination of the developmental atlas of Sherwood and Timeras 27 and the atlas of Ramachandra and Subramanian 28. Regions were selected for analysis based on prior publications from our group and others. While we have previously examined dorsal striatum, a high density of artifactual staining near the lateral ventricle precluded an assessment of this region with the present tissue set. Microscopy was performed by investigators blinded to the treatment of each sample. Quantification of neurodegeneration within each region was performed by counting argyrophilic cells within each photomicrograph. Again, these analyses were performed by investigators blinded to treatment. Counting was performed using IMAGEJ (National Institutes of Health, Bethesda, MD, U.S.A.). Cells were counted only within the anatomic boundaries of the brain regions of interest.
Mass Spectrometry
Plasma samples were extracted and prepared for mass spectrometry analysis. 10 μl of plasma was combined with 390 μl 66% acetonitrile (ACN) containing internal standards and vortexed. 200 μl of the supernatant was then extracted and combined with 800 μl ddH2O and vortexed. 500 μl of the resulting supernatant was then transferred to tubes for run. The standard curve for plasma was obtained through serial dilutions, in which 5 μl each of 1 mg/ml retigabine and its N-acetyl metabolite (NAMR) were added to 990 μl plasma, vortexed and then supernatant was prepared and extracted as above.
Brain samples were extracted and combined with 3x their volume of 50% methanol (MeOH) containing internal standards (this equalled 3 ml MeOH) and then homogenized. Equal volume of ACN (equalled 4 ml ACN) was added to homogenized mixture and vortexed. 500 μl of supernatant was then transferred to tube for run. An additional 200 μl supernatant was combined with 800 μl ddH2O and vortexed. 500 μl was then transferred to tube for run. The standard curve for brain was also obtained through serial dilution. Blank brains were homogenized in 3x volume 50% MeOH containing the internal standards. These were then spiked with retigabine and NAMR (1.65 μl each of the 1 mg/ml solution + 996.7 μl of homogenized brain/MeOH combination) and serially diluted. Supernatant was then prepared and extracted as above.
Samples were injected onto a reverse-phase ACQUITY C18 column using an ACQUITY UPLC system (Waters Corp, Milford MA) with a gradient mobile phase consisting of 2% acetonitrile in water containing 0.1% formic acid (A) and 2% water in acetonitrile containing 0.1% formic acid (B). Each sample was resolved for 10 min at a flow rate of 0.5 ml/min. The column eluent was introduced directly into the mass spectrometer by electrospray. Mass spectroscopy was performed on a Q-TOF Premier (Waters) operating in either negative-ion or positive ion mode. Data were acquired in centroid mode from 50 to 80 m/z in MS scanning. Mass spectrometry data from the UPLC-TOFMS were processed using MassLynx software (Waters Corp, Milford, MA).
Statistics
Statistical comparisons were performed by analysis of variance (ANOVA) followed by Holm-Sidak multiple comparison test with p < 0.05 (one-tailed) indicating statistically significant difference. One-tailed tests were used because of our a priori hypothesis that these drugs would induce neuronal apoptosis, a hypothesis well-justified based on prior literature. For repeated retigabine studies, data were analyzed using the nonparametric Mann-Whitney test. For parametric tests, the ROUT outlier procedure was applied, resulting in the removal of one sample each from the phenobarbital, retigabine 5, vehicle, and carbamazepine groups, and two samples from the retigabine 30 groups. GraphPad Prism was used for these analyses.
Results
As shown in Figure 1, retigabine at doses of 5, 15, or 30 mg/kg did not induce apoptosis in orbitofrontal cortex. By contrast, phenobarbital (75 mg/kg) significantly increased the number of apoptotic neurons (1.6-fold over vehicle), consistent with prior reports. Further consistent with our prior reports, lamotrigine, levetiracetam, and carbamazepine failed to induce neuronal apoptosis. These effects were shown by ANOVA, which revealed a significant effect of treatment [F(7,52)=3.72, P=0.0025], with Holm-Sidak corrected planned comparisons showing a significant group difference only between phenobarbital and control (P=0.00015).
Figure 1. Profile of cell death induced in orbitofrontal cortex.

(A) Number of silver stained neurons as a function of treatment: vehicle (VEH), retigabine (RTG, 5, 15, and 30 mg/kg), phenobarbital (PB, 75 mg/kg), lamotrigine (LTG, 20 mg/kg), levetiracetam (LEV, 200 mg/kg), and carbamazepine (CBZ, 100 mg/kg). * indicates significantly (P<0.05) greater than VEH. (B) Atlas plane showing the approximate location of the region analyzed, with location relative to bregma. (C) Representative photomicrographs for each treatment. rf = rhinal fissure. Bars show means + standard error of the mean.
We next examined induction of apoptosis in the nucleus accumbens (Fig 2). We have previously reported that this area displays one of the highest basal levels of apoptosis in P7/P8 rats 4. Moreover, this region receives strong inputs from the orbitofrontal cortex. As was seen in the orbitofrontal cortex, only phenobarbital, and not retigabine, lamotrigine, levetiracetam or carbamazepine, induced a significant increase in the number of apoptotic cells (2.4-fold, phenobarbital vs. vehicle). ANOVA revealed a marginally significant effect of treatment (F7,53=2.144) with Holm-Sidak corrected planned comparisons revealing a group difference only between phenobarbital and vehicle (P=0.0095).
Figure 2. Profile of cell death induced in the nucleus accumbens.

(A) Number of silver stained neurons as a function of treatment: vehicle (VEH), retigabine (RTG, 5, 15, and 30 mg/kg), phenobarbital (PB, 75 mg/kg), lamotrigine (LTG, 20 mg/kg), levetiracetam (LEV, 200 mg/kg), and carbamazepine (CBZ, 100 mg/kg). * indicates significantly (P<0.05) greater than VEH. (B) Atlas plane showing the approximate location of the region analyzed. (C) Representative photomicrographs for each treatment, with location relative to bregma. ac = anterior commissure is outlined in each section. Bars show means + standard error of the mean.
Degeneration in thalamus after anticonvulsant drug exposure has been well described for phenobarbital, phenytoin, valproate, and other compounds. Here, we examined two subregions of thalamus (ventromedial = Fig 3B, and laterodorsal = Fig 3C). These regions have strong reciprocal projections with limbic brain regions, and also encompass sites of somatosensory input to the thalamus. As with the regions in Fig 1 and 2, retigabine did not induce neuronal apoptosis in thalamus after a single exposure on P7. Similarly, lamotrigine, levetiracetam and carbamazepine were without effect. By contrast, phenobarbital significantly increased neuronal apoptosis in both regions (4-fold in laterodorsal thalamus, 2-fold in ventromedial thalamus). ANOVA revealed main effects of treatment for both regions [F(7,54)=2.889, P=0.012 for laterodorsal thalamus; F(7,53)=2.656, P=0.020 for ventromedial thalamus]. Holm-Sidak corrected planned comparisons indicated that phenobarbital increased apoptosis as compared to vehicle (P=0.036 for ventromedial thalamus, P=0.0046 for laterodorsal thalamus).
Figure 3. Profile of cell death induced in the thalamus.
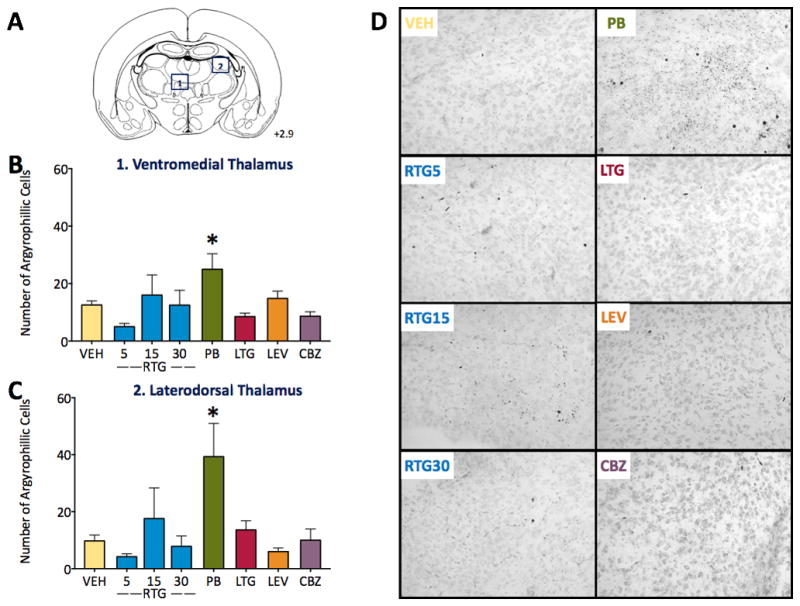
(A) Atlas plane showing the approximate location of the region analyzed, with location relative to bregma. (B) Number of silver stained neurons in ventromedial thalamus as a function of treatment: vehicle (VEH), retigabine (RTG, 5, 15, and 30 mg/kg), phenobarbital (PB, 75 mg/kg), lamotrigine (LTG, 20 mg/kg), levetiracetam (LEV, 200 mg/kg), and carbamazepine (CBZ, 100 mg/kg). (C) Number of silver stained neurons in laterodorsal thalamus, abbreviations as in (B). (D) Representative photomicrographs of ventromedial thalamus for each treatment. * indicates significantly (P<0.05) greater than VEH. Bars show means + standard error of the mean.
To determine if efferent and afferent cortical regions of the thalamic subregions examined in Fig 3 also displayed a similar profile of apoptosis, we next turned to frontal cortex. As shown in Fig 4, retigabine failed to induce apoptosis in either cingulate cortex (Fig 4B) or primary motor cortex (Fig 4C). By contrast, phenobarbital induced a significant increase in both regions (1.8-fold in cingulate, 2.8-fold in motor cortex). Consistent with the other brain regions examined, lamotrigine, carbamazepine, and levetiracetam also did not induce apoptosis. These effects were examined by ANOVA, which revealed a significant main effect of treatment [F(7,53)=2.745, P=0.0165 for cingulate; F(7,53)=4.276, P=0.0008 for motor cortex]. Holm-Sidak corrected planned comparisons showed this effect to be mediated by a significant difference between phenobarbital and vehicle groups (P=0.0227 and 0.00015 for cingulate and motor cortex, respectively).
Figure 4. Profile of cell death induced in the frontal (motor) and cingulate cortices.

(A) atlas plane showing the approximate location of the region analyzed. (B) Number of silver stained neurons in cingulate cortex as a function of treatment: vehicle (VEH), retigabine (RTG, 5, 15, and 30 mg/kg), phenobarbital (PB, 75 mg/kg), lamotrigine (LTG, 20 mg/kg), levetiracetam (LEV, 200 mg/kg), and carbamazepine (CBZ, 100 mg/kg). (C) Number of silver stained neurons in motor cortex, abbreviations as in (B). (D) Representative photomicrographs for each treatment in motor cortex. * indicates significantly (P<0.05) greater than VEH. Bars show means + standard error of the mean.
We finally examined induction of apoptosis in retrosplenial (Fig 5A) and somatosensory (Fig 5B) cortices. The profile of apoptosis mirrored that seen in all other brain regions: retigabine, lamotrigine, levetiracetam, and carbamazepine failed to induce neuronal apoptosis, while phenobarbital significantly increased cell death. In the somatosensory cortex, phenobarbital induced a 2.6-fold increase in apoptosis (Main effect of treatment: F7,54=3.631, P=0.0028, Planned comparison versus vehicle: P=0.0009). In the retrosplenial cortex, phenobarbital induced a 2.4-fold increase (Main Effect: F7,53=2.47, P=0.0286, Planned comparison versus vehicle: P=0.0129).
Figure 5. Profile of cell death induced in the retrosplenial and somatosensory cortices.

(A) atlas plane showing the approximate location of the region analyzed. (B) Number of silver stained neurons in retrosplenial cortex as a function of treatment: vehicle (VEH), retigabine (RTG, 5, 15, and 30 mg/kg), phenobarbital (PB, 75 mg/kg), lamotrigine (LTG, 20 mg/kg), levetiracetam (LEV, 200 mg/kg), and carbamazepine (CBZ, 100 mg/kg). (C) Number of silver stained neurons in somatosensory cortex, abbreviations as in (B). (D) Representative photomicrographs for each treatment in retrosplenial cortex. * indicates significantly (P<0.05) greater than VEH. Bars show means + standard error of the mean.
We examined the plasma and brain levels of retigabine after a single dose on P7. In the adult animal, the half-life for retigabine is reported to be ~2h. The half-life in neonatal rats had not been previously examined. To determine if the lack of effect in the above experiments was due to rapid clearance of retigabine, we examined retigabine levels in plasma and brain after treatment with 5, 15, or 30 mg/kg. As shown in Supporting Table 1, retigabine concentrations peaked 1–2h after IP administration. Retigabine was cleared with a half-life of 2.2–2.5 h. We were unable to generate a fit for 5 mg/kg data, so half-life and Vd are not reported for this dose. Consistent with the large plasma Vd, retigabine reached appreciable concentrations in brain (330, 1296, and 2013 ng/ml of tissue for 5, 15, and 30 mg/kg respectively). Concentrations in plasma (in ng/ml) fall within the range previously reported for humans.
Because of this short half-life, we next sought to determine if repeated administration of retigabine would induce an effect where a single administration failed to do so. We examined the same regions as in Fig 1–5, this time after 3 exposures over a 12 h period. This dosing interval was selected based on the T1/2 described in Supporting Table 1. We found that 3 x 15 mg/kg of retigabine induced a significant increase in apoptosis in laterodorsal thalamus (Fig 6A, Mann Whitney U = 8.5, P=0.021), cingulate cortex (Fig 6B, U=2, P=0.0087), primary motor cortex (Fig 6C, U=10.5, P=0.043), retrosplenial cortex (Fig 6D, U=11, P=0.025), and somatosensory cortex (Fig 6E, U=9, P=0.0472). No significant increase was found in orbitofrontal cortex, nucleus accumbens, and ventromedial thalamus (Ps = 0.24, 0.17, and 0.07, respectively). Thus, repeated administration induced a significant increase in apoptosis in a subset of regions examined. While we did not measure pharmacokinetics with this repeated administration, modeling of half-life and plasma concentrations indicate that it is unlikely that the Cmax seen in the repeated paradigm met or exceeded that seen with an acute 30 mg/kg dose. Thus, we favor the interpretation that extended duration of exposure, rather than higher peak levels, was the major contributor to apoptosis seen with repeated, but not acute retigabine.
Figure 6. Profile of cell death induced by repeated retigabine administration.

(A) Graph showing number of silver-stained neurons in dorsolateral thalamus after vehicle (VEH) or retigabine (RTG 3 x 15 mg/kg) treatment. Panels below show representative photomicrographs. Similar profiles are shown for (B) cingulate cortex, (C) motor cortex, (D) retrosplenial cortex and (E) somatosensory cortex. * indicates significantly (P<0.05) greater than VEH. Bars show means + standard error of the mean.
Discussion
Here we have shown that repeated, but not acute, administration of the new-generation anticonvulsant drug retigabine induces neuronal apoptosis in a subset of vulnerable regions in the developing rat brain. Similar to prior studies from our group, and from others, we confirmed that phenobarbital triggered apoptosis, but neither lamotrigine, levetiracetam, nor carbamazepine did so 4–8. These data extend our knowledge of the effects of diverse anticonvulsant drug classes on the developing brain.
Retigabine and phenobarbital are not alone in their ability to induce neuronal apoptosis; phenytoin, valproate, vigabatrin, and benzodiazepines induce neuronal apoptosis at therapeutically relevant concentrations 3,4. Moreover, high (supratherapeutic) doses of lamotrigine 5, carbamazepine and topiramate do so as part of polytherapy,6 and anesthetic agents and alcohol 29–31, do so as well. Indeed, it appears to be the rule, rather than the exception, for drugs that reduce neuronal excitability to have this effect during brain development. The one notable exception is levetiracetam, which is devoid of these effects.
The present study extends the mechanism of action by which enhanced neuronal apoptosis can occur during neonatal development. Prior classes of drugs examined include positive allosteric modulators of GABA receptor function, blockers of voltage gated calcium channels, and NMDA receptor antagonists, amongst others. Here, we show that activation of the M-type potassium current can also trigger this effect.
The pro-apoptotic effect of retigabine occurred with doses that produce plasma levels within the high range of those reported in humans 32. Clinically, retigabine is dosed multiple times daily in humans (e.g., 200–400 mg PO tid), due to its short half-life 32. Thus, the repeated administration we employed in the present study may be a clinically relevant exposure. We found that retigabine rapidly reached appreciable levels in the brain after administration in neonatal rats. The half-life of retigabine in P7 rat pups (~2 h) matches closely the half-life reported in adult animals 33. This half-life is substantially shorter than that reported in humans (~6–7 h), raising the possibility that even a single dose in humans may have a similar effect 32. Indeed, in the case of ethanol exposure in neonatal animals, prolonged elevation of blood levels are required to trigger apoptosis. Ikonomidou and colleagues reported that for ethanol, an elevation of blood alcohol concentrations above 200 mg/dl for at least four hours was required to trigger appreciable apoptotic neurodegeneration 30. Thus, pharmacokinetic issues associated with drug administration in the neonatal brain must be taken into account when assessing the profile of toxicity or safety.
Most of the anticonvulsant drugs that have been examined for pro-apoptotic effects have half-lives that are quite long. For example, phenobarbital has reported half-life values ranging from 9–20 hours in the rat, while phenytoin (which displays nonlinear pharmacokinetics) has half-life values ranging from 1–8 hours (note that the pro-apoptotic doses are higher doses and would be expected to have half-lives toward the upper end of this range) 34. For drugs such as lamotrigine, half-life is likely not to be a concern, as half-lives in rats have been reported in the range of 12–30 hours 34. By contrast, for other drugs, such as carbamazepine, and levetiracetam, which have half-lives under 4 hours in rats 34, this may be an important consideration. In the case of levetiracetam, one report 7 performed repeated dosing to address this concern, and consistent with acute administration, levetiracetam was still without effect on the induction of neuronal apoptosis. Similar studies have not been performed for carbamazepine. Moreover, many newer anticonvulsant drugs (e.g., pregabalin, tiagabine, gabapentin) which have yet to be examined for the induction of neuronal apoptosis display short half-lives (on the order of 2–3 hrs in rats; 34); for these drugs, examining repeated administration will be quite important. It is worth noting that the half-lives of these compounds may differ substantially between species (human, rat, mouse), and even by age within species.35 Moreover, many (but not all) anticonvulsant drugs display increased clearance during pregnancy, which presents not only a complication for seizure control but also has implications for adverse effects of anticonvulsant exposure on fetal development.36,37 For example, increased dosing frequency to overcome clearance rates, and/or higher doses to achieve the same goal may or may not result in increased fetal exposure. This is an area of investigation that is in great need of further study both in clinical populations and experimental models.
The primary metabolites of retigabine are a n-glucuronide and an n-acetylated metabolite, the latter of which has been reported to display pharmacological activity 38. In both humans and rodents, the n-acetyl metabolite is generated in appreciable concentrations 39. Thus, the degree to which this metabolite may contribute to any developmental toxicity remains to be explored. It is worth noting that the contribution of neuroactive metabolites to anticonvulsant-drug induced developmental neurotoxicity is wholly unexplored.
KCNQ2 channels, one of the main targets of retigabine, are expressed widely throughout the brain, including in the nucleus accumbens, ventrolateral and laterodorsal thalamus, and are prominent in cortical areas such as the retrosplenial cortex 40. A similar pattern of expression has been reported for KCNQ3 channels, the other primary target of retigabine action 41. Interestingly, the level of expression of KCNQ channels increases with time in the retrosplenial cortex, reaching maximal levels in post-weaning rats. Despite the lower level of KCNQ channel expression in younger animals, repeated retigabine administration was able to induce apoptosis in the retrosplenial cortex of neonatal animals.
An open question in the field is the degree to which induction of neuronal apoptosis (or the lack thereof) predicts other toxicities. For example, phenobarbital and lamotrigine, when given at doses below those needed to induce cell death, trigger changes in synaptic maturation 9. Similarly, chronic (P7–P14) exposure to lamotrigine at a dose that does not trigger apoptosis does produce alterations in adult behavior 14. To date, retigabine has not been examined for effects on CNS function (either at the synaptic level or the behavioral level). The profile of neuronal apoptosis (e.g., sensory thalamus, motor cortex, somatosensory cortex) we found after early life retigabine exposure in the present study point towards sensorimotor domains as an important area for investigation. Examination of the long-term effects of retigabine on nervous system function is an important next step in determining its preclinical safety profile for the developing brain. Perhaps, more importantly, given retigabine’s reported profile of abnormal pigmentation in the retina and skin 42, the present data indicate that KCNQ-acting drugs have the potential to trigger neuronal apoptosis during development; this may be of particular importance when and if future KCNQ-acting compounds reach the market.
Key Point Box.
Acute retigabine exposure does not induce neuronal apoptosis
Repeated administration induces neuronal apoptosis
This profile differs from drugs such as phenobarbital
Acknowledgments
We thank Dr. Robert Switzer and the staff at Neuroscience Associates for their excellent histological services. This work was supported by a research grant from GlaxoSmithKline to AK and PAF. PAF also received support from HD046388 and KL2TR001432. We thank Dr. Amrita Cheema and Karen Luo of the Proteomics and Metabolomics Shared Resource at Georgetown (Core Support from P30CA051008) for assistance with mass spectroscopy.
Footnotes
Disclosure of Conflicts of Interest
No authors report conflicts of interest.
Ethical Publication Statement
We confirm that we have read the Journal’s position on issues involved in ethical publication and affirm that this report is consistent with those guidelines.
References
- 1.Gedzelman E, Meador K. Neurological and psychiatric sequelae of developmental exposure to antiepileptic drugs. Front Neur. 2012;3:182. doi: 10.3389/fneur.2012.00182. [DOI] [PMC free article] [PubMed] [Google Scholar]
- 2.Turski CA, Ikonomidou C. Neuropathological sequelae of developmental exposure to antiepileptic and anesthetic drugs. Front Neur. 2012;3:120. doi: 10.3389/fneur.2012.00120. [DOI] [PMC free article] [PubMed] [Google Scholar]
- 3.Bittigau P, Sifringer M, Genz K, et al. Antiepileptic drugs and apoptotic neurodegeneration in the developing brain. Proc Natl Acad Sci U S A. 2002;99:15089–94. doi: 10.1073/pnas.222550499. [DOI] [PMC free article] [PubMed] [Google Scholar]
- 4.Forcelli PA, Kim J, Kondratyev A, Gale K. Pattern of antiepileptic drug-induced cell death in limbic regions of the neonatal rat brain. Epilepsia. 2011;52:e207–11. doi: 10.1111/j.1528-1167.2011.03297.x. [DOI] [PMC free article] [PubMed] [Google Scholar]
- 5.Katz I, Kim J, Gale K, Kondratyev A. Effects of lamotrigine alone and in combination with MK-801, phenobarbital, or phenytoin on cell death in the neonatal rat brain. J Pharmacol Exp Ther. 2007;322:494–500. doi: 10.1124/jpet.107.123133. [DOI] [PubMed] [Google Scholar]
- 6.Kim J, Kondratyev A, Gale K. Antiepileptic drug-induced neuronal cell death in the immature brain: effects of carbamazepine, topiramate, and levetiracetam as monotherapy versus polytherapy. J Pharmacol Exp Ther. 2007;323:165–73. doi: 10.1124/jpet.107.126250. [DOI] [PubMed] [Google Scholar]
- 7.Kim J, Kondratyev A, Tomita Y, Gale K. Neurodevelopmental impact of antiepileptic drugs and seizures in the immature brain. Epilepsia. 2007;48(Suppl 5):19–26. doi: 10.1111/j.1528-1167.2007.01285.x. [DOI] [PubMed] [Google Scholar]
- 8.Manthey D, Asimiadou S, Stefovska V, et al. Sulthiame but not levetiracetam exerts neurotoxic effect in the developing rat brain. Exp Neurol. 2005;193:497–503. doi: 10.1016/j.expneurol.2005.01.006. [DOI] [PubMed] [Google Scholar]
- 9.Forcelli PA, Janssen MJ, Vicini S, Gale K. Neonatal exposure to antiepileptic drugs disrupts striatal synaptic development. Ann Neurol. 2012;72:363–72. doi: 10.1002/ana.23600. [DOI] [PMC free article] [PubMed] [Google Scholar]
- 10.Kaindl AM, Koppelstaetter A, Nebrich G, et al. Brief alteration of NMDA or GABAA receptor-mediated neurotransmission has long term effects on the developing cerebral cortex. Mol Cell Proteomics. 2008;7:2293–310. doi: 10.1074/mcp.M800030-MCP200. [DOI] [PubMed] [Google Scholar]
- 11.Bhardwaj SK, Forcelli PA, Palchik G, Gale K, Srivastava LK, Kondratyev A. Neonatal exposure to phenobarbital potentiates schizophrenia-like behavioral outcomes in the rat. Neuropharmacology. 2012;62:2337–45. doi: 10.1016/j.neuropharm.2012.02.001. [DOI] [PMC free article] [PubMed] [Google Scholar]
- 12.Forcelli PA, Gale K, Kondratyev A. Early postnatal exposure of rats to lamotrigine, but not phenytoin, reduces seizure threshold in adulthood. Epilepsia. 2011;52:e20–2. doi: 10.1111/j.1528-1167.2010.02971.x. [DOI] [PMC free article] [PubMed] [Google Scholar]
- 13.Forcelli PA, Janssen MJ, Stamps LA, Sweeney C, Vicini S, Gale K. Therapeutic strategies to avoid long-term adverse outcomes of neonatal antiepileptic drug exposure. Epilepsia. 2010;51(Suppl 3):18–23. doi: 10.1111/j.1528-1167.2010.02603.x. [DOI] [PMC free article] [PubMed] [Google Scholar]
- 14.Forcelli PA, Kozlowski R, Snyder C, Kondratyev A, Gale K. Effects of neonatal antiepileptic drug exposure on cognitive, emotional, and motor function in adult rats. J Pharmacol Exp Ther. 2012;340:558–66. doi: 10.1124/jpet.111.188862. [DOI] [PMC free article] [PubMed] [Google Scholar]
- 15.Gutherz SB, Kulick CV, Soper C, Kondratyev A, Gale K, Forcelli PA. Brief postnatal exposure to phenobarbital impairs passive avoidance learning and sensorimotor gating in rats. Epilepsy Behav. 2014;37:265–9. doi: 10.1016/j.yebeh.2014.07.010. [DOI] [PMC free article] [PubMed] [Google Scholar]
- 16.Mikulecká A, Subrt M, Pařízková M, Mareš P, Kubová H. Consequences of early postnatal benzodiazepines exposure in rats. II. Social behavior. Front Behav Neurosci. 2014;8:169. doi: 10.3389/fnbeh.2014.00169. [DOI] [PMC free article] [PubMed] [Google Scholar]
- 17.Mikulecká A, Subrt M, Stuchlík A, Kubová H. Consequences of early postnatal benzodiazepines exposure in rats. I. Cognitive-like behavior. Front Behav Neurosci. 2014;8:101. doi: 10.3389/fnbeh.2014.00101. [DOI] [PMC free article] [PubMed] [Google Scholar]
- 18.Rundfeldt C. The new anticonvulsant retigabine (D-23129) acts as an opener of K+ channels in neuronal cells. Eur J Pharmacol. 1997;336:243–9. doi: 10.1016/s0014-2999(97)01249-1. [DOI] [PubMed] [Google Scholar]
- 19.Tatulian L, Delmas P, Abogadie FC, Brown DA. Activation of expressed KCNQ potassium currents and native neuronal M-type potassium currents by the anti-convulsant drug retigabine. J Neurosci. 2001;21:5535–45. doi: 10.1523/JNEUROSCI.21-15-05535.2001. [DOI] [PMC free article] [PubMed] [Google Scholar]
- 20.Singh NA, Charlier C, Stauffer D, et al. A novel potassium channel gene, KCNQ2, is mutated in an inherited epilepsy of newborns. Nat Genet. 1998;18:25–9. doi: 10.1038/ng0198-25. [DOI] [PubMed] [Google Scholar]
- 21.Forcelli PA, Soper C, Lakhkar A, Gale K, Kondratyev A. Anticonvulsant effect of retigabine during postnatal development in rats. Epilepsy Res. 2012;101:135–40. doi: 10.1016/j.eplepsyres.2012.03.006. [DOI] [PubMed] [Google Scholar]
- 22.Forcelli PA, Soper C, Duckles A, Gale K, Kondratyev A. Melatonin potentiates the anticonvulsant action of phenobarbital in neonatal rats. Epilepsy Res. 2013;107:217–23. doi: 10.1016/j.eplepsyres.2013.09.013. [DOI] [PMC free article] [PubMed] [Google Scholar]
- 23.Kulick CV, Gutherz SB, Beck VC, Medvedeva N, Soper C, Forcelli PA. Profile of anticonvulsant action of levetiracetam, tiagabine and phenobarbital against seizures evoked by DMCM (methyl-6,7-dimethoxy-4-ethyl-β-carboline-3-carboxylate) in neonatal rats. Eur J Pharmacol. 2014;743:63–8. doi: 10.1016/j.ejphar.2014.09.016. [DOI] [PMC free article] [PubMed] [Google Scholar]
- 24.Kubova H, Mares P. Anticonvulsant effects of phenobarbital and primidone during ontogenesis in rats. Epilepsy Res. 1991;10:148–55. doi: 10.1016/0920-1211(91)90007-3. [DOI] [PubMed] [Google Scholar]
- 25.Kubová H, Mares P. Anticonvulsant action of oxcarbazepine, hydroxycarbamazepine, and carbamazepine against metrazol-induced motor seizures in developing rats. Epilepsia. 1993;34:188–92. doi: 10.1111/j.1528-1157.1993.tb02397.x. [DOI] [PubMed] [Google Scholar]
- 26.Stanková L, Kubová H, Mares P. Anticonvulsant action of lamotrigine during ontogenesis in rats. Epilepsy Res. 1992;13:17–22. doi: 10.1016/0920-1211(92)90003-c. [DOI] [PubMed] [Google Scholar]
- 27.Sherwood N, Timiras P. A Stereotaxic Atlas of the Developing Rat Brain. Berkeley, CA: University of California Press; 1970. [Google Scholar]
- 28.Ramachandra R, Subramanian T. Atlas of the neonatal rat brain. Boca Raton, FL: CRC Press; 2011. p. 164. [Google Scholar]
- 29.Ikonomidou C, Bosch F, Miksa M, et al. Blockade of NMDA receptors and apoptotic neurodegeneration in the developing brain. Science. 1999;283:70–4. doi: 10.1126/science.283.5398.70. [DOI] [PubMed] [Google Scholar]
- 30.Ikonomidou C, Bittigau P, Ishimaru MJ, et al. Ethanol-induced apoptotic neurodegeneration and fetal alcohol syndrome. Science. 2000;287:1056–60. doi: 10.1126/science.287.5455.1056. [DOI] [PubMed] [Google Scholar]
- 31.Jevtovic-Todorovic V, Hartman RE, Izumi Y, et al. Early exposure to common anesthetic agents causes widespread neurodegeneration in the developing rat brain and persistent learning deficits. J Neurosci. 2003;23:876–82. doi: 10.1523/JNEUROSCI.23-03-00876.2003. [DOI] [PMC free article] [PubMed] [Google Scholar]
- 32.Tompson DJ, Crean CS, Reeve R, Berry NS. Efficacy and Tolerability Exposure–Response Relationship of Retigabine (Ezogabine) Immediate-Release Tablets in Patients With Partial-Onset Seizures. Clinical Therapeutics. 2013;35:1174–85. e4. doi: 10.1016/j.clinthera.2013.06.012. [DOI] [PubMed] [Google Scholar]
- 33.Mazarati A, Wu J, Shin D, Kwon YS, Sankar R. Antiepileptogenic and antiictogenic effects of retigabine under conditions of rapid kindling: an ontogenic study. Epilepsia. 2008;49:1777–86. doi: 10.1111/j.1528-1167.2008.01674.x. [DOI] [PMC free article] [PubMed] [Google Scholar]
- 34.Löscher W. The pharmacokinetics of antiepileptic drugs in rats: consequences for maintaining effective drug levels during prolonged drug administration in rat models of epilepsy. Epilepsia. 2007;48:1245–58. doi: 10.1111/j.1528-1167.2007.01093.x. [DOI] [PubMed] [Google Scholar]
- 35.Markowitz GJ, Kadam SD, Boothe DM, Irving ND, Comi AM. The pharmacokinetics of commonly used antiepileptic drugs in immature CD1 mice. Neuroreport. 2010;21:452–6. doi: 10.1097/wnr.0b013e328338ba18. [DOI] [PMC free article] [PubMed] [Google Scholar]
- 36.Reisinger TL, Newman M, Loring DW, Pennell PB, Meador KJ. Antiepileptic drug clearance and seizure frequency during pregnancy in women with epilepsy. Epilepsy Behav. 2013;29:13–8. doi: 10.1016/j.yebeh.2013.06.026. [DOI] [PMC free article] [PubMed] [Google Scholar]
- 37.Pennell PB. Antiepileptic drug pharmacokinetics during pregnancy and lactation. Neurology. 2003;61:S35–42. doi: 10.1212/wnl.61.6_suppl_2.s35. [DOI] [PubMed] [Google Scholar]
- 38.Bialer M, Johannessen SI, Kupferberg HJ, Levy RH, Loiseau P, Perucca E. Progress report on new antiepileptic drugs: a summary of the Sixth Eilat Conference (EILAT VI) Epilepsy Res. 2002;51:31–71. doi: 10.1016/s0920-1211(02)00106-7. [DOI] [PubMed] [Google Scholar]
- 39.Hermann R, Knebel NG, Niebch G, Richards L, Borlak J, Locher M. Pharmacokinetic interaction between retigabine and lamotrigine in healthy subjects. Eur J Clin Pharmacol. 2003;58:795–802. doi: 10.1007/s00228-003-0558-6. [DOI] [PubMed] [Google Scholar]
- 40.Weber YG, Geiger J, Kämpchen K, Landwehrmeyer B, Sommer C, Lerche H. Immunohistochemical analysis of KCNQ2 potassium channels in adult and developing mouse brain. Brain Res. 2006;1077:1–6. doi: 10.1016/j.brainres.2006.01.023. [DOI] [PubMed] [Google Scholar]
- 41.Geiger J, Weber YG, Landwehrmeyer B, Sommer C, Lerche H. Immunohistochemical analysis of KCNQ3 potassium channels in mouse brain. Neurosci Lett. 2006;400:101–4. doi: 10.1016/j.neulet.2006.02.017. [DOI] [PubMed] [Google Scholar]
- 42.Center for Drug Evaluation and Research. Drug Safety and Availability - FDA Drug Safety Communication: FDA approves label changes for anti-seizure drug Potiga (ezogabine) describing risk of retinal abnormalities, potential vision loss, and skin discoloration [Internet] 2013 [cited 2015 Nov 23]. Available from: http://www.fda.gov/Drugs/DrugSafety/ucm372774.htm.