

ABSTRACT
Erythrocytosis is driven mainly by erythropoietin, which is regulated by hypoxia-inducible factor (HIF). Mutations in HIF prolyl 4-hydroxylase 2 (HIF-P4H-2) (PHD2/EGLN1), the major downregulator of HIFα subunits, are found in familiar erythrocytosis, and large-spectrum conditional inactivation of HIF-P4H-2 in mice leads to severe erythrocytosis. Although bone marrow is the primary site for erythropoiesis, spleen remains capable of extramedullary erythropoiesis. We studied HIF-P4H-2-deficient (Hif-p4h-2gt/gt) mice, which show slightly induced erythropoiesis upon aging despite nonincreased erythropoietin levels, and identified spleen as the site of extramedullary erythropoiesis. Splenic hematopoietic stem cells (HSCs) of these mice exhibited increased erythroid burst-forming unit (BFU-E) growth, and the mice were protected against anemia. HIF-1α and HIF-2α were stabilized in the spleens, while the Notch ligand genes Jag1, Jag2, and Dll1 and target Hes1 became downregulated upon aging HIF-2α dependently. Inhibition of Notch signaling in wild-type spleen HSCs phenocopied the increased BFU-E growth. HIFα stabilization can thus mediate non-erythropoietin-driven splenic erythropoiesis via altered Notch signaling.
KEYWORDS: erythrocytosis, hypoxia, hypoxia-inducible factor prolyl-4-hydroxylase 2, spleen
INTRODUCTION
Erythrocytosis, defined as an absolute increase in red cell mass, is associated with increased hematocrit and hemoglobin values. Erythropoietin (EPO) stimulates erythropoiesis by binding to the EPO receptor (EPOR) on hematopoietic progenitors to promote erythroid differentiation, survival, and proliferation (1, 2). Classically, erythrocytosis is classified as either primary, caused by intrinsic defects in erythroid progenitor cells in the presence of normal or low serum EPO levels, or secondary. The causes of primary erythrocytosis include mutations in the Janus kinase 2 (JAK2) and EPOR genes, which can lead to EPO-independent proliferation of erythroid precursors or hypersensitivity to EPO (3). Secondary erythrocytosis is due to defects in the oxygen-sensing pathway, including mutations in the genes for hypoxia-inducible factor (HIF) prolyl 4-hydroxylase 2 (HIF-P4H-2/PHD2/EGLN1), HIF-2α, and von Hippel Lindau (VHL) protein, and impaired oxygen delivery or tissue hypoxia, all associated with the activation of the EPO pathway and elevated serum EPO levels (3–5).
During human development, the bone marrow becomes a functional site for hematopoiesis in the fetus at 4 to 5 months, whereas in mice, bone marrow hematopoiesis becomes active after birth (6). To supply oxygen for the needs of the developing fetus, nonmarrow tissues, such as the spleen and liver, serve as sites of extramedullary hematopoiesis (6). In the case of mice, the spleen remains a hematopoietic organ throughout their lives albeit at low levels (7).
HIF regulates the expression of a large number of genes, many of which are involved in erythropoiesis (8–10). HIF-P4H-1 to -3 are central regulators of the hypoxia response (8–10). They hydroxylate one or two prolyl residues in the HIFα subunit in the presence of oxygen, leading to the subsequent binding of the VHL protein, polyubiquitinylation, and rapid proteasomal degradation of HIFα. Under hypoxia, they are inactivated so that HIFα accumulates and binds to HIFβ, and the HIFαβ dimer then transcriptionally activates HIF target genes (8).
HIF-P4H-2 is the major regulator of the stability of HIFα subunits. Knockout of Hif-p4h-2 results in embryonic lethality (11), while large-spectrum conditional inactivation of Hif-p4h-2 after birth leads to severe erythrocytosis associated with splenomegaly (12, 13). Hif-p4h-1 or Hif-p4h-3 knockout mice do not display erythrocytosis (3). A mouse line with a conditional Hif-p4h-2 deficiency in CD68+ macrophages and in the hematopoietic system displays excessive erythrocytosis, driven exclusively by HIF-2α (14). Using the gene trap (gt) strategy, we have generated a mouse line with partial Hif-p4h-2 inactivation (Hif-p4h-2gt/gt) that expresses decreased amounts of wild-type Hif-p4h-2 mRNA in tissues and shows stabilization of the HIFα subunits (15). These mice are protected against cardiac and skeletal muscle ischemia (15, 16), metabolic syndrome, and atherosclerosis (17, 18) due to the activation of the hypoxia response pathway. Hif-p4h-2gt/gt mice did not develop erythrocytosis when studied up to 5 months age (15).
Clinical trials with small-molecule compounds that inhibit HIF-P4Hs, stabilize HIFα, and induce EPO for the treatment of anemias of chronic kidney diseases are ongoing (10, 19, 20). We have shown previously that administration of a small-molecule HIF-P4H inhibitor to Hif-p4h-2gt/gt mice increased their hemoglobin and hematocrit values more markedly than in their wild-type littermates (21), and we show here that splenic HIFα stabilization due to partial genetic Hif-p4h-2 inactivation is associated with the inhibition of Notch signaling and age-dependent erythropoiesis in the spleen and protection against inflammation-induced anemia.
RESULTS
Erythrocytosis in aged Hif-p4h-2 hypomorphic mice.
Where our previous studies with young adult (2- to 5-month-old) Hif-p4h-2 hypomorphic (Hif-p4h-2gt/gt) mice revealed no erythrocytosis (15, 21), in the present study, we found ∼20% higher levels of red blood cells (RBCs) and hemoglobin and hematocrit values in 1-year-old female Hif-p4h-2gt/gt mice than in their wild-type littermates (Fig. 1A). There were no differences in the levels of white blood cells, platelets, or plasma total iron (Fig. 1B). In view of the observed differences in erythrocytosis between young (15, 21) and old Hif-p4h-2gt/gt mice, we then monitored the hematocrit values for a group of male mice from birth to 1 year of age and observed that Hif-p4h-2gt/gt mice had a mild increase in hematocrit values relative to those for wild-type mice from 6 months onwards (Fig. 1C). Both genders thus expressed age-dependent erythrocytosis (Fig. 1A and C), the most obvious mechanism of which would be elevated EPO levels. However, no significant difference in renal Epo mRNA levels was seen between genotypes (100% ± 39% in wild-type versus 214% ± 61% in Hif-p4h-2gt/gt mice [n = 8 for both genotypes]; P = 0.14), and no detectable levels of Epo mRNA were found in the spleens or livers of either Hif-p4h-2gt/gt or wild-type mice. Serum EPO levels in 5-month-old and 12-month-old animals showed a small but statistically nonsignificant, and apparently not physiologically relevant, upregulation in Hif-p4h-2gt/gt mice (Fig. 1D). The logarithmic transforms of serum EPO levels in Hif-p4h-2gt/gt mice, when plotted against their hematocrit values, lay above the trend line for the wild type in the majority of cases (Fig. 1E). We therefore cannot exclude the possibility that the Hif-p4h-2gt/gt mice were slightly hypersensitive to EPO.
FIG 1.
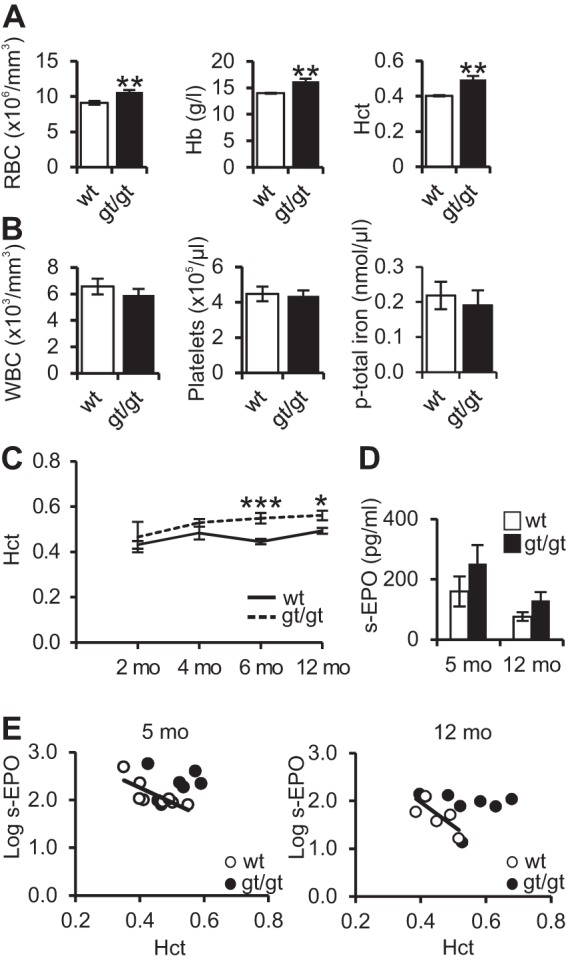
Hif-p4h-2gt/gt mice show age-dependent erythrocytosis. (A and B) Hematologic parameters for 1-year-old female wild-type (wt) and Hif-p4h-2gt/gt (gt/gt) mice. Red blood cell (RBC), hemoglobin (Hb), hematocrit (Hct), white blood cell (WBC), platelet, and plasma iron (p-total iron) levels were measured (n = 7 [wild type] and n = 13 [gt/gt], except for plasma iron [n = 8 {wild type} and n = 5 {gt/gt}]). (C) Hematocrit levels for a group of male mice measured for a 1-year follow-up period (n = 12 [wild type] and n = 5 [gt/gt]). (D) Serum EPO levels of 5- and 12-month-old Hif-p4h-2gt/gt mice and wild-type littermates (n = 8 [wild type] and n = 7 [gt/gt] at 5 months and n = 13 [wild type] and n = 12 [gt/gt] at 12 months). (E) Correlation between log serum EPO levels and hematocrit values in 5- and 12-month-old Hif-p4h-2gt/gt and wild-type mice (n = 8 [wild type] and n = 7 [gt/gt] at 5 months and n = 7 [wild type] and n = 7 [gt/gt] at 12 months). Student's t test was used for comparisons between two groups. *, P < 0.05; **, P < 0.01; ***, P < 0.001. Error bars represent SEM.
Induced erythroid and megakaryocytic hyperplasia in the spleen but not in the bone marrow of Hif-p4h-2 hypomorphic mice.
To study the origin of erythrocytosis in Hif-p4h-2gt/gt mice, we first performed a histological analysis of bone marrow samples but saw no differences in either morphology or cell composition between Hif-p4h-2gt/gt and wild-type mice (Fig. 2A) or the numbers of proerythroblasts and erythrocytes or granulocytes when analyzed by fluorescence-activated cell sorter (FACS) analysis (Fig. 2B). Hif-p4h-2gt/gt mice of both genders had increased spleen weights compared to those of wild-type mice at 12 months, but no difference in liver weight was observed (Fig. 2C). Also, the architecture of Hif-p4h-2gt/gt mouse spleens was distorted, with increased erythroid hyperplasia (Fig. 2D) and higher numbers of megakaryocytes (Fig. 2E) and CD41+ cells (Fig. 2F). FACS analyses indicated that the numbers of Ter119+ proerythroblasts and erythrocytes were significantly increased in the spleens of Hif-p4h-2gt/gt mice (Fig. 2G) (P < 0.001), whereas the numbers of granulocytes were downregulated (Fig. 2G) (P < 0.001), indicating a shift toward higher levels of erythropoiesis and lower levels of myelopoiesis. Further FACS analyses were performed to evaluate the proportion of proerythroid, immature erythroid, or mature erythroid cells in the spleen. Hif-p4h-2gt/gt mice had a higher number of splenic CD71+ Ter119+ immature erythroid cells (P < 0.01), and the number of mature CD71− Ter119+ erythrocytes was significantly increased relative to the numbers in wild-type mice (Fig. 3A) (P < 0.05). This observation was further supported by immunohistological staining with an anti-CD71 antibody, which pointed to an increased number of CD71-positive cells in Hif-p4h-2gt/gt spleens (Fig. 3B).
FIG 2.
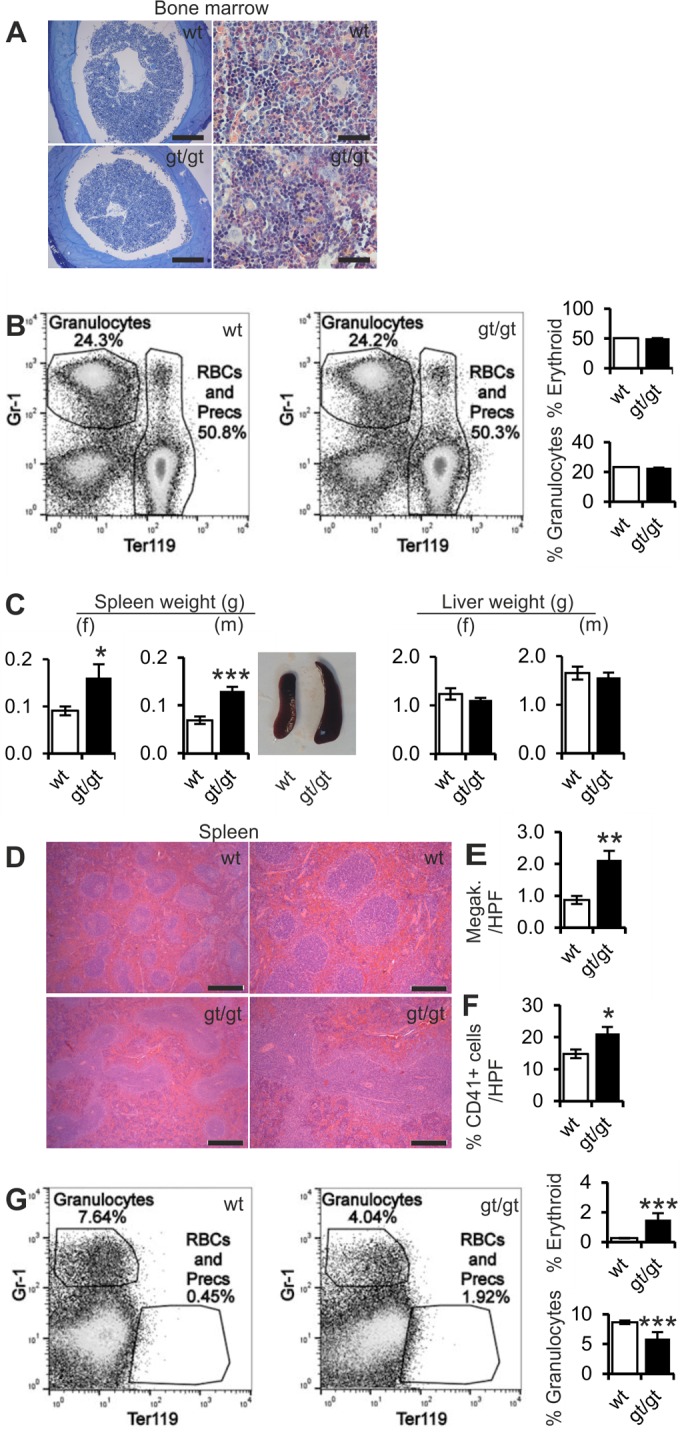
Extramedullary erythropoiesis in spleens of Hif-p4h-2gt/gt mice. (A) Bone marrow histology of Hif-p4h-2gt/gt (gt/gt) and wild-type (wt) mice studied by using toluidine blue (2-month-old mice) (left) and Leder (6-month-old mice) (right) staining. Representative figures are shown. Bars, 200 μm (left) and 50 μm (right). (B) Representative flow cytometric dot plots of red blood cells and their precursors (Precs) (Ter119) versus granulocytes (Gr-1) in bone marrow and quantification of the number of these cells in 4-month-old wild-type and Hif-p4h-2gt/gt mice. (C) Spleen and liver weights for 12-month-old females (f) and males (m) and representative pictures of spleens from 10-month-old wild-type and Hif-p4h-2gt/gt male mice (for spleen weights, n = 17 [wild type] and n = 23 [gt/gt] for females and n = 6 [wild type] and n = 7 [gt/gt] for males); (for liver weights, n = 9 [wild type] and n = 14 [gt/gt] for females and n = 7 [wild type] and n = 8 [gt/gt] for males). (D) Hematoxylin-eosin staining of 12-month-old wild-type and Hif-p4h-2gt/gt spleens. Bars, 500 μm (left) and 200 μm (right). (E) Numbers of megakaryocytes in spleens of 12-month-old mice per high-power field (HPF) (n = 6 [wild type] and n = 10 [gt/gt]). (F) Percentage of CD41-positive cells in 12-month-old wild-type and Hif-p4h-2gt/gt spleens (n = 16 [wild type] and n = 22 [gt/gt]). (G) Representative flow cytometric dot plots of red blood cells and their precursors (Precs) (Ter119) versus granulocytes (Gr-1) in spleen and quantification of the number of these cells in spleens of 4-month-old wild-type and Hif-p4h-2gt/gt mice. Analysis of variance was used for flow cytometry comparisons between groups, Student's t test was used for comparisons between the two genotypes. In panels A and D, a Leica DM LB2 microscope and a Leica DFC 320 camera were used. *, P < 0.05; **, P < 0.01; ***, P < 0.001. Error bars represent SEM.
FIG 3.
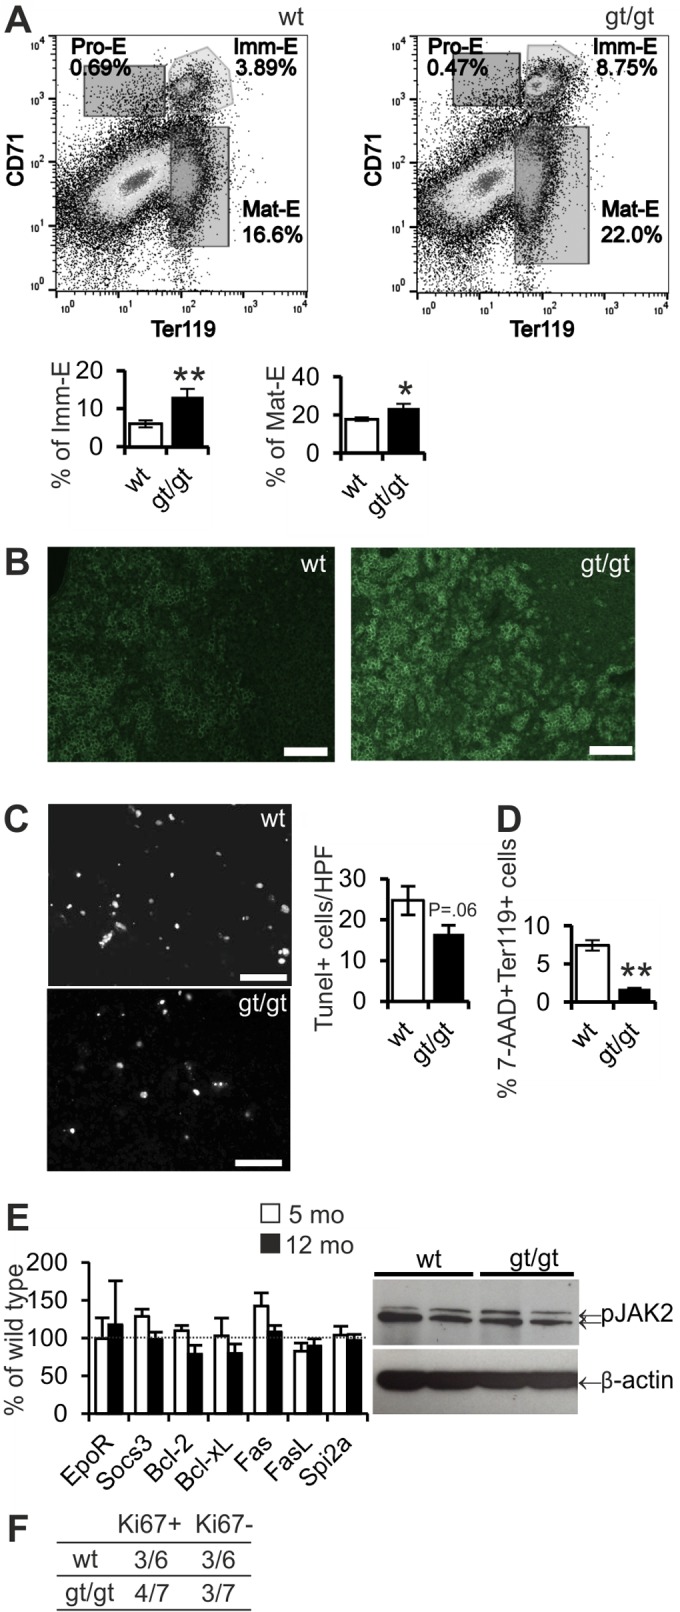
Hif-p4h-2gt/gt mice have increased numbers of erythroid precursors in their spleens. (A) Representative flow cytometric dot plots of erythroid precursors (CD71) versus proerythroblasts and erythrocytes (Ter119) and quantification of the numbers of immature erythroid precursors (Imm-E) (CD71+ Ter119+) and mature erythrocytes (Mat-E) (CD71− Ter119+) in spleens of wild-type (wt) and Hif-p4h-2gt/gt (gt/gt) mice (n = 5 for both genotypes). (B) Immunofluorescence staining for CD71 in spleen. Bar, 50 μm. (C) Representative images of TUNEL staining in spleen and analyses of numbers of TUNEL-positive cells per high-power field (HPF) (n = 6 [wild type] and n = 7 [gt/gt]). Bar, 50 μm. Student's t test was used for comparisons between two groups. (D) Percentages of cell death measured in terms of 7-aminoactinomycin (7-AAD) positivity in Ter119+ cells by flow cytometry (n = 6 for both genotypes). Analysis of variance was used for comparisons between groups. (E) Expression of Erythropoietin receptor (EpoR), Suppressor of cytokine signaling 3 (Socs3), B-cell lymphoma 2 (Bcl-2), B-cell lymphoma-extra large (Bcl-xl), Fas receptor (Fas), Fas ligand (FasL), and Serine protease inhibitor 2A (Spi2A) mRNAs in spleens of the Hif-p4h-2gt/gt mice presented as percentages of values for the wild type (n = 6 [wild type] and n = 7 [gt/gt]). Student's t test was used for comparison between the genotypes. Representative Western blots for phosphorylated JAK2. β-Actin was used as a loading control. (F) Spleens were stained with Ki67 to determine the proliferation rate and graded as either Ki67 positive or negative. Error bars represent SEM. *, P < 0.05; **, P < 0.01.
To ascertain the reason for the increased numbers of erythroid precursors in Hif-p4h-2gt/gt mouse spleens, we evaluated the rates of cell death and proliferation. The numbers of terminal deoxynucleotidyltransferase-mediated dUTP-biotin nick end labeling (TUNEL)-positive apoptotic cells in whole spleens of Hif-p4h-2gt/gt mice revealed a slight, although statistically nonsignificant, decrease relative to the numbers in the spleens of wild-type littermates (Fig. 3C). FACS analysis of the death of Ter119+ proerythroblasts by means of 7-aminoactinomycin D (7-AAD) dye showed this to be reduced in Hif-p4h-2gt/gt spleens (Fig. 3D) (P < 0.01), but there was no indication of increased EPOR-mediated antiapoptotic signaling, as evidenced by the absence of a difference in the mRNA levels of the EpoR, Suppressor of cytokine signaling 3 (Socs3), B-cell lymphoma 2 (Bcl-2), B-cell lymphoma-extra large (Bcl-xl), Fas receptor (Fas), Fas ligand (FasL), or Serine protease inhibitor 2A (Spi2A) gene and the phosphorylation of the JAK2 protein (Fig. 3E). The extent of splenic cell proliferation, as analyzed in terms of the Ki67 immunohistochemistry of the whole organ, did not differ between genotypes (Fig. 3F).
Hif-p4h-2gt/gt spleens show stabilization of HIF-1α and HIF-2α and altered Notch signaling.
Western blotting indicated normoxic stabilization of the HIF-1α and HIF-2α proteins in the spleens of Hif-p4h-2gt/gt mice but not in wild-type mice (Fig. 4A). Hif-p4h-2gt/gt mice express reduced levels of wild-type Hif-p4h-2 mRNA in their tissues. This level was 29% of that in the spleens of wild-type mice (P < 0.001) at 5 months and 34% of that (P < 0.001) at 12 months (Fig. 4B). There were no significant changes in the expression levels of Hif-p4h-1 or Hif-p4h-3 mRNAs. Of the established glycolytic HIF1 target genes analyzed, only Glyceraldehyde phosphate dehydrogenase (Gapdh) mRNA was slightly but nonsignificantly upregulated (120%) in the spleens of Hif-p4h-2gt/gt mice at both ages compared to the levels in wild-type mice (Fig. 4B), whereas the mRNA levels of the Glucose transporter 1 (Glut1), Phosphofructokinase, liver type (Pfkl), Phosphoglycerate kinase 1 (Pgk1), Lactate dehydrogenase A (Ldha), and Pyruvate dehydrogenase kinase 4 (Pdk4) genes were not altered. The expression of mRNA for C-X-C motif chemokine 12 (Cxcl12) was downregulated in the spleens of Hif-p4h-2gt/gt mice, being 78% of the level in wild-type mice in the 5-month-old mice and 54% of that in the 12-month-old mice (Fig. 4B). Also, Cd34 mRNA was downregulated to 76% in the 5-month-old Hif-p4h-2gt/gt mice and to 40% in the 12-month-old ones (P < 0.01) (Fig. 4B). Interestingly, the expression levels of the mRNAs for the Notch ligands Jagged 1 (Jag1) (58%; P < 0.01), Jagged 2 (Jag2) (48%; P = 0.24), and Delta-like ligand 1 (Dll1) (67%; P = 0.08) were downregulated in 12-month-old Hif-p4h-2gt/gt mice but not in 5-month-old mice relative to wild-type mice (Fig. 4B). Immunohistological staining of splenic Jag1 supported the observation of its downregulation in Hif-p4h-2gt/gt mice (Fig. 4C). No differences in Notch1 and Notch4 mRNA levels were seen, but a downregulation of Notch2 mRNA was found in 5-month-old Hif-p4h-2gt/gt mice (Fig. 4B). Of the established Notch target genes, the expression levels of the mRNA for Hairy and enhancer of split 1 (Hes1) were downregulated to 74% in the 5-month-old mice (P < 0.05) and to 72% in the 12-month-old ones (P < 0.05) (Fig. 4B). This downregulation was also seen for the protein levels in 12-month-old mice (Fig. 4D).
FIG 4.
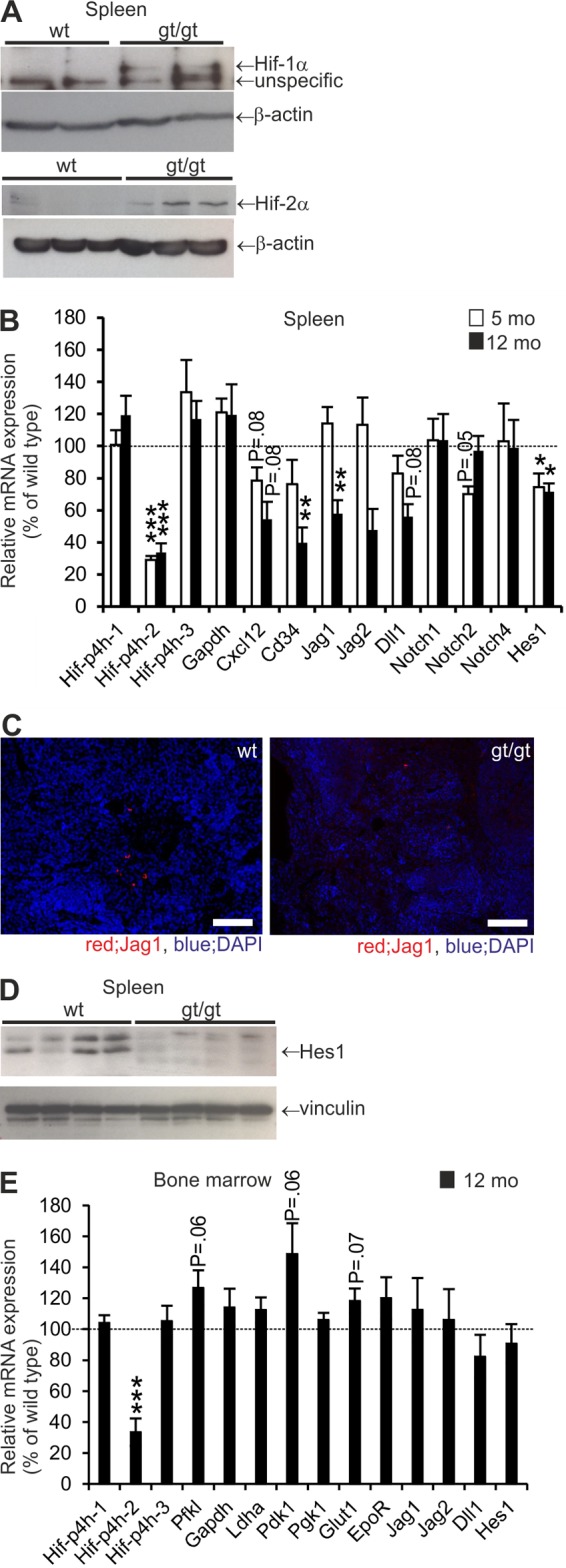
Stabilization of HIF-1α and HIF-2α and altered expression of Notch ligands in spleens of Hif-p4h-2gt/gt mice. (A) Representative Western blots for HIF-1α and HIF-2α in spleens of Hif-p4h-2gt/gt (gt/gt) and wild-type (wt) mice. (B) Expression of Hypoxia-inducible factor prolyl 4-hydroxylase 1 (Hif-p4h-1), Hif-p4h-2, Hif-p4h-3, Glyceraldehyde phosphate dehydrogenase (Gapdh), C-X-C motif chemokine 12 (Cxcl12), Cd34, Jagged 1 (Jag1), Jag2, Delta-like ligand 1 (Dll1), Notch1, Notch2, Notch4, and Hairy and enhancer of split 1 (Hes1) mRNAs in spleens of Hif-p4h-2gt/gt mice presented as percentages of values for the wild type (n = 5 to 8 [wild type] and n = 6 to 8 [gt/gt]). (C) Immunofluorescence staining for Jag1. Bar, 50 μm. (D) Representative Western blot for Hes1 in spleens of 1-year-old Hif-p4h-2gt/gt (gt/gt) and wild-type mice. Vinculin was used as a loading control. (E) Expression of Hif-p4h-1, Hif-p4h-2, Hif-p4h-3, Phosphofructokinase, liver type (Pfkl), Gapdh, Lactate dehydrogenase A (Ldha), Pyruvate dehydrogenase kinase 1 (Pdk1), Glucose transporter 1 (Glut1), Epo receptor (EpoR), Jag1, Jag2, Dll1, and Hes1 mRNAs in bone marrow of Hif-p4h-2gt/gt mice presented as percentages of values for the wild type (n = 8 [wild type] and n = 8 [gt/gt]).
To find out whether these changes in mRNA levels were specific for the spleen, we analyzed the levels of mRNAs for Hif-p4hs, established HIF1 target genes, Notch ligands, and Hes1 in the bone marrow of 12-month-old Hif-p4h-2gt/gt mice relative to wild-type mice. Hif-p4h-2 mRNA was downregulated in Hif-p4h-2gt/gt bone marrow to 33% of that in wild-type mice (Fig. 4E), and the HIF1 target genes Phosphofructokinase, liver type (Pfkl), Pyruvate dehydrogenase kinase 1 (Pdk1), and Glut1 showed a tendency for upregulation, indicating putative HIF1 stabilization in the bone marrow. The mRNA levels of the Notch ligands Jag1, Jag2, and Dll1 as well as a Notch target gene, Hes1, were not altered in Hif-p4h-2gt/gt bone marrow (Fig. 4E).
Since there was no induction of the established HIF1 target genes in the spleens of Hif-p4h-2gt/gt mice despite HIF-1α stabilization, we silenced HIF-2α in primary splenocytes extracted from Hif-p4h-2gt/gt mice with small interfering RNA (siRNA). This led to a 13-fold induction of Jag1 mRNA compared to that in scrambled siRNA-transfected cells (P < 0.01) (Fig. 5A). Also, the expression of Jag2 was slightly upregulated (P < 0.05), and that of Dll1 was upregulated 6-fold (P < 0.01), suggesting that the downregulation of the Notch ligands in Hif-p4h-2gt/gt spleens was HIF-2α dependent.
FIG 5.
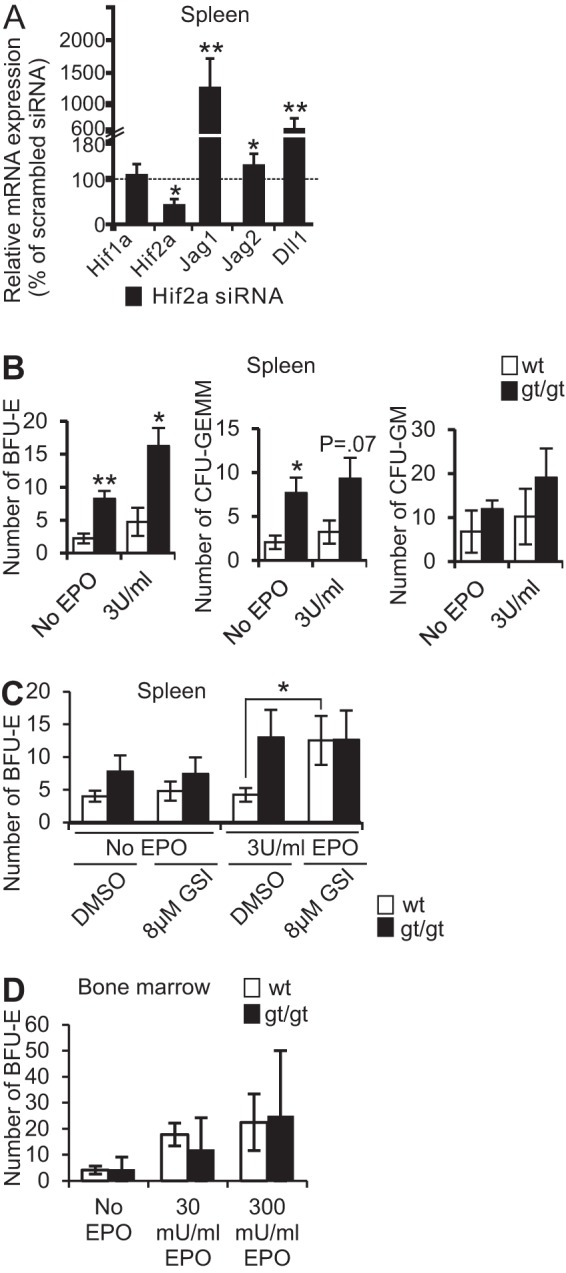
Increased number of BFU-E colonies from spleen HSCs of Hif-p4h-2gt/gt mice and from spleen HSCs of wild-type mice treated with GSI. (A) Expression of Hif1a (hypoxia-inducible factor 1α), Hif2a (hypoxia-inducible factor 2α), Jagged 1 (Jag1), Jag2, and Delta-like ligand 1 (Dll1) mRNAs in primary splenocytes of Hif-p4h-2gt/gt mice treated with siRNA against Hif-2α, presented as percentages of expression levels in scrambled siRNA-treated cells (n = 2 for both siRNAs). (B) Average numbers of erythroid burst-forming unit (BFU-E), CFU granulocyte-erythroid-macrophage-megakaryocyte (CFU-GEMM), and CFU granulocyte-macrophage (CFU-GM) colonies grown from spleen HSCs of Hif-p4h-2gt/gt and wild-type mice in the presence or absence of 3 U/ml EPO (n = 3 [wild type] and n = 5 [gt/gt]). Student's t test was used for comparisons between two groups. (C) Average numbers of BFU-E colonies grown from spleens of Hif-p4h-2gt/gt and wild-type mice treated with either DMSO (control) or 8 μM gamma-secretase inhibitor (GSI) in the presence or absence of 3 U/ml EPO (n = 3 [wild type] and n = 4 [gt/gt]). Student's t test was used for comparisons between two groups. (D) Numbers of BFU-E colonies grown from bone marrow HSCs with no EPO and 30 and 300 mU/ml of EPO (n = 3 for both genotypes). Mice were 6 months of age. *, P < 0.05; **, P < 0.01. Error bars represent SEM.
When an erythroid burst-forming unit (BFU-E) colony assay was performed, hematopoietic stem cells (HSCs) of Hif-p4h-2gt/gt spleens formed significantly more BFU-E without EPO relative to the wild type, and this difference persisted, but did not increase, following supplementation with EPO (Fig. 5B). There was also induced growth of CFU granulocyte-erythroid-macrophage-megakaryocyte (CFU-GEMM) colonies in the HSCs of Hif-p4h-2gt/gt spleens in the presence and absence of exogenous EPO, whereas no significant difference was seen in the numbers of CFU granulocyte-macrophage (CFU-GM) colonies (Fig. 5B), supporting the notion of a shift toward the erythroid lineage. When Notch signaling was inhibited in wild-type spleen HSCs with a gamma-secretase inhibitor (GSI), in the presence of EPO, wild-type HSCs formed BFU-Es to an extent similar to that for Hif-p4h-2gt/gt spleen HSCs (Fig. 5C) (P < 0.05 for wild-type BFU-Es with GSI and EPO versus the control and EPO), indicating that, indeed, diminished Notch signaling is an important regulator of induced splenic erythropoiesis. No differences in the numbers of BFU-Es from bone marrow were detected between genotypes either without or with EPO (Fig. 5D).
Hif-p4h-2 hypomorphic mice are protected against inflammation-induced anemia.
To determine whether splenic extramedullary hematopoiesis was protective against anemia, we subjected Hif-p4h-2gt/gt and wild-type mice to two inflammation-induced anemia models. First, 3-month-old mice, which had no difference in erythroid cell parameters between the genotypes, were treated with lipopolysaccharide (LPS) and zymosan A to cause acute anemia, whereupon the levels of RBCs and hemoglobin and hematocrit values declined significantly from the baseline in wild-type mice after 1 week, whereas they remained steady in Hif-p4h-2gt/gt mice (Fig. 6A). After 2 weeks, the wild-type mice developed more severe anemia, as manifested by a greater decrease in the RBC levels (P < 0.01) and hemoglobin (P < 0.05) and hematocrit (P < 0.01) values than for Hif-p4h-2gt/gt mice (Fig. 6A). Supporting the hypothesis that the protective effect against the development of anemia may originate from the spleen, the numbers of spleen megakaryocytes were significantly higher in Hif-p4h-2gt/gt mice than in wild-type mice after the 2-week follow-up (Fig. 6B) (P < 0.05). No difference was seen between genotypes in the levels of serum EPO (Fig. 6C) or plasma total iron (Fig. 6D).
FIG 6.
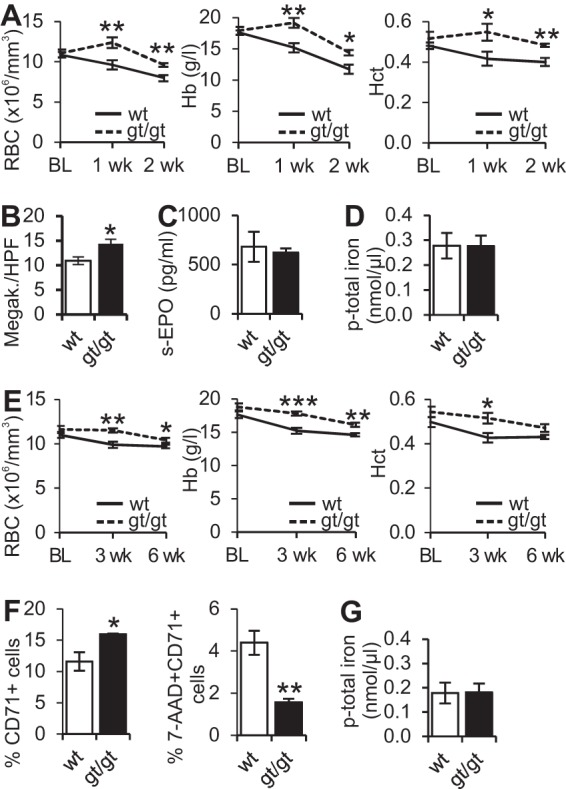
Hif-p4h-2gt/gt mice are protected against inflammation-induced anemia. (A) Hematologic parameters at baseline (BL) and after 1 and 2 weeks of follow-up after lipopolysaccharide and zymosan A injection. (B) Numbers of spleen megakaryocytes per high-power field (HPF). (C and D) Serum EPO (C) and plasma iron (D) levels in wild-type (wt) and Hif-p4h-2gt/gt (gt/gt) mice after a 2-week follow-up. (For panels A to D, n = 7 [wild type] and n = 5 [gt/gt].) (E) Hematologic parameters at baseline (BL) and after 3- and 6-week follow-ups after peptidoglycan-polysaccharide-polymer (PGPS) injection (n = 9 [wild type] and n = 11 [gt/gt]). (F) Percentages of CD71-positive cells and of 7-aminoactinomycin (7-AAD)-positive cells in spleens of the mice 6 weeks after PGPS injection (n = 6 [wild type] and n = 4 [gt/gt]). Analysis of variance was used for comparisons between groups. (G) Plasma iron levels 6 weeks after PGPS injection (n = 11 for both genotypes). Student's t test was used for comparisons between two groups. *, P < 0.05; **, P < 0.01; ***, P < 0.001. Error bars represent SEM.
In the second model, 3- to 4-month-old mice were injected with peptidoglycan-polysaccharide polymer (PGPS), which causes a more chronic type of anemia. The difference in erythroid cell parameters between genotypes became significant after 3 weeks of the 6-week follow-up period, when the levels of RBCs and hemoglobin and hematocrit values were all lower in wild-type than in Hif-p4h-2gt/gt mice (Fig. 6E) (P < 0.01, P < 0.001, and P < 0.05, respectively). FACS analysis of the spleens after 6 weeks showed significantly higher numbers of CD71+ proerythroblasts and erythrocytes and a lower rate of cell death among Hif-p4h-2gt/gt mice than among wild-type mice (Fig. 6F) (P < 0.01), suggesting protection against anemia by splenic extramedullary erythropoiesis in the former. Again, no difference in the plasma iron level was seen (Fig. 6G).
DISCUSSION
Members of the Notch family play critical roles in cell fate determination and in the maintenance of progenitor cells in many developmental systems (22–24). Notch proteins function both as cell surface receptors and as transcriptional regulators (23, 25–27). Activation of Notch signaling requires cell-cell contact between Notch ligand- and receptor-presenting cells, leading to a receptor-ligand interaction that results in the release of the Notch intracellular domain (NICD) (28). Four receptors (Notch1 to -4) (29) and five ligands (Dll1, -3, and -4 [30–32] and Jag1 and -2 [33–35]) have been described to date. The Notch receptors are found on primitive hematopoietic precursors, while ligand expression has been found on the surface of stromal cells, suggesting a role for Notch signaling in mammalian hematopoietic development (36). Notch signaling enhances the survival of primitive multipotent precursors (37–39), and a role in early erythropoiesis has been suggested (36).
Given that HSCs and multipotent progenitors must continuously undergo lineage commitment, differentiation, and proliferation while also maintaining a pool of uncommitted progenitors, Notch, as a regulator of cell fate determination, limits the number of committed cells. Induced Jag1-Notch1 signaling promotes the maintenance and expansion of hematopoietic progenitors (37, 38), whereas inhibition of Notch signaling leads to a higher rate of differentiation and thus the inhibition of HSC maintenance in a native bone marrow microenvironment (40). Also, the chemokine CXCL12 plays a role in the maintenance of HSCs in the bone marrow and in the splenic perisinusoidal niche for extramedullary hematopoiesis (41). We show here that downregulation of Jag1 and Cxcl12 mRNAs in the spleens of Hif-p4h-2gt/gt mice was associated with an increased number of CD71+ Ter119+ immature erythroid cells and reduced death of Ter119+ cells, leading to increased extramedullary erythropoiesis, possibly via induced HSC differentiation. Both the downregulation of Notch signaling and the induction of erythropoiesis in Hif-p4h-2gt/gt mice were age dependent, suggesting a potential causal link between these two phenomena.
Recent studies have demonstrated molecular connections between HIF and the Notch signaling pathways. HIF-1α has been shown to interact with the NICD, leading to increased expression of Notch target genes under hypoxia (42), whereas HIF-2α can directly bind the RBP-J-associated module (RAM) domain of the NICD (43) and repress Notch signaling (44). Results obtained by using glioma stem cells suggest that HIF-1α and HIF-2α bind competitively to the NICD in the same domain (44). Those authors then proposed a model involving the differential regulation of NICD transactivation activity depending on oxygen levels, where HIF-2α stabilization represses Notch signaling in mild hypoxia, whereas HIF-1α competes with HIF-2α for NICD binding in severe hypoxia, thus leading to the upregulation of Notch signaling (44). Moreover, acute global deletion of Hif-p4h-2 led to increased spleen weight and extramedullary hematopoiesis, which were restored by concurrent HIF-2α deletion (45). These data (44, 45) are in line with our in vivo results with regard to the stabilization of splenic HIF-2α regulating extramedullary hematopoiesis and the concomitant downregulation of Notch signaling. Also, when we silenced Hif2a in primary splenocytes of Hif-p4h-2gt/gt mice by means of siRNA, we observed increased expression levels of the Jag1, Jag2, and Dll1 mRNAs in comparison with the levels in scramble-treated control cells, suggesting that HIF-2α is indeed responsible for the downregulation of the expression of these Notch ligands in Hif-p4h-2gt/gt mouse spleens.
HIF-P4Hs are known to control red cell mass, with HIF-P4H-2 being implicated as the key isoform in this respect (45). Traditionally, erythrocytosis driven by the HIF-P4H-2 inhibition-induced accumulation of HIFαs has been attributed to increased expression of EPO from kidney interstitial cells (13), but also, wider, multifactorial control of red cell mass by HIF-P4H-2 has been proposed (45). In our present data, no physiologically relevant induction of the serum EPO level was seen in Hif-p4h-2gt/gt mice despite age-dependent erythrocytosis. Also, no significant differences were seen in the expression levels of EpoR, Socs3, Bcl-2, Bcl-xl, Fas, FasL, or Spi2A mRNAs; the phosphorylation of the JAK2 protein; or the overall rate of apoptosis, suggesting that there was no induction of the EPO-signaling pathway in the spleens of Hif-p4h-2gt/gt mice, which could have explained the erythrocytosis observed in these mice.
The development of agents that stimulate erythropoiesis, such as recombinant human EPO, has resulted in substantial health benefits for patients with end-stage renal failure (46). A considerable proportion of these patients, however, exhibit a suboptimal response to treatment, with inflammation being recognized with increasing frequency as a cause of the hyporesponsiveness to EPO (46). The unresponsiveness in these patients is evidenced by the persistence of anemia, creating a considerable challenge for their treatment. The induction of erythropoiesis in Hif-p4h-2gt/gt mice without an elevation of the serum EPO level could therefore offer an intriguing new possibility for treating EPO-resistant anemia and help in improving the clinical outcome for these patients.
When we cultured HSCs from bone marrow with different concentrations of EPO, no differences in the numbers of BFU-Es were seen between genotypes. Surprisingly, however, BFU-Es from the spleens of Hif-p4h-2gt/gt mice grew to a significant extent even without EPO, whereas BFU-Es from their wild-type counterparts did not, indicating that they had an intrinsic growth advantage, putatively due to altered Notch signaling. Inhibition of Notch signaling with a GSI in wild-type splenic HSCs mimicked this phenotype with induced growth of BFU-Es. This supports the hypothesis that Notch signaling plays an important role in induced extramedullary erythropoiesis in Hif-p4h-2gt/gt mice. Activation of HIF-1α by the pan-prolyl hydroxylase inhibitor dimethyloxalylglycine (DMOG) has been reported to synergize with glucocorticoids to enhance the production of CFU-E, suggesting that prolyl hydroxylase inhibitors stimulate erythropoiesis not only through enhanced EPO production but also by intrinsically stimulating BFU-E self-renewal (47).
Since both aging and inflammatory diseases are said to impose an increased anemia burden, we set out to test whether Hif-p4h-2gt/gt mice were protected against the development of inflammation-induced anemia by virtue of their Notch-dependent erythrocytosis. Using two models, performed on young adult mice with no apparent erythrocytosis at the start of the challenge, we saw that Hif-p4h-2gt/gt mice were protected against the development of inflammation-induced anemia and that this protection was non-EPO driven but associated with increased splenic erythropoiesis. It is thus likely that protection against the development of inflammation-induced anemia is due to a mechanism similar to that for the induced erythropoiesis seen upon aging. In a broader sense, inflammation and aging can be considered stress reactions, and these data suggest that the HIF-2α-dependent downregulation of Jag1-Notch signaling could be a common phenomenon in the regulation of extramedullary erythropoiesis linked to such challenges.
In conclusion, we show here that HIF-2α stabilization-mediated downregulation of the Notch ligands Jag1 and -2 and Dll1 and a Notch target gene, Hes1, in Hif-p4h-2 hypomorphic mice leads to induced extramedullary erythropoiesis in the spleen (Fig. 7) but not in the bone marrow and that this is manifested in increased hematocrit values upon aging and protection against inflammation-induced anemia.
FIG 7.
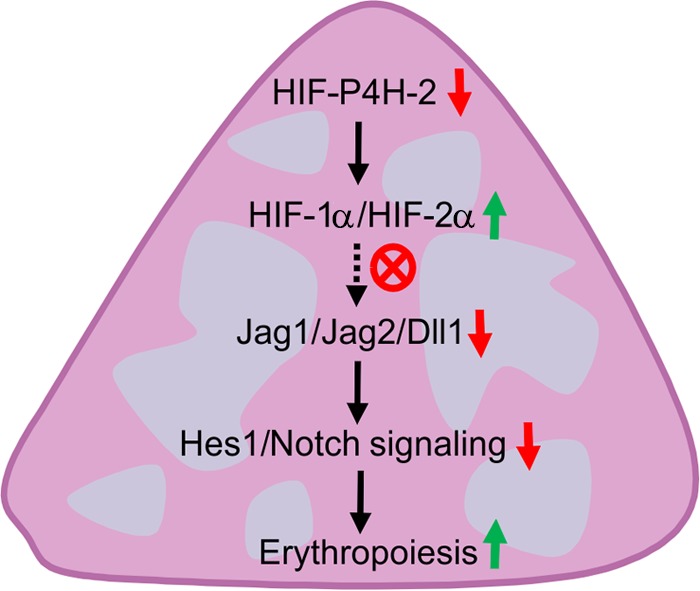
Schematic model of the molecular-level effects of HIF-P4H-2 deficiency leading to splenic extramedullary erythropoiesis. HIF-P4H-2, hypoxia-inducible factor prolyl 4-hydroxylase 2; HIF-1α, hypoxia-inducible factor 1α; Jag1, Jagged 1; Dll1, Delta-like ligand 1; Hes1, Hairy and enhancer of split 1.
MATERIALS AND METHODS
Hif-p4h-2gt/gt mice.
The method for generating the Hif-p4h-2gt/gt mouse line was described previously (15). In short, a GeneTrap targeting vector was introduced into intron 1 of the Hif-p4h-2 gene. In addition to the truncated trapped Hif-p4h-2 mRNA, the targeted alleles yield some wild-type Hif-p4h-2 mRNA because of partial skipping of the targeting vector. The knockdown level of Hif-p4h-2 varies between tissues in these mice, being, for example, ∼35% in the kidney, which appears not to be enough to induce Epo mRNA and cause massive erythrocytosis (15). Gender-matched wild-type littermates were used as controls in all experiments. The mice were sedated with fentanyl and midazolam when indicated. All experiments were performed according to protocols approved by the National Animal Experiment Board of Finland.
Analysis of hematologic parameters.
For analysis of hematologic parameters, 20 μl of hind-limb venous blood was collected into a capillary. The samples were analyzed by using the Exigo veterinary hematology system (Boule Diagnostics).
Plasma iron and serum EPO.
For determination of plasma iron and serum EPO levels, an iron assay kit (catalog number ab83366; Abcam) and the Quantikine Mouse EPO immunoassay kit (R&D Systems), respectively, were used.
Histological analyses.
Five-micrometer sections from formaldehyde-fixed paraffin-embedded spleen samples were stained with hematoxylin-eosin (HE) and viewed and photographed with a Leica DM LB2 microscope and a Leica DFC 320 camera. Representative pictures (5 to 8 pictures/mouse) were taken, and the megakaryocytes were counted in a blind manner. CD41 immunohistochemistry (with anti-CD41 antibody ab63983; Abcam) was used to count the CD41+ spleen cells. Ki67 immunohistochemistry (catalog number M7248; Dako) was used to score the rate of proliferation in spleens.
To analyze the level of apoptosis, spleen samples were stained with the In Situ Cell Death Detection kit, fluorescein (Roche), and the number of apoptotic cells or bodies was calculated from 5 to 8 pictures per mouse by using an Olympus BX21 microscope and an Olympus XC50 camera. To visualize the expression of CD71 and Jag1, immunofluorescence staining was performed with anti-transferrin receptor (CD71) antibody (catalog number ab84036; Abcam) and donkey anti-rabbit antibody–Alexa Fluor 488 (Jackson ImmunoResearch) and with anti-Jag1 antibody (catalog number ab109536; Abcam) and donkey anti-rabbit antibody–Cy3 (Jackson ImmunoResearch). Diamidinophenylindole dihydrochloride (DAPI) was used to stain nuclei. Stainings were photographed with a Zeiss AxioScope A1 microscope and an AxioCam MRm camera.
Femurs of 2-month-old mice were decalcified; fixed for 3 weeks in 10% EDTA, 1% glutaraldehyde, and 4% paraformaldehyde in 0.1 M phosphate-buffered saline (PBS); and embedded in Epon LX112 (Ladd Research Industries). Semithin blocks were cut and stained with toluidine blue. For Leder staining, formalin-EDTA-decalcified femurs were embedded in paraffin. Tissue sections were stained by using the standard Leder protocol.
FACS analysis.
Spleen and liver samples were rapidly filtered with a Falcon nylon cell strainer (Thermo Fischer Scientific) and flushed with 1× PBS. Femurs were cut at both ends, and bone marrow tissues were collected by flushing them with 1× PBS filtered through a Falcon nylon cell strainer. The numbers of erythroid precursors/immature erythrocytes/proerythroblasts and erythrocytes were evaluated with anti-Ter119 (catalog number 557915; BD Biosciences) and anti-CD71 (catalog number 563504; BD Biosciences) antibodies, respectively, and the number of granulocytes was evaluated with phycoerythrin (PE)-Cy7 (catalog number 552985; BD Biosciences) and allophycocyanin (APC) (catalog number 553129; BD Biosciences) antibodies. The extent of cell death was evaluated with 7-AAD dye. Experiments were carried out by using a FACSCalibur instrument running CellQuest software, and data were analyzed by using FlowJo.
Western blotting.
Dissected spleens were snap-frozen in liquid nitrogen and crushed to a powder by using beads. Nuclear and cytosolic fractions for the detection of HIF-1α and HIF-2α proteins were extracted with the NE-PER kit (Pierce). To detect phosphorylated JAK2 protein, the total protein fractions were extracted with a solution containing 25 mM Tris (pH 8.0), 60 mM NaCl, 0.25% NP-40, and 3 M urea supplemented with Pierce protease and phosphatase inhibitor minitablets (Thermo Fisher Scientific). Protein concentrations were determined with the Bio-Rad protein assay, and the samples were resolved by SDS-PAGE and blotted onto Immobilon-P membranes (Millipore). The following primary antibodies were used: anti-HIF-1α (catalog number NB100-479; Novus Biologicals), anti-HIF-2α (catalog number ab199; Abcam), anti-phosphorylated JAK2 (catalog number ab195055; Abcam), and anti-β-actin (catalog number NB600-501; Novus Biologicals).
Quantitative real-time reverse transcription-PCR.
Total RNA from tissues was isolated with EZNA total RNA kit II (Omega Bio-Tek) or TriPure isolation reagent (Roche) and reverse transcribed with an iScript cDNA synthesis kit (Bio-Rad). Quantitative PCR (qPCR) was performed by using iTaq SYBR green supermix and ROX (Bio-Rad) with a Touch thermal cycler and a CFX96 real-time system (Bio-Rad). The primers used are presented in Table 1.
TABLE 1.
Sequences of qPCR primers
| Gene | Forward primer or trade name (manufacturer) | Reverse primer |
|---|---|---|
| β-Actin | AGAGGGAAATCGTGCGTGAC | CAATAGTGATGACCTGGCCGT |
| EpoR | Quantitect primer assays (Qiagen) | |
| Socs3 | ATGGTCACCCACAGCAAGTTT | TCCAGTAGAATCCGCTCTCCT |
| Bcl-2 | CTCGTCGCTACCGTCGTGACTTCG | CAGATGCCGGTTCAGGTACTCAGTC |
| Bcl-xl | TGGAGTAAACTGGGGGTCGCATCG | AGCCACCGTCATGCCCGTCAGG |
| Fas | GCGGGTTCGTGAAACTGATAA | GCAAAATGGGCCTCCTTGATA |
| FasL | TCCGTGAGTTCACCAACCAAA | GGGGGTTCCCTGTTAAATGGG |
| Spi2a | CTTCCCAACGGCTGGAATCTA | ACTGTCCAATCAGGCATAGCG |
| Hif-p4h-1 | GGCAACTACGTCATCAATG | ACCTTAACATCCCAGTTCTGA |
| Hif-p4h-2 | CTGGGCAACTACAGGATAAAC | GCGTCCCAGTCTTTATTTAGATA |
| Hif-p4h-3 | AGGCCCAACGTACCCCACCT | GTGTGTTGGCTGGGAGCCCA |
| Gapdh | TGTGTCCGTCGTGGATCTGA | TTGCTGTTGAAGTCGCAGGAG |
| Cxcl12 | TGCATCAGTGACGGTAAACCA | TTCTTCAGCCGTGCAACAATC |
| Cd34 | GGTAGCTCTCTGCCTGATGAG | TGGTAGGAACTGATGGGGATATT |
| Jag1 | CCTCGGGTCAGTTTGAGCTG | CCTTGAGGCACACTTTGAAGTA |
| Jag2 | TGGCTGTCACCGAGGTCAA | ACGTTCTTTCCTGCGCTTTC |
| Dll1 | CAGGACCTTCTTTCGCGTATG | AAGGGGAATCGGATGGGGTT |
| Notch1 | RT2 Profiler PCR array mouse hematopoiesis (Qiagen) | |
| Notch2 | RT2 Profiler PCR array mouse hematopoiesis (Qiagen) | |
| Notch4 | RT2 Profiler PCR array mouse hematopoiesis (Qiagen) | |
| Hes1 | CGGCATTCCAAGCTAGAGAAGG | GGTAGGTCATGGCGTTGATCTG |
| Glut1 | Quantitect primer assays (Qiagen) | |
| Pfkl | Quantitect primer assays (Qiagen) | |
| Pgk1 | GGAGCGGGTCGTGATGA | GCCTTGATCCTTTGGTTGTTTG |
| Ldha | GGATGAGCTTGCCCTTGTTGA | GACCAGCTTGGAGTTCGCAGTTA |
| Pdk1 | Quantitect primer assays (Qiagen) | |
| Pdk4 | Quantitect primer assays (Qiagen) |
Colony-forming assays.
Bone marrow from femurs and spleen cells were isolated from 6- to 10-month-old mice. Nucleated bone marrow cells (3 × 10⁴ cells/ml) and nucleated splenocytes (1 × 10⁵ cells/ml) were plated in triplicate in methylcellulose medium (catalog number M3534; StemCell Technologies) in the absence or presence of EPO (30 mU/ml and 300 mU/ml EPO for bone marrow cells and 3,000 mU/ml for spleen cells). Bone marrow and spleen BFU-E, CFU-GEMM, and CFU-GM colonies were scored after 7 days of incubation at 37°C in a humidified atmosphere containing 5% CO2. In another set of experiments, spleen BFU-E, CFU-GEMM, and CFU-GM colonies were scored after treatment with GSI XII (Calbiochem) or dimethyl sulfoxide (DMSO) in the presence or absence of 3,000 mU/ml EPO on day 7.
siRNA transfection.
The spleens of 4- to 5-month-old male Hif-p4h-2gt/gt mice were isolated and meshed through a Falcon nylon cell strainer (Thermo Fischer Scientific). After several washes, the resulting cell suspension was dispersed in Iscove's modified Dulbecco's medium (catalog number 12440-046; Thermo Fischer Scientific) supplemented with 10% fetal calf serum, 1% penicillin-streptomycin, and 100 μM 2-mercaptoethanol. About 2 × 10⁶ cells were transfected according to a “reverse-transfection” protocol with 150 pmol of X-tremeGENE siRNA transfection reagent (Roche, Sigma-Aldrich) per well in six-well plates with an siRNA targeting HIF-2α (Sigma-Aldrich) or a scrambled universal negative control. The cells were collected for total RNA isolation 24 to 48 h after transfection.
Anemia models.
In one model, 3-month-old mice were injected intraperitoneally with LPS (2 μg/g) and zymosan A (800 μg/g) 6 days later in order to cause inflammation. Blood samples were collected at the beginning of the experiment, after 7 days, and upon sacrifice 14 days after the zymosan A injection. Other 3- to 4-month-old mice were injected intraperitoneally with PGPS (15 μg/g), and blood samples were collected at the beginning of the experiment, 3 weeks after the PGPS injection, and at sacrifice 6 weeks after the PGPS injection. Tissues were collected at sacrifice.
Statistical analyses.
Student's two-tailed t test was used for comparisons between two groups. Since the BFU-E values in the GSI experiment were not distributed normally, statistical analysis in this case was performed after logarithmic transformation of the values. Differences between multiple groups were evaluated by using one-way analysis of variance (ANOVA) followed by the Newman-Keuls post hoc test. A P value of <0.05 was considered statistically significant. All data are presented as means ± standard errors of the means (SEM).
ACKNOWLEDGMENTS
We thank K. I. Kivirikko for valuable comments on the manuscript; T. Aatsinki, E. Lehtimäki, R. Salmu, and M. Siurua for excellent technical assistance; S. Kauppila for evaluating the Leder-stained bone marrow samples; and the Biocenter Oulu core facilities for electron microscopy and transgenic animals.
Elitsa Y. Dimova, Peppi Koivunen, and Raisa Serpi designed the experiments; Mikko N. M. Myllymäki, Jenni Määttä, Elitsa Y. Dimova, Valerio Izzi, Timo Väisänen, Peppi Koivunen, and Raisa Serpi performed experiments and analyzed the data; Johanna Myllyharju contributed to generating the Hif-p4h-2gt/gt mouse line; Peppi Koivunen supervised the work; and Peppi Koivunen and Raisa Serpi wrote the manuscript.
Johanna Myllyharju owns equity in FibroGen Inc., which develops HIF-P4H inhibitors as potential therapeutics, and the company currently supports research headed by her. We have no additional financial interests.
This study was supported by Academy of Finland grants 218129 (Peppi Koivunen) and Center of Excellence 2012-2017 grant 251314 (Johanna Myllyharju) and by the S. Jusélius Foundation (Peppi Koivunen and Johanna Myllyharju), the Emil Aaltonen Foundation (Peppi Koivunen), the Jane and Aatos Erkko Foundation (Peppi Koivunen and Johanna Myllyharju), and FibroGen Inc. (Johanna Myllyharju).
REFERENCES
- 1.Palis J. 2014. Primitive and definitive erythropoiesis in mammals. Front Physiol 5:3. doi: 10.3389/fphys.2014.00003. [DOI] [PMC free article] [PubMed] [Google Scholar]
- 2.Jelkmann W. 2013. Physiology and pharmacology of erythropoietin. Transfus Med Hemother 40:302–309. doi: 10.1159/000356193. [DOI] [PMC free article] [PubMed] [Google Scholar]
- 3.Lee FS, Percy MJ. 2011. The HIF pathway and erythrocytosis. Annu Rev Pathol Mech Dis 6:165–192. doi: 10.1146/annurev-pathol-011110-130321. [DOI] [PubMed] [Google Scholar]
- 4.Prchal JT, Sokol L. 1996. Benign erythrocytosis and other familial and congenital polycythemias. Eur J Haematol 57:263–268. [PubMed] [Google Scholar]
- 5.Patnaik MM, Tefferi A. 2009. The complete evaluation of erythrocytosis: congenital and acquired. Leukemia 23:834–844. doi: 10.1038/leu.2009.54. [DOI] [PubMed] [Google Scholar]
- 6.Kim CH. 2010. Homeostatic and pathogenic extramedullary hematopoiesis. J Blood Med 1:13–19. doi: 10.2147/JBM.S7224. [DOI] [PMC free article] [PubMed] [Google Scholar]
- 7.Wolber FM, Leonard E, Michael S, Orschell-Traycoff CM, Yoder MC, Srour EF. 2002. Roles of spleen and liver in development of the murine hematopoietic system. Exp Hematol 30:1010–1019. doi: 10.1016/S0301-472X(02)00881-0. [DOI] [PubMed] [Google Scholar]
- 8.Kaelin WG Jr, Ratcliffe PJ. 2008. Oxygen sensing by metazoans: the central role of the HIF hydroxylase pathway. Mol Cell 30:393–402. doi: 10.1016/j.molcel.2008.04.009. [DOI] [PubMed] [Google Scholar]
- 9.Semenza GL. 2012. Hypoxia-inducible factors in physiology and medicine. Cell 148:399–408. doi: 10.1016/j.cell.2012.01.021. [DOI] [PMC free article] [PubMed] [Google Scholar]
- 10.Myllyharju J, Koivunen P. 2013. Hypoxia-inducible factor prolyl 4-hydroxylases: common and specific roles. Biol Chem 394:435–448. doi: 10.1515/hsz-2012-0328. [DOI] [PubMed] [Google Scholar]
- 11.Takeda K, Ho VC, Takeda H, Duan LJ, Nagy A, Fong G-H. 2006. Placental but not heart defects are associated with elevated hypoxia-inducible factor α levels in mice lacking prolyl hydroxylase domain protein 2. Mol Cell Biol 26:8336–8346. doi: 10.1128/MCB.00425-06. [DOI] [PMC free article] [PubMed] [Google Scholar]
- 12.Minamishima YA, Moslehi J, Bardeesy Y, Cullen D, Bronson RT, Kaelin WG Jr. 2008. Somatic inactivation of the PHD2 prolyl hydroxylase causes polycythemia and congestive heart failure. Blood 111:3236–3244. doi: 10.1182/blood-2007-10-117812. [DOI] [PMC free article] [PubMed] [Google Scholar]
- 13.Takeda K, Aguila HL, Parikh NS, Li X, Lamothe K, Duan LJ, Takeda H, Lee FS, Fong GH. 2008. Regulation of adult erythropoiesis by prolyl hydroxylase domain proteins. Blood 111:3229–3235. doi: 10.1182/blood-2007-09-114561. [DOI] [PMC free article] [PubMed] [Google Scholar]
- 14.Franke K, Kalucka J, Mamlouk S, Singh RP, Muschter A, Weidemann A, Iyengar V, Jahn S, Wieczorek K, Geiger K, Muders M, Sykes AM, Poitz DM, Ripich T, Otto T, Bergmann S, Breier G, Baretton G, Fong GH, Greaves DR, Bornstein S, Chavakis T, Fandrey J, Gassmann M, Wielockx B. 2013. HIF-1α is a protective factor in conditional PHD2-deficient mice suffering from severe HIF-2α-induced excessive erythropoiesis. Blood 121:1436–1445. doi: 10.1182/blood-2012-08-449181. [DOI] [PMC free article] [PubMed] [Google Scholar]
- 15.Hyvärinen J, Hassinen IE, Sormunen R, Mäki JM, Kivirikko KI, Koivunen P, Myllyharju J. 2010. Hearts of hypoxia-inducible factor prolyl 4-hydroxylase-2 hypomorphic mice show protection against acute ischemia-reperfusion injury. J Biol Chem 285:13646–13657. doi: 10.1074/jbc.M109.084855. [DOI] [PMC free article] [PubMed] [Google Scholar]
- 16.Kerkelä R, Karsikas S, Szabo Z, Serpi R, Magga J, Gao E, Alitalo K, Anisimov A, Sormunen R, Pietilä I, Vainio L, Koch WJ, Kivirikko KI, Myllyharju J, Koivunen P. 2013. Activation of hypoxia response in endothelial cells contributes to ischemic cardioprotection. Mol Cell Biol 33:3321–3329. doi: 10.1128/MCB.00432-13. [DOI] [PMC free article] [PubMed] [Google Scholar]
- 17.Rahtu-Korpela L, Karsikas S, Hörkkö S, Blanco Sequeiros R, Lammentausta E, Mäkelä KA, Herzig KH, Walkinshaw G, Kivirikko KI, Myllyharju J, Serpi R, Koivunen P. 2014. HIF prolyl-4-hydroxylase-2 inhibition protects mice against obesity and metabolic syndrome. Diabetes 63:3324–3333. doi: 10.2337/db14-0472. [DOI] [PubMed] [Google Scholar]
- 18.Rahtu-Korpela L, Määttä J, Dimova EY, Hörkkö S, Gylling H, Walkinshaw G, Hakkola J, Kivirikko KI, Myllyharju J, Serpi R, Koivunen P. 2016. Hypoxia-inducible factor-prolyl 4-hydroxylase-2 inhibition protects against development of atherosclerosis. Arterioscler Thromb Vasc Biol 36:608–617. doi: 10.1161/ATVBAHA.115.307136. [DOI] [PubMed] [Google Scholar]
- 19.Besarab A, Chernyavskaya E, Motylev I, Shutov E, Kumbar LM, Gurevich K, Chan DT, Leong R, Poole L, Zhong M, Saikali KG, Franco M, Hemmerich S, Yu KH, Neff TB. 2016. Roxadustat (FG-4592): correction of anemia in incident dialysis patients. J Am Soc Nephrol 27:1225–1233. doi: 10.1681/ASN.2015030241. [DOI] [PMC free article] [PubMed] [Google Scholar]
- 20.Besarab A, Provenzano R, Hertel J, Zabaneh R, Klaus SJ, Lee T, Leong R, Hemmerich S, Yu KH, Neff TB. 2015. Randomized placebo-controlled dose-ranging and pharmacodynamics study of roxadustat (FG-4592) to treat anemia in nondialysis-dependent chronic kidney disease (NDD-CKD) patients. Nephrol Dial Transplant 30:1665–1673. doi: 10.1093/ndt/gfv302. [DOI] [PMC free article] [PubMed] [Google Scholar]
- 21.Laitala A, Aro E, Walkinshaw G, Mäki JM, Rossi M, Heikkilä M, Savolainen ER, Arend M, Kivirikko KI, Koivunen P, Myllyharju J. 2012. Transmembrane prolyl 4-hydroxylase is a fourth prolyl 4-hydroxylase regulating EPO production and erythropoiesis. Blood 120:3336–3344. doi: 10.1182/blood-2012-07-441824. [DOI] [PubMed] [Google Scholar]
- 22.Fortini ME, Artavanis-Tsakonas S. 1993. Notch: neurogenesis is only part of the picture. Cell 75:1245–1247. doi: 10.1016/0092-8674(93)90611-S. [DOI] [PubMed] [Google Scholar]
- 23.Artavanis-Tsakonas S, Matsuno K, Fortini ME. 1995. Notch signaling. Science 268:225–232. doi: 10.1126/science.7716513. [DOI] [PubMed] [Google Scholar]
- 24.Egan SE, St Pierre B, Leow CC. 1998. Notch receptors, partners and regulators: from conserved domains to powerful functions. Curr Top Microbiol Immunol 228:273–324. [DOI] [PubMed] [Google Scholar]
- 25.Kopan R, Turner DL. 1996. The Notch pathway: democracy and aristocracy in the selection of cell fate. Curr Opin Neurobiol 6:594–601. doi: 10.1016/S0959-4388(96)80090-0. [DOI] [PubMed] [Google Scholar]
- 26.Honjo T. 1996. The shortest path from the surface to the nucleus: RBP-Jκ/Su(H) transcription factor. Genes Cells 1:1–9. doi: 10.1046/j.1365-2443.1996.10010.x. [DOI] [PubMed] [Google Scholar]
- 27.Lewis J. 1998. Notch signalling. A short cut to the nucleus. Nature 393:304–305. doi: 10.1038/30597. [DOI] [PubMed] [Google Scholar]
- 28.Borgrrefe T, Lauth M, Zwijsen A, Huylebroeck D, Oswald F, Giaimo BD. 2016. The notch intracellular domain integrates signals from Wnt, Hedgehog, TGFβ/BMP and hypoxia pathways. Biochim Biophys Acta 1863:303–313. doi: 10.1016/j.bbamcr.2015.11.020. [DOI] [PubMed] [Google Scholar]
- 29.Weinmaster G. 1997. The ins and outs of Notch signaling. Mol Cell Neurosci 9:91–102. doi: 10.1006/mcne.1997.0612. [DOI] [PubMed] [Google Scholar]
- 30.Bettenhausen B, Hrabe de Angelis M, Simon D, Guénet J-L. 1995. Transient and restricted expression during mouse embryogenesis of Dll1, a murine gene closely related to Drosophila Delta. Development 121:2407–2418. [DOI] [PubMed] [Google Scholar]
- 31.Dunwoodie SL, Henrique D, Harrison SM, Beddington SP. 1997. Mouse Dll3: a novel divergent Delta gene which may complement the function of other Delta homologues during early pattern formation in the mouse embryo. Development 124:3065–3076. [DOI] [PubMed] [Google Scholar]
- 32.Rao PK, Dorsch M, Chickering T, Zheng G, Jiang C, Goodearl A, Kadesch T, McCarthy S. 2000. Isolation and characterization of the Notch ligand Delta4. Exp Cell Res 260:379–386. doi: 10.1006/excr.2000.5034. [DOI] [PubMed] [Google Scholar]
- 33.Lindsell CE, Shawber CJ, Boulter J, Weinmaster G. 1995. Jagged: a mammalian ligand that activates Notch1. Cell 80:909–917. doi: 10.1016/0092-8674(95)90294-5. [DOI] [PubMed] [Google Scholar]
- 34.Shawber C, Boulter J, Lindsell CE, Weinmaster G. 1996. Jagged2: a serrate-like gene expressed during rat embryogenesis. Dev Biol 180:370–376. doi: 10.1006/dbio.1996.0310. [DOI] [PubMed] [Google Scholar]
- 35.Luo B, Aster JC, Hasserjian RP, Kuo F, Sklar J. 1997. Isolation and functional analysis of a cDNA for human Jagged2, a gene encoding a ligand for the Notch1 receptor. Mol Cell Biol 17:6057–6067. doi: 10.1128/MCB.17.10.6057. [DOI] [PMC free article] [PubMed] [Google Scholar]
- 36.Walker L, Carlson A, Tan-Pertel HT, Weinmaster G, Gasson J. 2001. The notch receptor and its ligands are selectively expressed during hematopoietic development in the mouse. Stem Cells 19:543–552. doi: 10.1634/stemcells.19-6-543. [DOI] [PubMed] [Google Scholar]
- 37.Jones P, May G, Healy L, Brown J, Hoyne G, Delassus S, Enver T. 1998. Stromal expression of Jagged 1 promotes colony formation by fetal hematopoietic progenitor cells. Blood 92:1505–1511. [PubMed] [Google Scholar]
- 38.Varnum-Finney B, Purton LE, Yu M, Brashem-Stein C, Flowers D, Staats S, Moore KA, Le Roux I, Mann R, Gray G, Artavanis-Tsakonas S, Bernstein ID. 1998. The Notch ligand, Jagged-1, influences the development of primitive hematopoietic precursor cells. Blood 91:4084–4091. [PubMed] [Google Scholar]
- 39.Walker L, Lynch M, Silverman S, Fraser J, Boulter J, Weinmaster G, Gasson JC. 1999. The Notch/Jagged pathway inhibits proliferation of human hematopoietic progenitors in vitro. Stem Cells 17:162–171. doi: 10.1002/stem.170162. [DOI] [PubMed] [Google Scholar]
- 40.Duncan AW, Rattis FM, DiMascio LN, Congdon KL, Pazianos G, Zhao C, Yoon K, Cook JM, Willert K, Gaiano N, Reya T. 2005. Integration of Notch and Wnt signaling in hematopoietic stem cell maintenance. Nat Immunol 6:314–322. doi: 10.1038/ni1164. [DOI] [PubMed] [Google Scholar]
- 41.Inra CN, Zhou BO, Acar M, Murphy MM, Richardson J, Zhao Z, Morrison SJ. 2015. A perisinusoidal niche for extramedullary haematopoiesis in the spleen. Nature 527:466–471. doi: 10.1038/nature15530. [DOI] [PMC free article] [PubMed] [Google Scholar]
- 42.Gustafsson MV, Zheng X, Pereira T, Gradin K, Jin S, Lundkvist J, Ruas JL, Poellinger L, Lendahl U, Bondesson M. 2005. Hypoxia requires notch signaling to maintain the undifferentiated cell state. Dev Cell 9:617–628. doi: 10.1016/j.devcel.2005.09.010. [DOI] [PubMed] [Google Scholar]
- 43.Chen H, Houshmand G, Mishra S, Fong G-H, Gittes GK. 2010. Impaired pancreatic development in Hif2-alpha deficient mice. Biochem Biophys Res Commun 399:440–445. doi: 10.1016/j.bbrc.2010.07.111. [DOI] [PubMed] [Google Scholar]
- 44.Hu YY, Fu LA, Li SZ, Chen Y, Li JC, Han J, Liang L, Li L, Ji CC, Zheng MH, Han H. 2014. Hif-1α and Hif-2α differentially regulate Notch signaling through competitive interaction with the intracellular domain of Notch receptors in glioma stem cells. Cancer Lett 349:67–76. doi: 10.1016/j.canlet.2014.03.035. [DOI] [PubMed] [Google Scholar]
- 45.Arsenault PR, Pei F, Lee R, Kerestes H, Percy MJ, Keith B, Simon MC, Lappin TR, Khurana TS, Lee FS. 2013. A knock-in mouse model of human PHD2 gene-associated erythrocytosis establishes a haploinsufficiency mechanism. J Biol Chem 288:33571–33584. doi: 10.1074/jbc.M113.482364. [DOI] [PMC free article] [PubMed] [Google Scholar]
- 46.Johnson DW, Pollock CA, MacDougall I. 2007. Erythropoiesis-stimulating agent hyporesponsiveness. Nephrology 12:321–330. doi: 10.1111/j.1440-1797.2007.00810.x. [DOI] [PubMed] [Google Scholar]
- 47.Flygare J, Estrada VR, Shin C, Gupta S, Lodish HF. 2011. HIF1α synergizes with glucocorticoids to promote BFU-E progenitor self-renewal. Blood 117:3435–3444. doi: 10.1182/blood-2010-07-295550. [DOI] [PMC free article] [PubMed] [Google Scholar]