Abstract
GM-CSF signaling regulates hematopoiesis and immune responses. CSF2RA, the gene encoding the α subunit for GM-CSF, is significantly downregulated in t(8;21) (RUNX1-ETO or RE) leukemia patients, suggesting that it may serve as a tumor suppressor. We previously reported that GM-CSF signaling is inhibitory to RE leukemogenesis. Here we conducted gene expression profiling of primary RE hematopoietic stem/progenitor cells (HSPCs) treated with GM-CSF to elucidate the mechanisms mediating the negative effects of GM on RE leukemogenicity. We observed that GM treatment of RE HSPCs resulted in a unique gene expression profile that resembles primary human cells undergoing myelopoiesis, which was not observed in control HSPCs. Additionally we discovered that GM-CSF signaling attenuates MYC-associated gene signatures in RE HSPCs. In agreement with this, a functional screen of a subset of GM-CSF-responsive genes demonstrated that a MYC inhibitor, MXI1, reduced the leukemic potential of RE HSPCs and t(8;21) AML cells. Furthermore, MYC knockdown and treatment with the BET inhibitor JQ1 reduced the leukemic potential of t(8;21) cell lines. Altogether, we discovered a novel molecular mechanism mediating the GM-CSF-induced reduction in leukemic potential of RE cells, and our findings support MYC inhibition as an effective strategy for reducing the leukemogenicity of t(8;21) AML.
Introduction
Granulocyte macrophage-colony stimulating factor (GM-CSF or GM) is a multifunctional cytokine that regulates proliferation, survival, hematopoietic differentiation, and activation of immune responses1. Expression of GM and its receptor, a complex composed of alpha (CSF2RA) and beta (CSF2RB) subunits, has been found to be dysregulated in various leukemias2, 3, which suggests GM signaling also plays a role in regulating leukemia cells. Along these lines, we previously reported a novel inhibitory role of GM signaling in a t(8;21)-induced acute myeloid leukemia (AML) murine model4.
The t(8;21)(q22;q22) is one of the most commonly observed cytogenetic aberrations in adult AML patients5, 6. Although t(8;21) AML is generally associated with favorable prognoses, the 5-year survival rate is around 50% and patients frequently relapse, implying a need for alterative therapeutic strategies for targeting t(8;21) AML7–9. The t(8;21) generates the oncofusion protein RUNX1-ETO (also known as RUNX1-RUNX1T1, AML1-ETO, AML1-MTG8, hereinafter referred to as RE), which contains the N-terminal DNA binding domain of RUNX1 (AML1), a transcription factor that functions as a master regulator of hematopoiesis, and the majority of the transcriptional corepressor ETO10. Although RE alone is insufficient for leukemogenesis and requires additional secondary mutations, RE induces an early myeloid differentiation block, enhances self-renewal, and promotes expansion of hematopoietic stem/progenitor cells (HSPCs), which together increase leukemic potential5, 11–14.
One frequently observed coinciding cytogenetic abnormality in t(8;21) patients is loss of a sex chromosome (LOS), which is detected in 32–59% of patients15. The high incidence of LOS in t(8;21) AML suggests that potential tumor suppressor genes may reside on the sex chromosomes. The similar frequency of X and Y chromosome loss further suggests they may be located in regions homologous between and expressed by both sex chromosomes, such as the pseudoautosomal regions (PARs). Examination of PAR genes revealed CSF2RA as the most significantly downregulated PAR gene in t(8;21) patients compared to non-t(8;21) M2 AML patients16, 17.
CSF2RA encodes the alpha subunit of the GM receptor. LOS-driven haploinsufficiency of CSF2RA decreases functional GM receptors, and renders t(8;21) AML cells hyporesponsive to GM. We previously reported that GM signaling inhibits t(8;21) leukemogenesis by reducing the self-renewal potential of RE hematopoietic stem/progenitor cells (HSPCs)4. Thus, hyporesponsiveness to GM in t(8;21) cells allows the cells to escape the negative effects of GM signaling, which ultimately promotes leukemogenesis. In accordance with this, leukemia cells from t(8;21) patients are hyporesponsive to GM and have reduced GM binding18, 19. These observations suggest that in RE HSPCs, certain GM-induced molecular events mediate the negative effects of GM signaling in preventing leukemic cell transformation. Direct reactivation or restoration of these mechanisms may serve as an alternative therapeutic strategy for treating t(8;21) AML patients, including those who are hyporesponsive to GM.
To gain insights into the GM-induced inhibition of leukemic transformation of RE cells, we examined the gene expression profile of primary RE HSPCs in response to GM. We found that GM induces a gene expression profile in RE HSPCs that correlates with primary human myelopoiesis, which is not observed in control cells. Additionally, we discovered that GM attenuates MYC-associated gene signatures in RE HSPCs by restoring expression of a subset of MYC-repressed targets, which promote myeloid differentiation and apoptosis. Furthermore, a functional screen of GM-stimulated genes revealed that Max interactor 1 (MXI1), an inhibitor of MYC20, diminishes the self-renewal potential of RE HSPCs. Our finding that GM signaling counteracts MYC-associated gene signatures, but only in the presence of RE, provides mechanistic clarification for the importance of GM signaling in inhibiting RE leukemogenesis. Additionally, we found that MYC inhibition remains a viable method for reducing leukemic potential of t(8;21) AML cells, including those that are hyporesponsive to GM.
Materials and Methods
Gene expression profiling
Lin− cells isolated from bone marrow of C57BL/6 mice were transduced with control (MIG) or RE retrovirus. The subsequent day, cells were washed and treated with 10 ng/mL recombinant murine GM (Peprotech, Rocky Hill, NJ) for 24 hours in StemSpan serum-free expansion medium (SFEM) (StemCell Technologies, Vancouver, BC). Lin−/c-Kit+/GFP+ cells were sorted using a BD FACS Aria II (BD Biosciences, San Jose, CA) and RNA was isolated with the RNeasy Micro Kit (Qiagen, Hilden, Germany). Total RNAs from three independent experiments were labeled and hybridized on Mouse Ref-8 v2.0 Expression BeadChips following manufacturer’s protocol (Illumina, San Diego, CA). RNA quality control and sample preparation for BeadChips were performed at the UCSD, Biomedical Genomics Core Facility. The microarray data have been deposited in the Gene Expression Omnibus database and are accessible through GEO series number GSE72567.
Replating assays
Initially after transduction, 1 × 10⁵ transduced primary murine bone marrow cells were seeded for one week of drug selection in M3134 (StemCell Technologies) supplemented with 20% bovine serum albumin, insulin, and transferrin (BIT 9500, StemCell Tech), 15% fetal bovine serum (FBS) 100 U/mL penicillin/streptomycin, 10ng/mL rmIL-3 (Peprotech), 50ng/mL rmSCF (Peprotech), and 10ng/mL rhIL-6 (Peprotech). For selection, 1µg/mL puromycin (Sigma) and 500µg/mL G418 (Sigma) were used, when applicable. Each subsequent week, cells were resuspended and 1 × 10⁴ cells were replated with half the aforementioned drug concentrations.
Western blot
Primary antibodies included rabbit anti-c-Myc antibody (1:5000) (Abcam, ab32072. Cambridge, UK) and mouse anti-β-actin antibody (1:20,000) (Sigma, A2228. St. Louis, MO). Licor (Lincoln, NE) IRDye 680 anti-rabbit (926–32221) and IRDye 800 anti-mouse (926–32210) secondary antibodies (1:10000) were used for visualization on a LI-COR Odyssey Classic imager.
Statistical analysis
Statistical significance was determined from adequately powered sample sizes of similar variation using two-tailed unpaired Student’s t-tests and was defined as P < 0.05. Sample sizes are given in figure legends.
For additional materials and methods, please see Supplemental Information.
Results
GM induces a human myelopoiesis gene expression profile in RE HSPCs
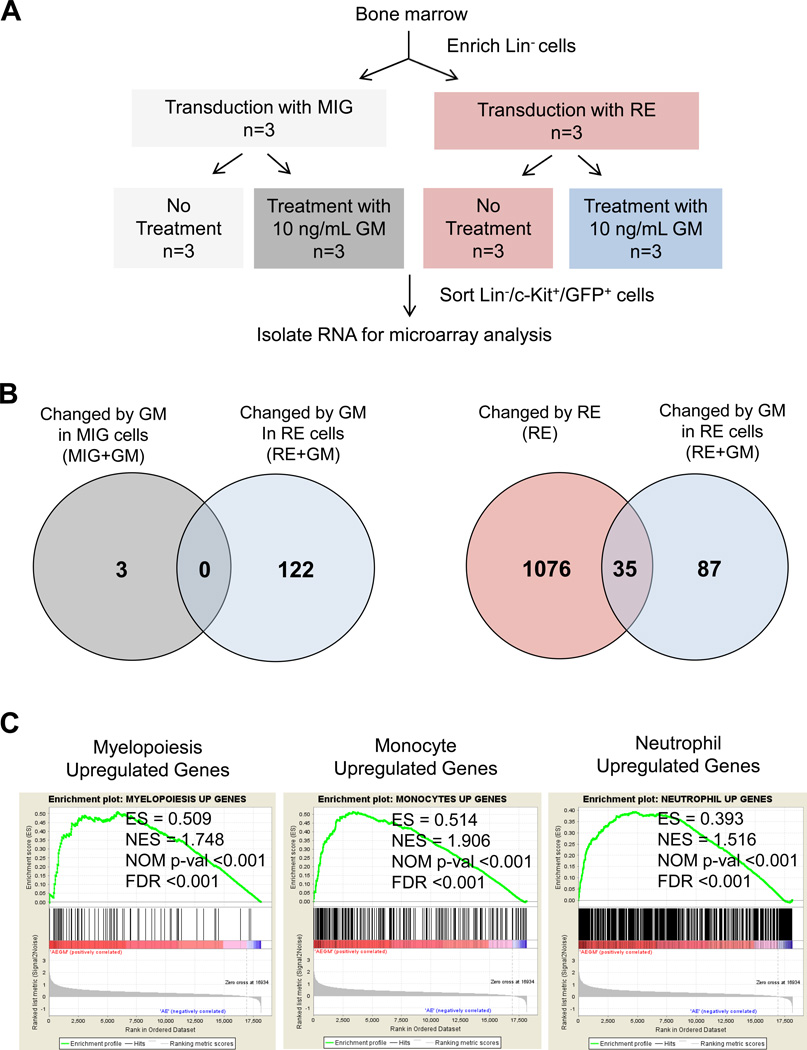
To gain insight into the molecular mechanisms mediating the inhibitory effects of GM on leukemic transformation of RE cells, we examined the gene expression profile of control (MIG) and RE-expressing (MIG-RE) HSPCs (Lin−/c-Kit+/GFP+) after 10 ng/mL GM treatment (Figure 1A, Figure S1A).
Figure 1. Gene expression profiling of murine RE HSPCs treated with GM.
(A) Diagram of experimental methods for gene expression profiling of murine RE HSPCs treated with GM. Lineage negative (Lin−) cells were transduced with empty vector control (MIG) or MIG-RE (RE) retrovirus. The following day, cells were washed and cultured in StemSpan SFEM media with or without 10 ng/mL GM for 24 hours. Lin−/c-Kit+/GFP+ cells were isolated by FACS and used for microarray analysis. (B) Venn diagram displaying the number of unique and overlapping differentially expressed genes after each perturbation. GM-treated control MIG HSPCs were compared to untreated MIG HSPCs (MIG+GM, left Venn diagram). GM-treated RE HSPCs were compared to untreated RE HSPCs (RE+GM, left Venn diagram). RE cells were compared to control MIG cells (RE, right Venn diagram). GM-treated RE cells were compared to untreated RE cells (RE+GM, right Venn diagram). A 2-fold differential gene expression cutoff was applied. (C) Gene set enrichment analysis (GSEA) of the RE+GM gene expression signature with human myelopoiesis, monocyte, and neutrophil gene sets generated from publicly available data from Ferrari et al23. The enrichment score (ES), nominal enrichment score (NES), nominal p-value (NOM p-val), and false discovery rate (FDR) for each gene set are shown.
Microarray data analysis revealed that only 3 genes were differentially expressed after GM treatment of control MIG HSPCs (Figure 1B, left). In contrast, 122 genes were differentially expressed after GM treatment of RE HSPCs compared to untreated RE HSPCs, none of which overlapped with the MIG+GM differentially expressed genes. RE expression alone induced differential expression of 1111 genes (Figure 1B, right); however, 35 of these 1111 genes were further differentially expressed upon GM treatment (Figure S1B). Furthermore, GM treatment of RE cells (RE+GM) uniquely affected 87 genes (Figure S1C), which were unchanged by RE expression alone or by GM treatment of control cells. Gene Set Enrichment Analysis (GSEA) confirms that our RE gene expression signatures significantly correlate with previously published datasets of RE expression in HSPCs (Figure S1D)21, 22. The microarray data was validated by qRT-PCR (Figure S2). GSEA also identified significant correlation of RE+GM differentially expressed genes with the gene expression signatures from a murine myeloid cell line expressing two distinct constitutively active forms of the GM receptor22, which confirms these were GM-induced genes (Figure S3A).
Although murine HSPCs were used for gene expression profiling, we also conducted GSEA with our dataset using human myelopoiesis gene expression data published by Ferrari et al23. This analysis revealed that the murine RE+GM gene expression signature displayed significant correlation with that of primary human HSPCs undergoing myelopoiesis, including monocytes and neutrophils (Figure 1C, Figure S3B). Additionally, because these effects of GM were not observed in control cells, our results reveal the importance of and requirement for RE expression to enable GM to induce a unique gene expression profile that correlates with human myeloid differentiation programs. This is of importance because RE enforces an early myeloid differentiation block in HSPCs and our findings indicate that GM aids them in overcoming this block and promotes their differentiation.
GM promotes differentiation and reduces the LTC-IC frequency of primary human RE HSPCs
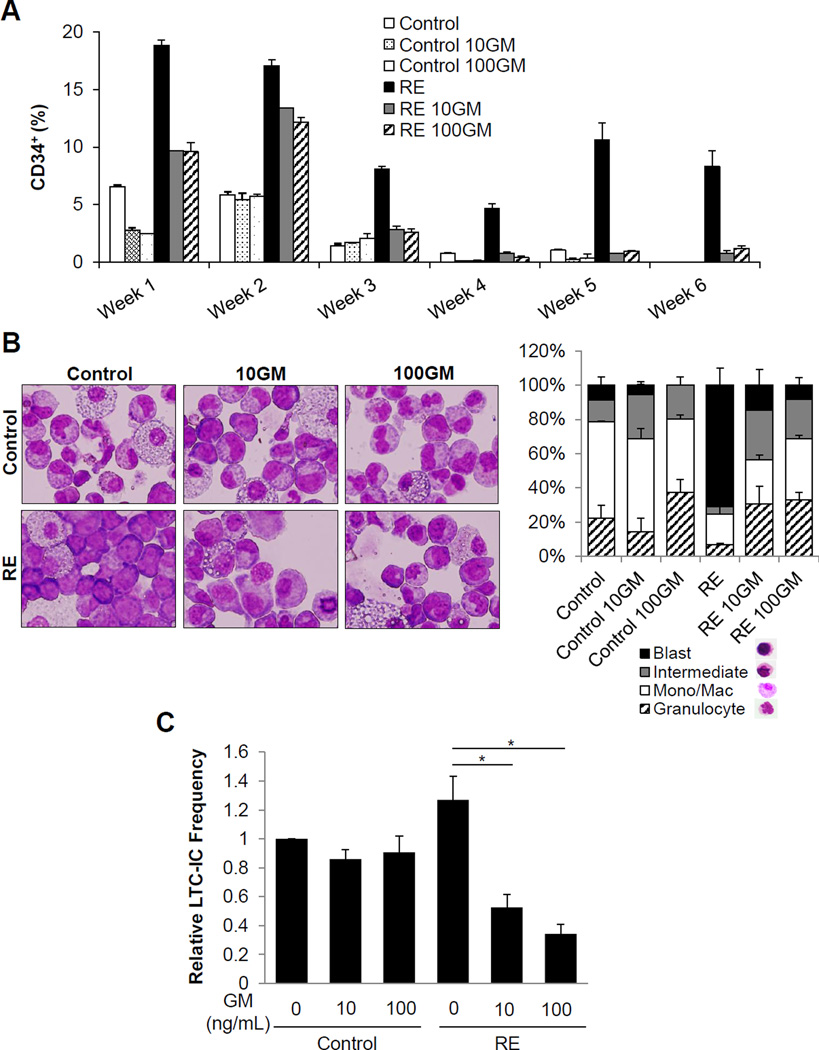
Our previous work revealed that GM signaling negatively affects RE-induced leukemogenesis in the murine system4. Therefore, we sought to validate this negative effect of GM on primary human RE HSPCs. CD34+ cells transduced with MIG control or RE retrovirus were sorted and confirmed for RE expression (Figure S4A, B). As was previously reported, we observed that RE expression results in a higher percentage of immature cells expressing CD34, compared to control (Figure 2A and Figure S5)24. In the presence of 10 ng/mL (10GM) or 100 ng/mL (100GM) GM, we detected an accelerated reduction in the percentage of CD34+ RE cells. Meanwhile, GM also increased the total number of cells in culture as was reported previously (Figure S6)25. Morphological analysis of cells cultured in methylcellulose showed immature blast-like cells with RE expression, which were reduced upon GM treatment, indicating GM relieves the RE-induced early myeloid differentiation block (Figure 2B). This reflects the GSEA finding, which correlated the RE+GM gene expression signature with human myelopoiesis.
Figure 2. GM promotes differentiation and reduces the LTC-IC frequency of primary human RE HSPCs.
(A) Percentage of CD34+ cells, as determined by flow cytometric analysis, of sorted primary human CD34+/GFP+ control and RE cells in liquid culture with 0 ng/mL (Control), 10 ng/mL (10GM), and 100ng/mL (100GM) GM. Error bars represent standard deviation (SD) of technical replicates of a representative experiment. Two additional independent experiments are shown in Figure S4. (B) Wright-Giemsa staining and differential counts of sorted CD34+/GFP+ control and RE cells seeded in methycellulose with 0 ng/mL (Control), 10 ng/mL (10GM), and 100 ng/mL (100GM) GM for 17 days of culture. Error bars represent SD of technical replicates of a representative experiment. (C) Relative limiting dilution LTC-IC frequencies of sorted CD34+/GFP+ control MIG or RE cells with increasing concentrations of GM. Frequencies were normalized to control cells with no GM treatment. Error bars represent standard error of the mean (SEM) of 3 experiments (* indicates p < 0.05).
To further investigate the effects of GM on long-term culture-initiating cell (LTC-IC) frequency, we performed limiting dilution LTC-IC assays of sorted primary human control and RE CD34+ cells cultured with GM26. GM did not affect LTC-IC frequencies of control cells. However, the LTC-IC frequencies of RE cells were significantly reduced in the presence of GM (Figure 2C). These results reflect the gene expression profiling data and demonstrate that GM treatment in the presence of RE also elicits a unique effect on primary human RE cells, which ultimately aids them in overcoming their RE-induced myeloid differentiation block and reduces their LTC-IC frequency.
Characterization of the GM-induced gene expression profile in counteracting RE HSPC self-renewal potential
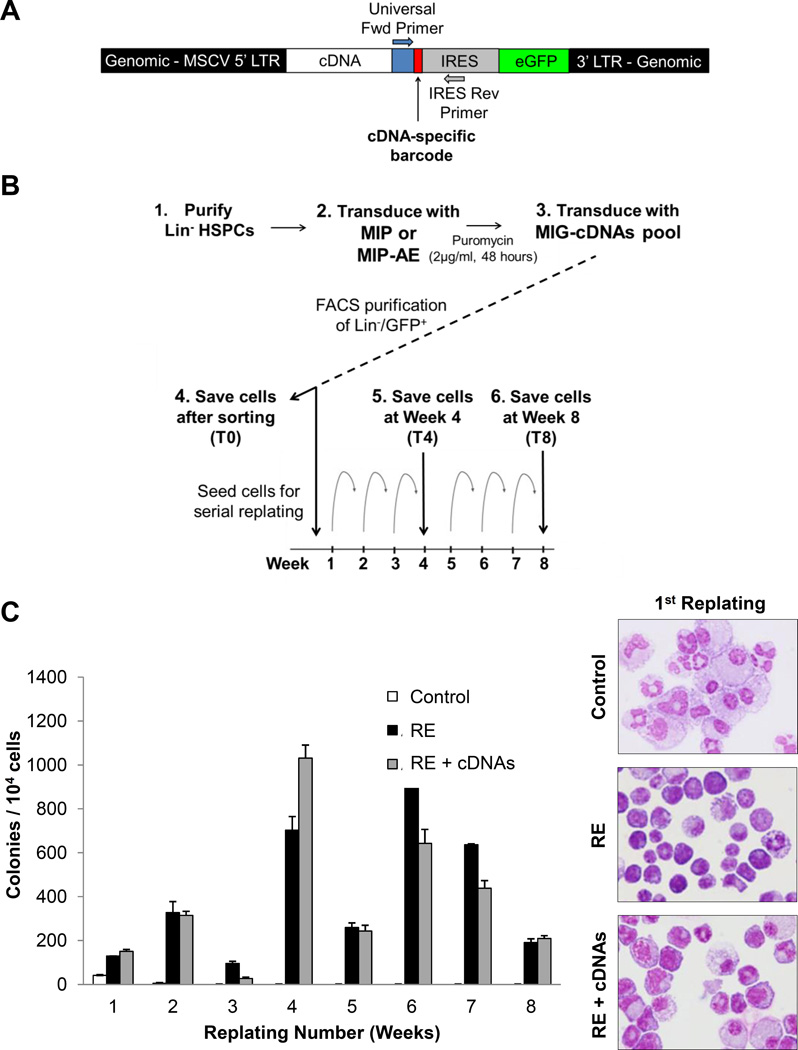
We sought to identify GM-activated mechanisms of reducing leukemic potential of RE HSPCs with aims to activate or restore them as an alternative method of inducing a GM-like response in t(8;21) cells. RE expression enhances self-renewal potential and confers serial replating ability in vitro12, 13, which has been demonstrated to be inhibited by GM in our previous studies4. Therefore, we conducted a functional screen to identify genes capable of reducing the self-renewal potential of RE cells. Many of the GM-induced genes in RE HSPCs did not exhibit dramatic upregulation, suggesting that the modest but concerted upregulation of a group of genes may be cooperatively functioning to mediate the negative effects of GM on RE HSPCs. However, we aimed to identify individual genes, which are able to reduce the self-renewal capacity of RE HSPCs. Pathway analysis assisted in the selection of 10 genes of interest (See Supplemental Methods and Figure S7 for details), and a barcoded cDNA mini-library was generated to screen multiple genes simultaneously. Each cDNA was cloned into the MIG vector, along with a common primer sequence and a cDNA-specific barcode (Figure 3A). Murine HSPCs were co-transduced with puromycin resistance MIP-RE retrovirus and control MIG or a pool of barcoded MIG-cDNA retroviruses. After selection for puromycin resistance and sorting for GFP expression, cells were serially replated for 8 weeks. A subset of cells was saved just after selection (T0), midway at 4 weeks (T4), and at the final timepoint of 8 weeks (T8) (Figure 3B). Retroviral integration of the vector into genomic DNA allows for PCR amplification of the cDNA-specific barcode region from purified genomic DNA using common primers. Next-generation sequencing of the resulting PCR products identified and quantified barcodes present at each timepoint (Figure S8).
Figure 3. Expression of GM-induced genes in RE HSPCs promotes differentiation.
(A) Schematic of genomic DNA from cells transduced with barcoded cDNA retrovirus. A common forward universal primer and IRES reverse primer are utilized to PCR amplify the barcode region from transduced cells. (B) Diagram outlining the serial replating cDNA screen. Mouse Lin− HSPCs were transduced with control MIP or MIP-RE, selected with puromycin, and co-transduced with control MIG or a pool of barcoded cDNAs (MIG-cDNAs). Lin−/GFP+ cells were sorted and seeded for serial replating. Cells were saved after sorting as the initial timepoint (T0), and GFP+ cells were sorted and saved after 4 weeks (T4) and 8 weeks (T8) of replating for quantitative barcode analysis. (C) Colony numbers of control, RE, and RE + cDNAs cells over the course of 8 weeks. Wright-Giemsa staining of cells after the first plating (original magnification, 400×).
As expected, control cells lost replating ability, whereas cells transduced with RE or RE + cDNAs continued replating (Figure 3C). Morphological analysis of cells after the first replating indicated that co-expression of RE and the pool of cDNAs resulted in enhanced myeloid differentiation when compared to RE alone. However, because the RE + cDNAs and control RE colony numbers were relatively similar, this suggests there existed cDNAs in the pool that do not elicit inhibitory effects on the self-renewal capacity of RE cells.
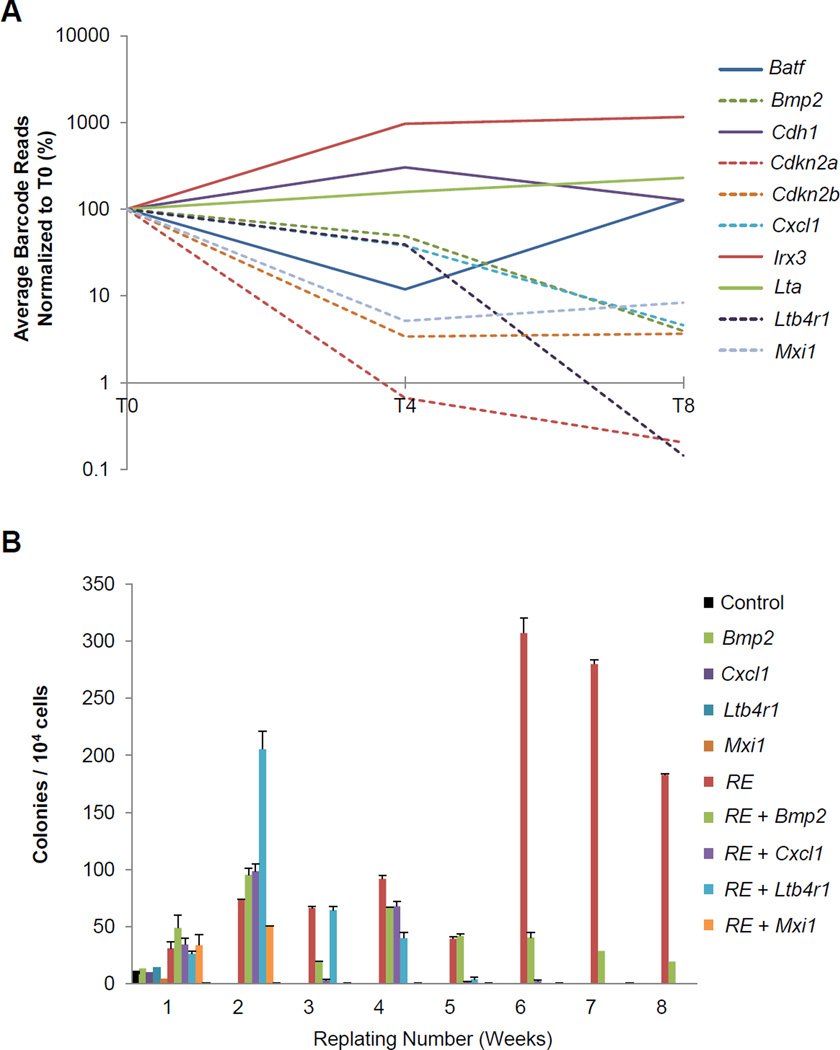
RE cells expressing a cDNA that reduces self-renewal capacity and/or induces differentiation or apoptosis would be expected to have a disadvantage in serial replating. Consequently, these cells would be less abundant or absent at later timepoints and fewer of those cDNA barcodes would be detected over the course of the experiment. Quantification of the barcodes present at each timepoint revealed that 6 of the 10 cDNAs displayed a statistically significant dropout by T8 (Figure 4A and Table S1). Cdkn2a and Cdkn2b, two well-established tumor suppressors that inhibit cell cycle progression, demonstrated significant dropout27. Bmp2, Cxcl1, Ltb4r1, and Mxi1, also significantly dropped out, and independent replatings validated the results from the screen (Figure 4B).
Figure 4. Barcode screen reveals GM-induced genes that reduce RE HSPC self-renewal capacity.
(A) Percentage of barcode reads identified by sequencing of GFP+ cells saved from T0, T4, and T8, normalized to T0. Percentages are the average of three independent experiments. (B) Serial replating assay of control or RE cells co-transduced with individual cDNAs that displayed significant dropout by T8 from the barcoded screen. Error bars represent SD of technical replicates of a representative experiment.
MYC-associated gene signatures are attenuated in GM-treated RE HSPCs
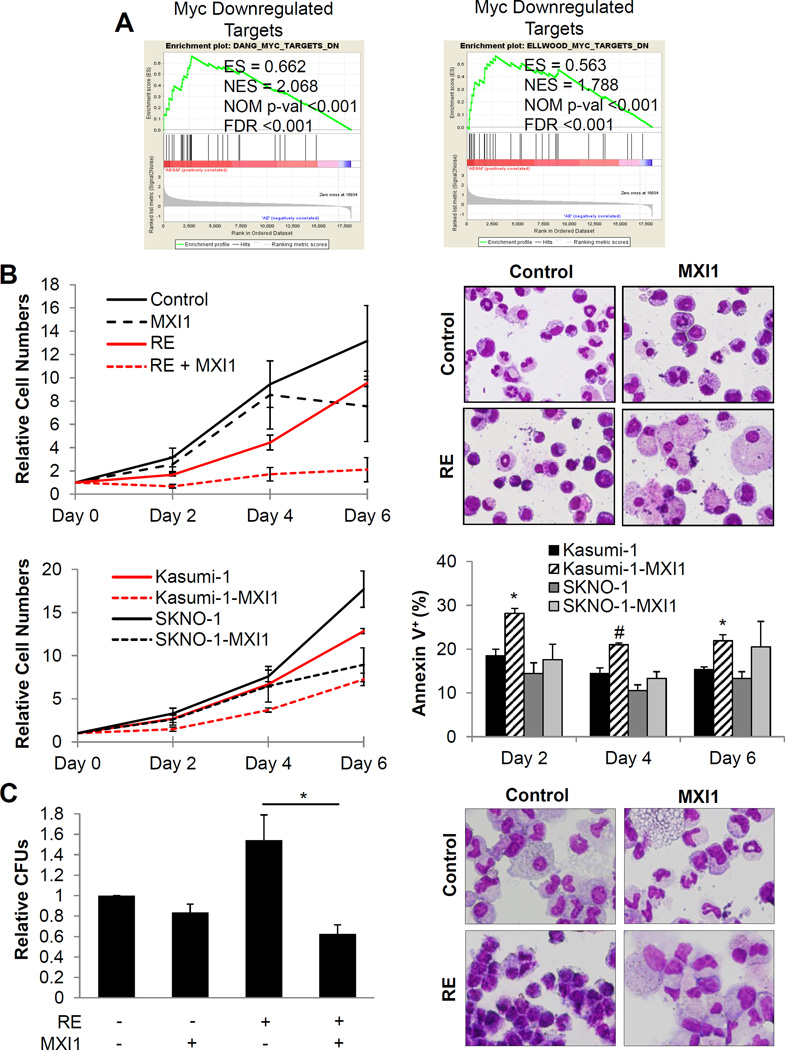
To further assist in selecting a candidate from our dropout screen, we utilized GSEA and Ingenuity Pathway Analysis (IPA) to identify significantly altered pathways that possessed functional relation with the genes from our cDNA screen (Figure S9, Table S2). Together, the screen and pathway analysis assisted in identifying critical pathways facilitating the negative effects of GM on RE HSPC leukemic potential. One significantly altered pathway in GM-treated RE HSPCs was the MYC pathway. GSEA revealed that GM treatment of RE HSPCs restores the expression of MYC-downregulated targets from two independent data sets, which suggests that GM partially attenuates MYC-associated gene signatures in RE cells (Figure 5A)28, 29. Additionally, IPA upstream regulator analysis predicted MYC to be inhibited in RE HSPCs treated with GM (Table S2). Interestingly, the microarray data revealed that Myc expression was unaffected after GM treatment of RE HSPCs.
Figure 5. GM treatment of RE HSPCs results in attenuation of MYC-associated gene signatures and MXI1 expression reverses RE-associated phenotypes.
(A) GSEA of RE+GM differentially expressed genes significantly correlated with two MYC downregulated targets gene sets. The enrichment score (ES), nominal enrichment score (NES), nominal p-value (NOM p-val), and false discovery rate (FDR) for each gene set are shown. (B) Relative cell numbers of primary mouse bone marrow cells co-transduced with empty vector control or RE and empty vector control or MXI1 in liquid culture and Wright-Giemsa staining of Day 4 cells (top). Cell numbers for each condition were normalized to their respective Day 0 cell counts. Error bars represent SEM of 3 independent experiments. Montage images were made for some due to low cell numbers and density on cytospin slides. (Original magnification, 400×). Relative cell numbers of and flow cytometric analysis of the percentage of Annexin V+ Kasumi-1 and SKNO-1 cells transduced with control or MXI1 in liquid culture (bottom). Cell numbers for each condition were normalized to their respective Day 0 cell counts. Error bars indicate SEM of 3 independent experiments (* indicates p < 0.05, #indicates p < 0.01). (C) Relative colony forming units (CFUs) and Wright-Giemsa staining of sorted primary human CD34+ cells transduced with RE and MXI1 after 17 days in methycellulose. CFUs were normalized to control cells with no RE or MXI1 expression. Error bars represent SEM of 3 independent experiments (* indicates p < 0.05).
GSEA also showed that RE+GM upregulated genes significantly correlated with C/EBP family target genes (Figure S10)30, although none of the CEBPs themselves were upregulated. The C/EBP family of transcription factors regulates differentiation of various cell types, including myeloid cells31. IPA upstream regulator analysis also predicted CEBPB activation (Table S2).
Our pathway analyses revealed that GM upregulates MYC-repressed targets and CEBP-activated targets in RE HSPCs independently of MYC downregulation and CEBP upregulation, respectively, to concomitantly reduce leukemic potential.
Inhibition of MYC in RE HSPCs and t(8;21) cell lines reduces leukemic potential
The aforementioned pathway analyses converged on attenuated MYC gene signatures, suggesting MYC as a critical regulator of RE leukemic potential. Therefore, we focused on Mxi1, a cDNA which displayed significant dropout in our screen. MXI1, MAX interacting protein-1, competitively binds to the obligatory MYC binding partner MAX to interfere with the MAX-MYC heterodimerization necessary for MYC transcriptional activity20.
Co-expression of MXI1 with RE in primary murine BM cells demonstrated that MXI1 significantly inhibited RE cell proliferation (Figure 5B, top) and induced apoptosis (Figure S11). Morphological analysis revealed enhanced monocyte and macrophage differentiation in RE cells expressing MXI1. Kasumi-1 and SKNO-1, the only established t(8;21) cell lines, are chemoresistant and suffer from LOS32, 33. Although Kasumi-1 cells have also been found to be hyporesponsive to GM34, expression of MXI1 in these cells reduced proliferation and induced apoptosis (Figure 5B, bottom), which indicates they remain sensitive to MYC inhibition. MXI1 had similar effects in SKNO-1 cells, though to a lesser extent. These effects were not observed in the non-t(8;21) myeloid cell lines U937 and K562 (Figures S12 and S13). MXI1 expression also specifically reduced the colony forming ability and promoted myeloid differentiation of primary human CD34+ RE HSPCs (Figure 5C).
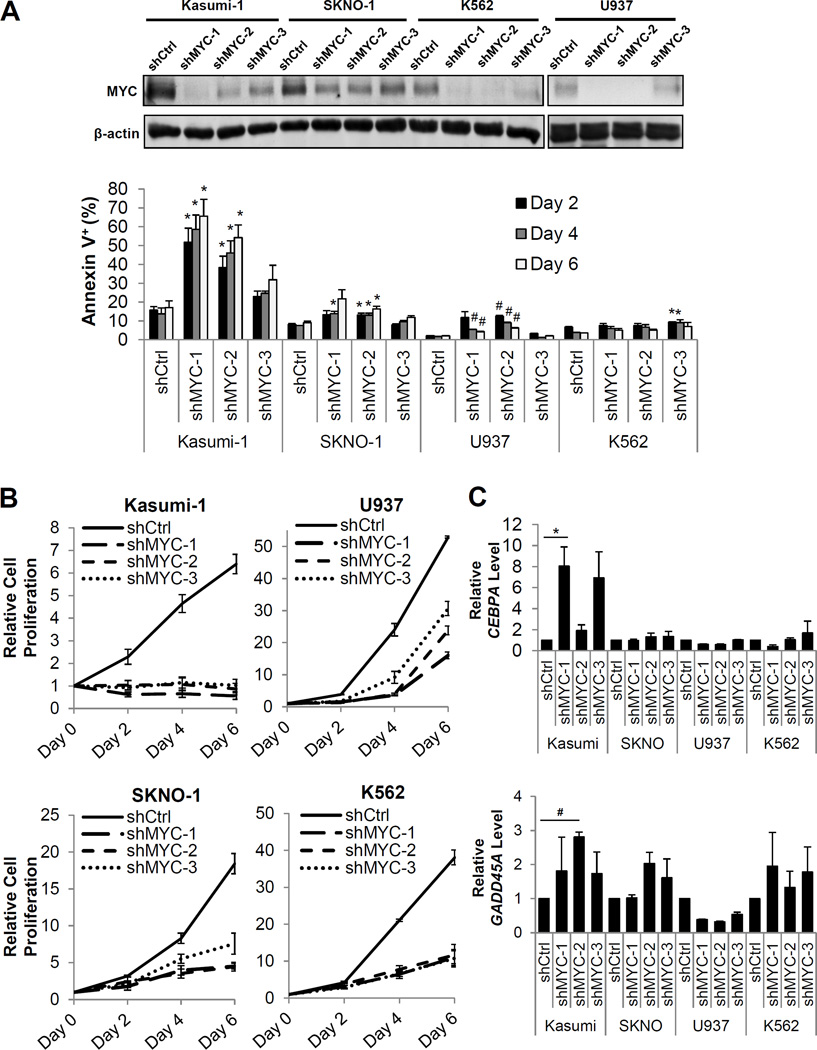
In order to verify that the effects of MXI1 are due to its role in regulating MYC activity, we knocked down MYC using three independent shRNA sequences in Kasumi-1, SKNO-1, U937, and K562 cells. Although the t(8;21) cell lines Kasumi-1 and SKNO-1 displayed less MYC knockdown compared to the non-t(8;21) cell lines U937 and K562 (Figure 6A, top and Figure S14), they displayed greater increases in apoptosis upon MYC knockdown (Figure 6A, bottom) and greater reductions in cell proliferation (Figure 6B), indicating they are highly dependent on MYC for survival and proliferation. Expression of two critical MYC-repressed targets, CEBPA and GADD45A, upon MYC knockdown was also examined. C/EBPα is a critical regulator of granulopoiesis and its expression enables hematopoietic progenitors to differentiate. Importantly, RE also represses CEBPA expression, which results in the early myeloid differentiation block that is characteristic of RE expression35, 36. GADD45A has been reported to function as a tumor suppressor by inhibiting cell cycle progression and promoting apoptosis37, and its methylation has been implicated in poor prognostic outcome in AML38. Interestingly, although the t(8;21) Kasumi-1 cells displayed less MYC knockdown compared to the non-t(8;21) U937 and K562 cells, the expression of the critical MYC-repressed targets CEBPA and GADD45A was restored in these cells (Figure 6C).
Figure 6. MYC knockdown reduces proliferation and induces apoptosis in t(8;21) human cells.
(A). Western blot analysis of MYC levels in cells expressing non-targeting control shRNAs or 3 unique shRNAs targeting MYC (top) and flow cytometric analysis of the percentage of Annexin V+ apoptotic cells upon MYC knockdown (bottom). Error bars represent SEM of 3 independent experiments (* indicates p < 0.05, #indicates p < 0.01). (B) Relative cell numbers of Kasumi-1 (top, left), SKNO-1 (bottom, left), U937 (top, right), and K562 (bottom, right) cells upon MYC knockdown. Error bars represent SEM of 3 independent experiments. (C) Quantitative reverse transcription PCR (qRT-PCR) of CEBPA mRNA levels (top) and GADD45A mRNA levels (bottom) upon MYC knockdown at Day 4. The mRNA levels were normalized to the respective controls for each cell line. Error bars represent SEM of 3 independent experiments (* indicates p < 0.05, #indicates p < 0.01).
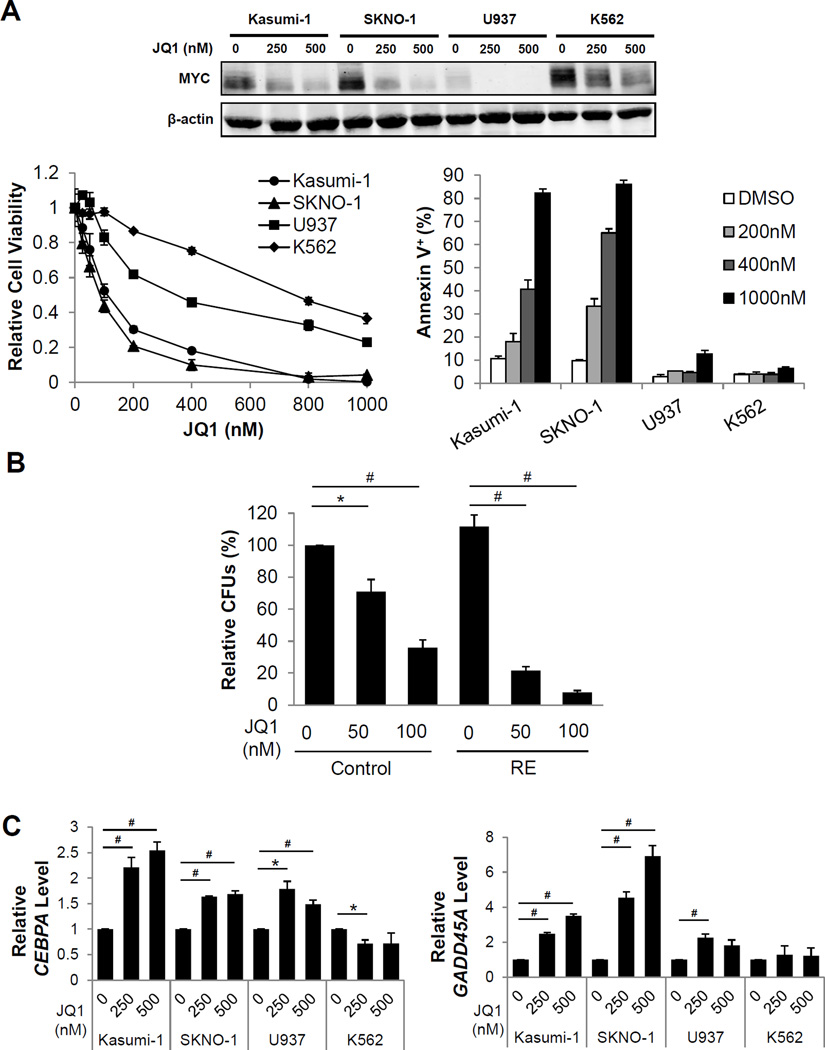
JQ1, a small molecule inhibitor of the bromodomain and extra terminal domain (BET) protein family of chromatin adaptors, has been demonstrated to downregulate MYC expression39. However, tumor cells display varying sensitivity to JQ1 in MYC downregulation40. Therefore, we investigated whether JQ1 could effectively downregulate MYC in chemoresistant t(8;21) cell lines and elicit similar phenotypes as shRNA-mediated knockdown of MYC. In fact, the t(8;21) cell lines exhibited efficient and greater reduction in MYC upon JQ1 treatment, compared to non-t(8;21) cell lines (Figure 7A, Figure S15). Additionally, reduced cell viability, increased apoptosis (Figure 7A, bottom and Figure S16), and reduced colony forming ability (Figure S17) of t(8;21) cell lines were observed at much lower concentrations of JQ1 compared to non-t(8;21) cell lines. The effect of JQ1 on the colony forming ability of primary human CD34+ RE HSPCs was also found to be more significantly reduced at lower concentrations of JQ1 compared to control CD34+ HSPCs (Figure 7B). These results reinforce that JQ1 treatment reduces leukemia cell proliferation in an RE9a/NRasG12D/p53−/− AML mouse model41, and indicates that JQ1 also reduces the leukemic potential of primary human RE cells. Expression of the critical MYC-repressed targets CEBPA and GADD45A were also restored upon JQ1 treatment in the t(8;21) cell lines, and to a lesser extent in U937 cells (Figure 7C).
Figure 7. JQ1 treatment reduces proliferation and induces apoptosis in t(8;21) cell lines.
(A) Western blot analysis of MYC levels (top), viability (bottom, left), and flow cytometric analysis of the percentage of Annexin V+ cells (bottom, right) of Kasumi-1, SKNO-1, U937, and K562 cells treated with indicated JQ1 concentrations. Error bars represent SEM of 3 independent experiments. (B) Relative colony forming units (CFUs) of sorted primary human CD34+ cells transduced with control or RE and seeded with indicated concentrations of JQ1. CFUs were normalized to untreated control cells. Error bars indicate SEM of 3 independent experiments (* indicates p < 0.05, # indicates p < 0.01). (C) Quantitative reverse transcription PCR (qRT-PCR) of CEBPA mRNA levels (left) and GADD45A mRNA levels (right) in indicated cells after a 48-hour treatment with indicated JQ1 concentrations. The mRNA levels were normalized to the respective untreated controls for each cell line. Error bars represent SEM of 3 independent experiments (* indicates p < 0.05, # indicates p < 0.01).
Discussion
Given the newfound tumor-suppressive function of GM signaling on RE leukemogenesis4, reduction in GM signaling due to haploinsufficiency of CSF2RA from LOS may cooperate in the leukemic transformation of RE cells. Furthermore, RE negatively regulates GM expression42. Therefore, haploinsufficiency of CSF2RA and RE-mediated repression of GM cooperate in allowing RE cells to escape the inhibitory effects of GM to promote RE leukemogenesis. By identifying mechanisms mediating the inhibitory effects of GM on RE leukemogenesis, and activating or restoring them directly in t(8;21) cells, there exists potential to uncover alternative therapeutic strategies that could be broadly applicable to t(8;21) AML. In this study, we discovered that attenuation of MYC-associated gene signatures is a crucial mechanism mediating the inhibitory effects of GM on RE leukemogenesis. Inhibition of MYC or reactivation of MYC-repressed target genes is therefore a promising therapeutic strategy for treating t(8;21) AML patients, including those who are hyporesponsive to GM.
GM signaling regulates various cellular processes including differentiation, proliferation, and survival of hematopoietic cells1. GM is used clinically to enhance white blood cell production and facilitate recovery from chemotherapy-induced myelosuppression43, 44. Additionally, it has been investigated for efficacy in inducing proliferation and sensitizing leukemia blasts to chemotherapy, although these studies yielded inconclusive results45, 46. Additionally, GM has been implicated in promoting leukemia progression, such as in JMML47. Altogether, these findings suggest that administration of GM to t(8;21) patients could result in the undesired cellular consequence of increased leukemia cell proliferation. In fact, when the t(8;21) cell line SKNO-1 was initially established, it was dependent on cytokines such as GM, G-CSF, and IL-3 for growth33. Although GM enhanced the proliferation of primary human RE HSPCs, this was paralleled with a reduction in the percentage of CD34+ RE cells and of RE LTC-IC frequencies. Additionally, GM aided RE cells in overcoming the RE-induced early myeloid differentiation block and promoted their differentiation. These findings indicate the effects of GM are diverse and highly dependent on cellular context. Additionally, we have identified GM-induced mechanisms that reduce the leukemic potential of RE HSPCs, without the GM-associated mitogenic effects, which is preferential for therapeutic intervention of t(8;21) AML. Although in this report we focused on inhibition of MYC, GM treatment of RE HSPCs resulted in moderate, but concerted, upregulation of various additional genes which are likely to possess tumor suppressive functions and warrant further investigation.
Our finding that myeloid differentiation and attenuated MYC-associated gene signatures were observed only in GM-treated RE HSPCs, and not in control HSPCs, provides novel mechanistic insight into the importance of GM signaling as a preventative mechanism against RE leukemogenesis. Additionally, it confirms previous reports that RE expression sensitizes cells to GM, which has been attributed to RE-induced repression of NF1 (Neurofibromin 1), a negative regulator of RAS4, 48. Gene expression profiling also revealed that RE expression induced a 2.5-fold increase in CSF2RB, which may contribute to the enhanced GM response. These findings stress the requirement for CSF2RA downregulation in RE cells as a method to reduce GM signaling and evade its negative effects during the leukemic transformation process.
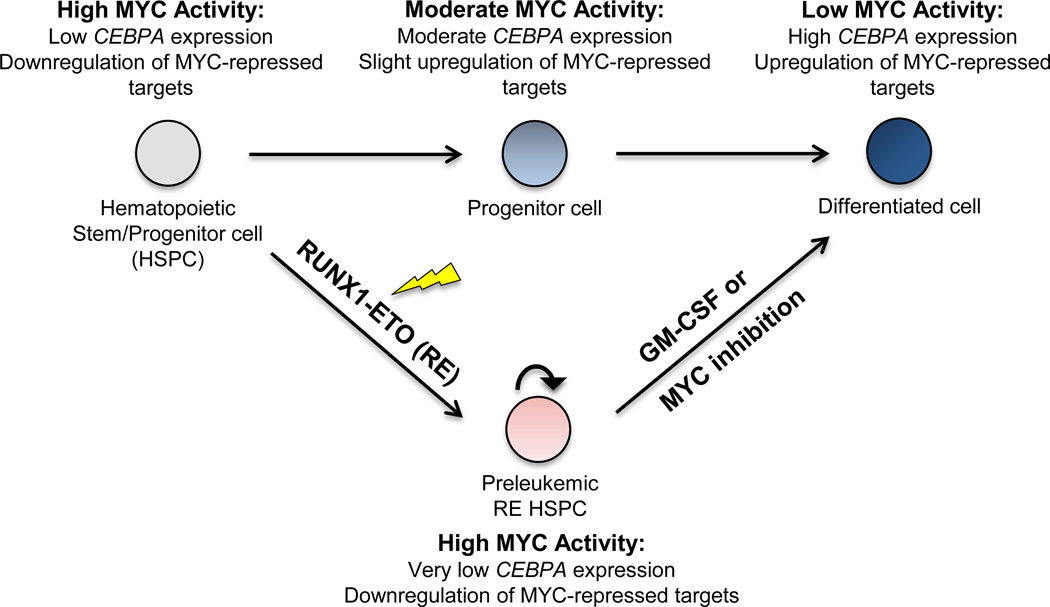
The proto-oncogene MYC encodes a transcription factor whose expression is tightly regulated during hematopoiesis. Its expression is highest in hematopoietic stem cells (HSCs) where it functions to maintain self-renewal capacity49, and decreases during myeloid differentiation50. MYC is frequently mutated or dysregulated in cancers, including leukemias, resulting in upregulated MYC expression and activity49, 51. RE expression has been reported to activate MYC and results in increased cell proliferation, self-renewal, and survival52, 53. Downregulation of MYC to alleviate its repression on key target genes, such as CEBPA and GADD45A, is critical for initiating hematopoietic differentiation and apoptosis, respectively28, 54. Our findings reveal the importance of GM signaling in RE cells to counteract MYC-associated gene signatures, and activate the expression of critical MYC-repressed tumor suppressor genes and other differentiation-related genes to reduce leukemic potential (Figure 8).
Figure 8. Proposed mechanism of the inhibitory effects of GM on the leukemic potential of RE HSPCs.
Hematopoietic stem/progenitor cells (HSPCs) rely on high levels of MYC to maintain self-renewal potential and prevent differentiation. MYC represses the expression of critical target genes that function as positive regulators of differentiation, such as the transcription factor CEBPA. The transition from HSPCs to differentiated cells requires repression of MYC and MYC activity. Reduced MYC activity allow upregulation of MYC-repressed target genes, such as CEBPA, which aid in enforcing terminal differentiation. In RE HSPCs, RE expression upregulates MYC and enhances self-renewal potential. Increased MYC levels in RE HSPCs also results in the downregulation of MYC-repressed targets, such as CEBPA and other positive regulators of differentiation. Additionally, RE has also been reported to repress CEBPA expression, which further contributes to the myeloid differentiation block. However, upon GM treatment of RE HSPCs, upregulation of MYC-repressed targets is observed. Although GM does not affect MYC levels directly, it restores the expression of MYC-repressed targets which aid RE HSPCs in overcoming their differentiation block and undergo myelopoiesis. MYC inhibition also elicits similar effects. Altogether, both GM and MYC inhibition promote upregulation of MYC-repressed target genes, which results in the differentiation of RE HSPC to ultimately reduce leukemic potential.
Importantly, the t(8;21) Kasumi-1 cell line, which is chemoresistant and hyporesponsive to GM, was highly sensitive to MYC inhibition. This indicates that although GM-responsiveness has been compromised in these cells, they remain sensitive to the downstream mechanisms responsible for mediating the negative effects of GM. Additionally, the chemoresistant t(8;21) SKNO-1 cell line was also sensitive to MYC inhibition, although to a lesser extent compared to Kasumi-1 cells. We hypothesize that these differences are due to the fact that the SKNO-1 cell line was initially established as a GM-dependent cell line and are therefore more resistant to the negative effects of GM, as well as the downstream mechanisms mediating its effects. These findings reinforce that MYC inhibition is effective in reducing the leukemic potential of t(8;21) cells, regardless of their degree of sensitivity to GM, which is especially pertinent to patients also exhibiting LOS.
GM has recently risen to the forefront in immunotherapy due to its effectiveness in promoting dendritic cell (DC) differentiation and activating immune cells55, 56. It is also being investigated clinically as an adjuvant in numerous cancer vaccines57. These current applications of GM are of relevance to t(8;21) AML patients because their leukemic blasts are generally hyporesponsive to GM due to reduced CSF2RA expression18, 58. Although LOS and t(8;21) are frequently observed together, it is unclear whether they are sufficient for leukemogenesis. Therefore, cells harboring both t(8;21) and LOS may remain dormant in these patients for extended periods of time. It has been reported that peripheral blood AML cells differentiate into DCs in the presence of cytokine cocktails, which include GM, and activate T cells to have cytotoxic activity against AML blasts59. Thus, t(8;21) cells with LOS, which secrete less GM due to the RE-induced repression of GM and are hyporesponsive to GM due to LOS, would have impaired differentiation into myeloid DCs. Consequently, their ability to activate T cells and participate in cancer immunosurveillance would also be compromised59, 60. This may further contribute to leukemia development if these t(8;21) cells evade immunosurveillance and remain in the bone marrow until additional mutations accumulate for disease initiation. Altogether, this implies a greater immunological role for GM signaling in preventing RE leukemia development that should be explored further.
In summary, here we elucidate a novel mechanism for the negative effects of GM on t(8;21) cells. Our findings indicate that attenuation or inhibition of MYC, either from GM treatment or shRNA-mediated MYC knockdown, restores the expression of MYC-repressed genes that are critical in promoting differentiation and apoptosis in t(8;21) cells to reduce leukemic potential. Additionally, we provide further experimental support for MYC inhibition as an effective therapeutic strategy for t(8;21) AML patients, which should be investigated clinically.
Supplementary Material
Acknowledgments
This work was supported by funding from the National Institutes of Health (NIH R01CA192924).
We would like to thank the UC San Diego IGM Genomic Center for performing the microarray, as well as Dr. Donna Neuberg and Dr. Kristen Stevenson (Dana-Farber Cancer Institute) for advising with microarray data analysis. For flow cytometry expertise, we thank Dennis J. Young of the UC San Diego Moores Cancer Center’s Flow Cytometry Shared Resource. Additionally, we would like to thank Dr. Olivier Harismendy (UC San Diego) and Dr. Kristin Jepsen (UC San Diego IGM Genomic Center) for their assistance with the barcode sequencing and data analysis. SW has received two years of fellowship support from the National Cancer Institute (NCI 5T32CA67754-17). Finally, we are very grateful to everyone in the Zhang Lab for helpful discussions.
Footnotes
Conflict-of-interest disclosure: The authors declare no conflict of interest.
References
- 1.de Groot RP, Coffer PJ, Koenderman L. Regulation of proliferation, differentiation and survival by the IL-3/IL-5/GM-CSF receptor family. Cellular Signalling. 1998;10(9):619–628. doi: 10.1016/s0898-6568(98)00023-0. [DOI] [PubMed] [Google Scholar]
- 2.Young DC, Griffin JD. Autocrine secretion of GM-CSF in acute myeloblastic leukemia. Blood. 1986 Nov;68(5):1178–1181. [PubMed] [Google Scholar]
- 3.Lanza F, Castagnari B, Rigolin G, Moretti S, Latorraca A, Ferrari L, et al. Flow cytometry measurement of GM-CSF receptors in acute leukemic blasts, and normal hemopoietic cells. Leukemia: Official Journal of the Leukemia Society of America, Leukemia Research Fund, UK. 1997;11(10):1700–1710. doi: 10.1038/sj.leu.2400794. [DOI] [PubMed] [Google Scholar]
- 4.Matsuura S, Yan M, Lo MC, Ahn EY, Weng S, Dangoor D, et al. Negative effects of GM-CSF signaling in a murine model of t(8;21)-induced leukemia. Blood. 2012 Mar 29;119(13):3155–3163. doi: 10.1182/blood-2011-04-350694. [DOI] [PMC free article] [PubMed] [Google Scholar]
- 5.Peterson LF, Boyapati A, Ahn E-Y, Biggs JR, Okumura AJ, Lo M-C, et al. Acute myeloid leukemia with the 8q22;21q22 translocation: secondary mutational events and alternative t(8;21) transcripts. Blood. 2007;110(3):799–805. doi: 10.1182/blood-2006-11-019265. [DOI] [PMC free article] [PubMed] [Google Scholar]
- 6.Erickson P, Gao J, Chang KS, Look T, Whisenant E, Raimondi S, et al. Identification of breakpoints in t(8;21) acute myelogenous leukemia and isolation of a fusion transcript, AML1/ETO, with similarity to Drosophila segmentation gene, runt. Blood. 1992 Oct 1;80(7):1825–1831. [PubMed] [Google Scholar]
- 7.Nishii K, Usui E, Katayama N, Lorenzo F, Nakase K, Kobayashi T, et al. Characteristics of t(8;21) acute myeloid leukemia (AML) with additional chromosomal abnormality: concomitant trisomy 4 may constitute a distinctive subtype of t(8;21) AML. Leukemia. 2003 Apr;17(4):731–737. doi: 10.1038/sj.leu.2402871. [DOI] [PubMed] [Google Scholar]
- 8.Byrd JC, Mrózek K, Dodge RK, Carroll AJ, Edwards CG, Arthur DC, et al. Pretreatment cytogenetic abnormalities are predictive of induction success, cumulative incidence of relapse, and overall survival in adult patients with de novo acute myeloid leukemia: results from Cancer and Leukemia Group B (CALGB 8461) Blood. 2002 Dec;100(13):4325–4336. doi: 10.1182/blood-2002-03-0772. [DOI] [PubMed] [Google Scholar]
- 9.Roboz GJ. Current treatment of acute myeloid leukemia. Curr Opin Oncol. 2012 Nov;24(6):711–719. doi: 10.1097/CCO.0b013e328358f62d. [DOI] [PubMed] [Google Scholar]
- 10.Lam K, Zhang DE. RUNX1 and RUNX1-ETO: roles in hematopoiesis and leukemogenesis. Front Biosci (Landmark Ed) 2012;17:1120–1139. doi: 10.2741/3977. [DOI] [PMC free article] [PubMed] [Google Scholar]
- 11.Yuan Y, Zhou L, Miyamoto T, Iwasaki H, Harakawa N, Hetherington CJ, et al. AML1-ETO expression is directly involved in the development of acute myeloid leukemia in the presence of additional mutations. Proc Natl Acad Sci U S A. 2001 Aug 28;98(18):10398–10403. doi: 10.1073/pnas.171321298. [DOI] [PMC free article] [PubMed] [Google Scholar]
- 12.Higuchi M, O'Brien D, Kumaravelu P, Lenny N, Yeoh EJ, Downing JR. Expression of a conditional AML1-ETO oncogene bypasses embryonic lethality and establishes a murine model of human t(8;21) acute myeloid leukemia. Cancer Cell. 2002 Feb;1(1):63–74. doi: 10.1016/s1535-6108(02)00016-8. [DOI] [PubMed] [Google Scholar]
- 13.Okuda T, Cai Z, Yang S, Lenny N, Lyu CJ, van Deursen JM, et al. Expression of a knocked-in AML1-ETO leukemia gene inhibits the establishment of normal definitive hematopoiesis and directly generates dysplastic hematopoietic progenitors. Blood. 1998 May 1;91(9):3134–3143. [PubMed] [Google Scholar]
- 14.Mulloy JC, Cammenga J, MacKenzie KL, Berguido FJ, Moore MA, Nimer SD. The AML1-ETO fusion protein promotes the expansion of human hematopoietic stem cells. Blood. 2002 Jan;99(1):15–23. doi: 10.1182/blood.v99.1.15. [DOI] [PubMed] [Google Scholar]
- 15.Appelbaum FR, Kopecky KJ, Tallman MS, Slovak ML, Gundacker HM, Kim HT, et al. The clinical spectrum of adult acute myeloid leukaemia associated with core binding factor translocations. Br J Haematol. 2006 Oct;135(2):165–173. doi: 10.1111/j.1365-2141.2006.06276.x. [DOI] [PubMed] [Google Scholar]
- 16.Valk PJM, Verhaak RGW, Beijen MA, Erpelinck CAJ, Barjesteh van Waalwijk van Doorn-Khosrovani S, Boer JM, et al. Prognostically useful gene-expression profiles in acute myeloid leukemia. The New England Journal of Medicine. 2004;350(16):1617–1628. doi: 10.1056/NEJMoa040465. [DOI] [PubMed] [Google Scholar]
- 17.Wouters BJ, Löwenberg B, Erpelinck-Verschueren CA, van Putten WL, Valk PJ, Delwel R. Double CEBPA mutations, but not single CEBPA mutations, define a subgroup of acute myeloid leukemia with a distinctive gene expression profile that is uniquely associated with a favorable outcome. Blood. 2009 Mar;113(13):3088–3091. doi: 10.1182/blood-2008-09-179895. [DOI] [PMC free article] [PubMed] [Google Scholar]
- 18.Kita K, Shirakawa S, Kamada N. Cellular characteristics of acute myeloblastic leukemia associated with t(8;21)(q22;q22). The Japanese Cooperative Group of Leukemia/Lymphoma. Leuk Lymphoma. 1994 Apr;13(3–4):229–234. doi: 10.3109/10428199409056286. [DOI] [PubMed] [Google Scholar]
- 19.Jahns-Streubel G, Braess J, Schoch C, Fonatsch C, Haase D, Binder C, et al. Cytogenetic subgroups in acute myeloid leukemia differ in proliferative activity and response to GM-CSF. Leukemia: Official Journal of the Leukemia Society of America, Leukemia Research Fund, UK. 2001;15(3):377–384. doi: 10.1038/sj.leu.2402029. [DOI] [PubMed] [Google Scholar]
- 20.Zervos AS, Gyuris J, Brent R. Mxi1, a protein that specifically interacts with Max to bind Myc-Max recognition sites. Cell. 1994 Oct;79(2) following 388. [PubMed] [Google Scholar]
- 21.Liu Y, Chen W, Gaudet J, Cheney MD, Roudaia L, Cierpicki T, et al. Structural basis for recognition of SMRT/N-CoR by the MYND domain and its contribution to AML1/ETO's activity. Cancer Cell. 2007;11(6):483–497. doi: 10.1016/j.ccr.2007.04.010. [DOI] [PMC free article] [PubMed] [Google Scholar]
- 22.Brown AL, Peters M, D'Andrea RJ, Gonda TJ. Constitutive mutants of the GM-CSF receptor reveal multiple pathways leading to myeloid cell survival, proliferation, and granulocyte-macrophage differentiation. Blood. 2004 Jan 15;103(2):507–516. doi: 10.1182/blood-2003-05-1435. [DOI] [PubMed] [Google Scholar]
- 23.Ferrari F, Bortoluzzi S, Coppe A, Basso D, Bicciato S, Zini R, et al. Genomic expression during human myelopoiesis. BMC Genomics. 2007;8:264. doi: 10.1186/1471-2164-8-264. [DOI] [PMC free article] [PubMed] [Google Scholar]
- 24.Mulloy JC, Cammenga J, Berguido FJ, Wu K, Zhou P, Comenzo RL, et al. Maintaining the self-renewal and differentiation potential of human CD34+ hematopoietic cells using a single genetic element. Blood. 2003 Dec;102(13):4369–4376. doi: 10.1182/blood-2003-05-1762. [DOI] [PubMed] [Google Scholar]
- 25.Gu L, Chiang KY, Zhu N, Findley HW, Zhou M. Contribution of STAT3 to the activation of survivin by GM-CSF in CD34+ cell lines. Exp Hematol. 2007 Jun;35(6):957–966. doi: 10.1016/j.exphem.2007.03.007. [DOI] [PubMed] [Google Scholar]
- 26.Sutherland HJ, Lansdorp PM, Henkelman DH, Eaves AC, Eaves CJ. Functional characterization of individual human hematopoietic stem cells cultured at limiting dilution on supportive marrow stromal layers. Proc Natl Acad Sci U S A. 1990 May;87(9):3584–3588. doi: 10.1073/pnas.87.9.3584. [DOI] [PMC free article] [PubMed] [Google Scholar]
- 27.Ragione FD, Iolascon A. Inactivation of cyclin-dependent kinase inhibitor genes and development of human acute leukemias. Leuk Lymphoma. 1997 Mar;25(1–2):23–35. doi: 10.3109/10428199709042493. [DOI] [PubMed] [Google Scholar]
- 28.Zeller KI, Jegga AG, Aronow BJ, O'Donnell KA, Dang CV. An integrated database of genes responsive to the Myc oncogenic transcription factor: identification of direct genomic targets. Genome Biol. 2003;4(10):R69. doi: 10.1186/gb-2003-4-10-r69. [DOI] [PMC free article] [PubMed] [Google Scholar]
- 29.Ellwood-Yen K, Graeber TG, Wongvipat J, Iruela-Arispe ML, Zhang J, Matusik R, et al. Myc-driven murine prostate cancer shares molecular features with human prostate tumors. Cancer Cell. 2003 Sep;4(3):223–238. doi: 10.1016/s1535-6108(03)00197-1. [DOI] [PubMed] [Google Scholar]
- 30.Gery S, Gombart AF, Yi WS, Koeffler C, Hofmann WK, Koeffler HP. Transcription profiling of C/EBP targets identifies Per2 as a gene implicated in myeloid leukemia. Blood. 2005 Oct;106(8):2827–2836. doi: 10.1182/blood-2005-01-0358. [DOI] [PMC free article] [PubMed] [Google Scholar]
- 31.Ma O, Hong S, Guo H, Ghiaur G, Friedman AD. Granulopoiesis requires increased C/EBPα compared to monopoiesis, correlated with elevated Cebpa in immature G-CSF receptor versus M-CSF receptor expressing cells. PLoS One. 2014;9(4):e95784. doi: 10.1371/journal.pone.0095784. [DOI] [PMC free article] [PubMed] [Google Scholar]
- 32.Asou H, Tashiro S, Hamamoto K, Otsuji A, Kita K, Kamada N. Establishment of a human acute myeloid leukemia cell line (Kasumi-1) with 8; 21 chromosome translocation. Blood. 1991;77(9):2031–2031. [PubMed] [Google Scholar]
- 33.Matozaki S, Nakagawa T, Kawaguchi R, Aozaki R, Tsutsumi M, Murayama T, et al. Establishment of a myeloid leukaemic cell line (SKNO-1) from a patient with t(8;21) who acquired monosomy 17 during disease progression. Br J Haematol. 1995 Apr;89(4):805–811. doi: 10.1111/j.1365-2141.1995.tb08418.x. [DOI] [PubMed] [Google Scholar]
- 34.Brown MA, Harrison-Smith M, DeLuca E, Begley CG, Gough NM. No evidence for GM-CSF receptor alpha chain gene mutation in AML-M2 leukemias which have lost a sex chromosome. Leukemia. 1994 Oct;8(10):1774–1779. [PubMed] [Google Scholar]
- 35.Pabst T, Mueller BU, Harakawa N, Schoch C, Haferlach T, Behre G, et al. AML1-ETO downregulates the granulocytic differentiation factor C/EBPalpha in t(8;21) myeloid leukemia. Nat Med. 2001 Apr;7(4):444–451. doi: 10.1038/86515. [DOI] [PubMed] [Google Scholar]
- 36.Westendorf JJ, Yamamoto CM, Lenny N, Downing JR, Selsted ME, Hiebert SW. The t(8;21) fusion product, AML-1-ETO, associates with C/EBP-alpha, inhibits C/EBP-alpha-dependent transcription, and blocks granulocytic differentiation. Mol Cell Biol. 1998 Jan;18(1):322–333. doi: 10.1128/mcb.18.1.322. [DOI] [PMC free article] [PubMed] [Google Scholar]
- 37.Liebermann DA, Tront JS, Sha X, Mukherjee K, Mohamed-Hadley A, Hoffman B. Gadd45 stress sensors in malignancy and leukemia. Crit Rev Oncog. 2011;16(1–2):129–140. doi: 10.1615/critrevoncog.v16.i1-2.120. [DOI] [PMC free article] [PubMed] [Google Scholar]
- 38.Perugini M, Iarossi DG, Kok CH, Cummings N, Diakiw SM, Brown AL, et al. GADD45A methylation predicts poor overall survival in acute myeloid leukemia and is associated with IDH1/2 and DNMT3A mutations. Leukemia. 2013 Jul;27(7):1588–1592. doi: 10.1038/leu.2012.346. [DOI] [PubMed] [Google Scholar]
- 39.Mertz JA, Conery AR, Bryant BM, Sandy P, Balasubramanian S, Mele DA, et al. Targeting MYC dependence in cancer by inhibiting BET bromodomains. Proc Natl Acad Sci U S A. 2011 Oct;108(40):16669–16674. doi: 10.1073/pnas.1108190108. [DOI] [PMC free article] [PubMed] [Google Scholar]
- 40.Fowler T, Ghatak P, Price DH, Conaway R, Conaway J, Chiang CM, et al. Regulation of MYC expression and differential JQ1 sensitivity in cancer cells. PLoS One. 2014;9(1):e87003. doi: 10.1371/journal.pone.0087003. [DOI] [PMC free article] [PubMed] [Google Scholar]
- 41.Zuber J, Shi J, Wang E, Rappaport AR, Herrmann H, Sison EA, et al. RNAi screen identifies Brd4 as a therapeutic target in acute myeloid leukaemia. Nature. 2011 Oct;478(7370):524–528. doi: 10.1038/nature10334. [DOI] [PMC free article] [PubMed] [Google Scholar]
- 42.Frank R, Zhang J, Uchida H, Meyers S, Hiebert SW, Nimer SD. The AML1/ETO fusion protein blocks transactivation of the GM-CSF promoter by AML1B. Oncogene. 1995 Dec;11(12):2667–2674. [PubMed] [Google Scholar]
- 43.Peters WP, Rosner G, Ross M, Vredenburgh J, Meisenberg B, Gilbert C, et al. Comparative effects of granulocyte-macrophage colony-stimulating factor (GM-CSF) and granulocyte colony-stimulating factor (G-CSF) on priming peripheral blood progenitor cells for use with autologous bone marrow after high-dose chemotherapy. Blood. 1993 Apr;81(7):1709–1719. [PubMed] [Google Scholar]
- 44.Socinski MA, Cannistra SA, Elias A, Antman KH, Schnipper L, Griffin JD. Granulocyte-macrophage colony stimulating factor expands the circulating haemopoietic progenitor cell compartment in man. Lancet. 1988 May;1(8596):1194–1198. doi: 10.1016/s0140-6736(88)92012-0. [DOI] [PubMed] [Google Scholar]
- 45.Hast R, Hellström-Lindberg E, Ohm L, Björkholm M, Celsing F, Dahl IM, et al. No benefit from adding GM-CSF to induction chemotherapy in transforming myelodysplastic syndromes: better outcome in patients with less proliferative disease. Leukemia. 2003 Sep;17(9):1827–1833. doi: 10.1038/sj.leu.2403035. [DOI] [PubMed] [Google Scholar]
- 46.Ravandi F. Role of cytokines in the treatment of acute leukemias: a review. Leukemia. 2006 Apr;20(4):563–571. doi: 10.1038/sj.leu.2404152. [DOI] [PubMed] [Google Scholar]
- 47.Gaipa G, Bugarin C, Longoni D, Cesana S, Molteni C, Faini A, et al. Aberrant GM-CSF signal transduction pathway in juvenile myelomonocytic leukemia assayed by flow cytometric intracellular STAT5 phosphorylation measurement. Leukemia. 2009 Apr;23(4):791–793. doi: 10.1038/leu.2008.265. [DOI] [PubMed] [Google Scholar]
- 48.Yang G, Khalaf W, van de Locht L, Jansen JH, Gao M, Thompson MA, et al. Transcriptional repression of the Neurofibromatosis-1 tumor suppressor by the t(8;21) fusion protein. Mol Cell Biol. 2005 Jul;25(14):5869–5879. doi: 10.1128/MCB.25.14.5869-5879.2005. [DOI] [PMC free article] [PubMed] [Google Scholar]
- 49.Delgado MD, León J. Myc roles in hematopoiesis and leukemia. Genes Cancer. 2010 Jun;1(6):605–616. doi: 10.1177/1947601910377495. [DOI] [PMC free article] [PubMed] [Google Scholar]
- 50.Gowda SD, Koler RD, Bagby GC. Regulation of C-myc expression during growth and differentiation of normal and leukemic human myeloid progenitor cells. J Clin Invest. 1986 Jan;77(1):271–278. doi: 10.1172/JCI112287. [DOI] [PMC free article] [PubMed] [Google Scholar]
- 51.Dang CV. MYC on the path to cancer. Cell. 2012 Mar;149(1):22–35. doi: 10.1016/j.cell.2012.03.003. [DOI] [PMC free article] [PubMed] [Google Scholar]
- 52.Steffen B, Knop M, Bergholz U, Vakhrusheva O, Rode M, Köhler G, et al. AML1/ETO induces self-renewal in hematopoietic progenitor cells via the Groucho-related amino-terminal AES protein. Blood. 2011 Apr;117(16):4328–4337. doi: 10.1182/blood-2009-09-242545. [DOI] [PubMed] [Google Scholar]
- 53.Müller-Tidow C, Steffen B, Cauvet T, Tickenbrock L, Ji P, Diederichs S, et al. Translocation products in acute myeloid leukemia activate the Wnt signaling pathway in hematopoietic cells. Mol Cell Biol. 2004 Apr;24(7):2890–2904. doi: 10.1128/MCB.24.7.2890-2904.2004. [DOI] [PMC free article] [PubMed] [Google Scholar]
- 54.Dang CV. c-Myc target genes involved in cell growth, apoptosis, and metabolism. Mol Cell Biol. 1999 Jan;19(1):1–11. doi: 10.1128/mcb.19.1.1. [DOI] [PMC free article] [PubMed] [Google Scholar]
- 55.van de Laar L, Coffer PJ, Woltman AM. Regulation of dendritic cell development by GM-CSF: molecular control and implications for immune homeostasis and therapy. Blood. 2012 Apr;119(15):3383–3393. doi: 10.1182/blood-2011-11-370130. [DOI] [PubMed] [Google Scholar]
- 56.Waller EK. The role of sargramostim (rhGM-CSF) as immunotherapy. Oncologist. 2007;12(Suppl 2):22–26. doi: 10.1634/theoncologist.12-S2-22. [DOI] [PubMed] [Google Scholar]
- 57.Quezada SA, Peggs KS, Curran MA, Allison JP. CTLA4 blockade and GM-CSF combination immunotherapy alters the intratumor balance of effector and regulatory T cells. J Clin Invest. 2006 Jul;116(7):1935–1945. doi: 10.1172/JCI27745. [DOI] [PMC free article] [PubMed] [Google Scholar]
- 58.Touw I, Donath J, Pouwels K, van Buitenen C, Schipper P, Santini V, et al. Acute myeloid leukemias with chromosomal abnormalities involving the 21q22 region identified by their in vitro responsiveness to interleukin-5. Leukemia. 1991 Aug;5(8):687–692. [PubMed] [Google Scholar]
- 59.Woiciechowsky A, Regn S, Kolb HJ, Roskrow M. Leukemic dendritic cells generated in the presence of FLT3 ligand have the capacity to stimulate an autologous leukemia-specific cytotoxic T cell response from patients with acute myeloid leukemia. Leukemia. 2001 Feb;15(2):246–255. doi: 10.1038/sj.leu.2402013. [DOI] [PubMed] [Google Scholar]
- 60.Tarte K, Fiol G, Rossi JF, Klein B. Extensive characterization of dendritic cells generated in serum-free conditions: regulation of soluble antigen uptake, apoptotic tumor cell phagocytosis, chemotaxis and T cell activation during maturation in vitro. Leukemia. 2000 Dec;14(12):2182–2192. doi: 10.1038/sj.leu.2401925. [DOI] [PubMed] [Google Scholar]
Associated Data
This section collects any data citations, data availability statements, or supplementary materials included in this article.


