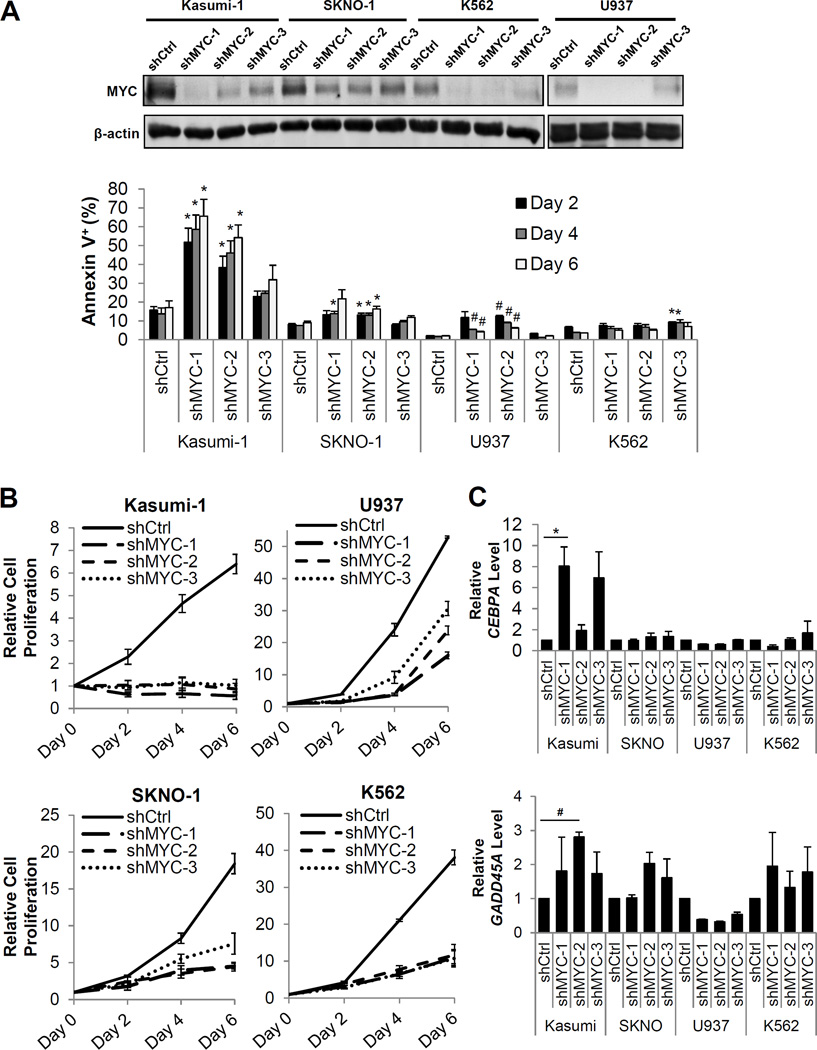
Figure 6. MYC knockdown reduces proliferation and induces apoptosis in t(8;21) human cells.
(A). Western blot analysis of MYC levels in cells expressing non-targeting control shRNAs or 3 unique shRNAs targeting MYC (top) and flow cytometric analysis of the percentage of Annexin V+ apoptotic cells upon MYC knockdown (bottom). Error bars represent SEM of 3 independent experiments (* indicates p < 0.05, #indicates p < 0.01). (B) Relative cell numbers of Kasumi-1 (top, left), SKNO-1 (bottom, left), U937 (top, right), and K562 (bottom, right) cells upon MYC knockdown. Error bars represent SEM of 3 independent experiments. (C) Quantitative reverse transcription PCR (qRT-PCR) of CEBPA mRNA levels (top) and GADD45A mRNA levels (bottom) upon MYC knockdown at Day 4. The mRNA levels were normalized to the respective controls for each cell line. Error bars represent SEM of 3 independent experiments (* indicates p < 0.05, #indicates p < 0.01).

