

Abstract
Protein microarray-based approaches are increasingly being used in research and clinical applications to either profile the expression of proteins or screen molecular interactions. The development of high-throughput, sensitive, convenient, and cost-effective formats for detecting proteins is a necessity for the effective advancement of understanding disease processes. In this paper, we describe the generation of highly multiplexed, antibody-based, specific, and sensitive protein microarrays coupled with rolling-circle signal amplification (RCA) technology. A total of 150 cytokines were simultaneously detected in an RCA sandwich immunoassay format. Greater than half of these proteins have detection sensitivities in the pg/mL range. The validation of antibody microarray with human serum indicated that RCA-based protein microarrays are a powerful tool for high-throughput analysis of protein expression and molecular diagnostics.
INTRODUCTION
Despite great advancements in genomics research, DNA microarrays are still of limited applicability as diagnostic tests, in part because proteins, not genes, are the ultimate effectors of a biological process. Proteins are often expressed at concentrations and varied structural forms having modifications that cannot be predicted from mRNA analysis. There is a great deal of interest in proteomics-based approaches that enable profiling the abundance of proteins, or investigation of protein-protein and protein-drug interactions. The concept of a protein microarray or biochip is attractive for rapid, high-throughput proteomics studies that utilize available sample volumes [1, 2, 3, 4]. Proteins that are present in abnormal concentrations (increased or decreased) in a disease state could be identified and validated as disease markers. Proteomics pattern analysis based on a multiplexed list of biomarkers may well make possible the diagnosis of certain diseases that do not have either effective screening options or biomarkers already detected by conventional immunoassays [5]. Identification of such disease markers will provide valuable information for detection, classification, and prognosis of diseases, as well as targets for treatment outcomes. High-throughput protein chips require arraying a wide range of probes that specifically recognize a single protein in complex mixtures such as serum, plasma, and other biological specimens. These probes are most frequently antibodies or antibody mimics [3, 4, 6, 7].
Given the immense promise of proteomics technologies, there are still limitations that need to be overcome, such as lack of sensitivity and enhanced information about the target. Because there is no PCR equivalent available to amplify proteins, the identification of low-abundance proteins may often be difficult or impossible, and important biomarker information could thus be lost. Rolling-circle amplification (RCA) is a unique signal amplification technology [8] that permits detection of multiple proteins with a broad dynamic range on protein microarrays [4, 9]. In this paper, we describe the development of RCA-based highly multiplexed and sensitive protein microarray immunoassays for detecting 150 proteins in an ELISA format. Application to human serum and plasma samples has established that the rolling-circle amplified protein microarray is a powerful tool for the profiling of expressed proteins in biological specimens.
MATERIAL AND METHODS
Preparation of microarrays. Glass slides were prepared and silanized according to procedures previously described [10]. Antibodies (R&D Systems, Minneapolis, Minn; Pharmingen, San Diego, Calif; BioSource International, Camarillo, Calif) were diluted to 0.5 mg/mL in PBS containing 0.05 mg/mL BSA, and 375 pL of each was spotted in quadruplicate onto the slides using a BioChip Arrayer (Packard BioSciences, Downers Grove, Ill). Each spot has a diameter of approximately 180 μm with a center-to-center spacing of 270 μm. Each slide was divided by a teflon mask into 16 subarrays, each with a diameter of 0.65 cm. Within each subarray, 256 spots were printed at known locations, containing 40 different features (antibodies for specific antigens) in quadruplicate (160 spots). The remaining features comprised of controls for antibody immobilization, Cy5-labeled mouse IgG and internal calibrators (biotin mouse IgG).
RCA microarray immunoassays. Slides were blocked by adding 30 μL blocking buffer (0.5% nonfat dry milk, 0.2% BSA, and 0.05% Tween-20 in PBS) to each subarray and incubating for 1 hour at 37°C in a humidified chamber, and then washed by immersion in PBS containing 0.5% Brij 35 for 2 minutes. A 15 μL aliquot of sample (single analyte or mixture of multiple analytes; serum, plasma, or culture supernatant) was immediately added to each subarray, incubated for 30 minutes at 37°C, and then washed as described above. After analytes were captured, a 20 μL aliquot of the appropriate mixture of biotinylated detection antibodies at 0.1 μg/mL each was applied to individual arrays and incubated at 37°C for 30 minutes in a humidified chamber. Slides were washed twice for two minutes in PBS containing 0.5% Brij 35. A mouse monoclonal antibiotin antibody-primer conjugate was prepared by derivatization of a mouse monoclonal antibiotin IgG (Jackson ImmunoResearch Laboratories, Inc, West Grove, Pa) with a 5'-terminal amine-modified oligonucleotide primer, 5'-Thiol-AAA AAA AAA AAA AAA CAC AGC TGA GGA TAG GAC AT-3', as previously described [9]. The conjugate was annealed with 75 nM circle 1 (cyclic 5'-CTC AGC TGT GTA ACA ACA TGA AGA TTG TAG GTC AGA ACT CAC CTG TTA GAA ACT GTG AAG ATC GCT TAT TAT GTC CTA TC-3') in PBS containing 0.05% Tween-20 and 1 mM EDTA at 37°C for 30 minutes. Twenty microliters of the conjugate-circle mixture was applied to each array. Slides were incubated at 37°C for 30 minutes and then washed twice. RCA reaction mixture (20 μL) containing native T7 DNA polymerase (20 U/mL), 1 mM dNTPs, ssDNA-binding protein 22 μg/mL, 1x sequenase buffer, 8% DMSO, and 0.05 mM Cy5 decorator (5'-Cy5-TGT CCT ATC CTC AGC TGG-Cy5) was added to each subarray. Slides were incubated at 37°C for 45 minutes, then washed twice in PBS containing 0.5% Brij 35 and once in PBS, and spin-dried. Arrays were analyzed on an Axon GenePix 4000B scanner (Axon Instruments Inc, Foster City, Calif), and fluorescence quantitated by using GenePix Pro 3.0 quantitation software. Data was analyzed by using MSI Analyzer software (Molecular Staging, Inc).
RESULTS AND DISCUSSION
Fabrication of antibody microarray
Microarrays were printed on cyanosilane-coated glass slides. This surface was chosen based on experiments indicating that cyanosilane-activated slides have the advantages of (1) simpler preparation, (2) less-expensive reagents, and (3) more uniformity of bound antibody spot morphology over thiolsilane-coated and cross-linker (such as GMBS) activated glass slides (data not shown). The concentration of capture antibody for printing was optimized by comparing specific signal intensities from the same capture antibody printed on the chip at different concentrations chosen for microarray printing. Specific signals at 0.5 mg/mL reached the point of saturation (data not shown), indicating that antibodies saturated the area available for immobilization in the spot. The uniformity of antibody immobilization on the chip was assessed by measuring the coefficient of variation (CV) from the quadruplicate spots using Cy5-labeled anti-isotype antibodies (against the species used in the capture antibodies), previously reported as approximately 10% for each feature on the chip[4].
Improving the sensitivity of protein detection on antibody array
Rolling circle amplification enables amplification of signals tethered to proteins and nucleic acids [4, 9, 11]. Immunoassays incorporating RCA have shown a large increase in sensitivity when compared with the direct assay [4]. The technique consists of protein capture by antibody immobilized on microarrays, detection by biotin-labeled second antibody specific for the captured protein, binding of a universal antibiotin antibody oligonucleotide conjugate pre-annealed with circle, and RCA signal amplification where a long single-strand DNA is generated by rolling-circle replication in the presence of DNA polymerase and nucleotides, with hybridization of the RCA product to fluorescent-labeled complementary oligonucleotide probes occurring simultaneously (Figure 1). Besides the signal amplification by RCA, the sensitivity of the antibody array was further improved by two approaches: (1) choosing optimal capture and detection antibody pairs for the microarray immunoassay and (2) optimizing assay procedures.
Figure 1.
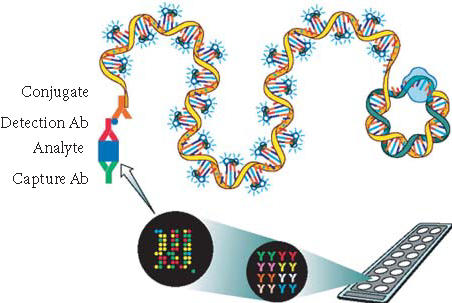
Schematic representation of microarray immunoassay with RCA signal amplification. It consists of (a) analyte capture by antibody immobilized on microarray, (b) detection by biotinylated secondary antibody, (c) binding of antibiotin antibody-oligonucleotide conjugate pre-annealed with circle 1, and (d) rolling-circle replication to generate long single-strand DNA which is hybridized with oligonucleotide decorator.
Antibody microarray development commenced with selection of optimal antibody pairs. For individual features, if the matched antibody pair developed for conventional ELISA was available, it was preferentially selected for the chip development. However, in terms of sensitivity and specificity, antibody pairs do not always function equivalently on plastic ELISA plates and the glass-based microarrays. Antibody pairs from different manufacturers for the same antigen with similar sensitivity as ELISA assays perform quite differently in microarrays. Thus it has become necessary to select optimal pairs for antibody microarrays by comparing all available antibodies and pairs. As an example, Figure 2a shows the difference between two matched pairs of antibodies (for ELISA) from different sources with specificity for detecting the cytokine IL-13 using the antibody microarray. The pair from source A showed strong signal intensity with a sensitivity of less than 100 pg/mL. However, the pair from source B did not show signal even at concentrations as high as 5 ng/mL IL-13. Selecting the antibody pair from source A provided at least 50-fold increase of sensitivity when compared with the pair from source B. Alternatively, the ELISA antibody pair from the same set is not always the optimal for a microarray immunoassay. One example shown in Figure 2b is for the chemokine MCP-2. Neither of the ELISA-matched pairs showed sensitivity better than 100 pg/mL on the microarray slides. However, using a capture antibody from A and a detection antibody from B, the sensitivity for MCP-2 was improved to 10 pg/mL or better, a 10-fold increase in sensitivity relative to a single manufacturer's reagents. For features without matched pairs, monoclonal antibodies with different binding epitopes or polyclonal antibodies were extensively evaluated for sensitivity ranges permitting detection of biologically relevant changes in protein expression. Cross-reactivity and nonspecific signals were also extensively evaluated as described below.
Figure 2.
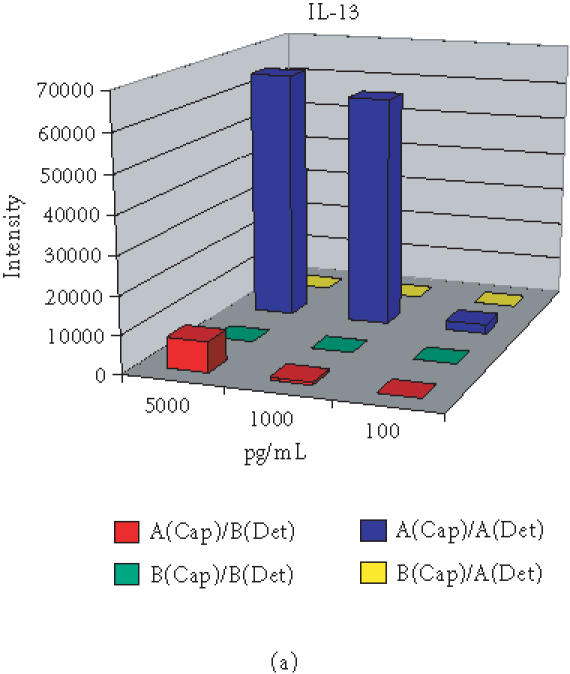
Optimization of antibodies from different sources (A and B) for choosing optimal pair for immunoassay on protein microarray with examples of (a) IL-13 and (b) MCP-2.
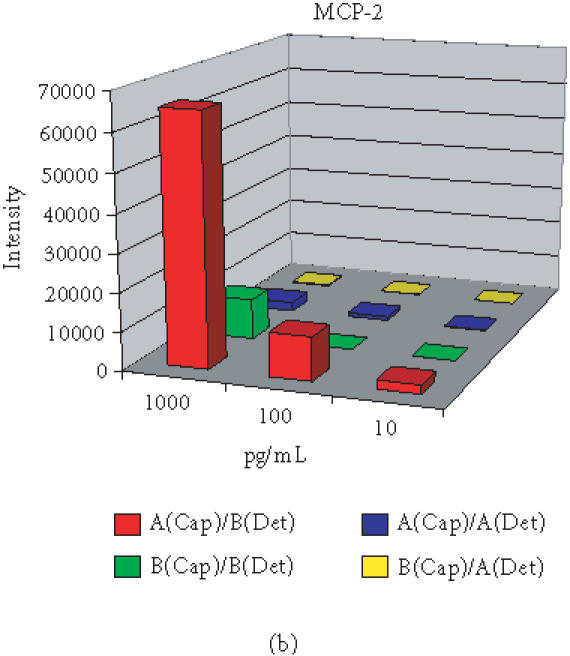
The second approach of improving sensitivity was to optimize the assay procedures. This involved optimizing detection antibody concentrations, conjugate and circle concentrations, incubation temperatures and time, and RCA reaction solution composition. Analogous to sandwich ELISA assays, the conditions giving the best signal to noise ratio were found to be 0.1 μg/mL of detector with assay incubation time of 30 minutes at 37°C. Titration of conjugate and circle pre-annealed to conjugate revealed the optimal concentration to be 2 μg/mL conjugate with 75 nM circle. Other components, such as the concentration of single-strand DNA binding protein (SSB), were also optimized for maximum sensitivity in RCA reaction mixtures (Figure 3).
Figure 3.
Titration of SSB in the RCA reaction mixtures. Cytokine IL-8 and Eot-2 at 100 pg/mL were detected.
The analytical sensitivity of the microarray immunoassay was determined by using serial dilutions of each single purified antigen. The sensitivity of detection, defined as the lowest concentration that delivered clear specific signal intensity above detection threshold (mean intensity of the negative control plus 2 SD), was calculated. Sixty-five (43%) of the 150 cytokine features had a sensitivity of ≤ 10 pg/mL, 52 (35%) had a sensitivity of ≤ 100 pg/mL, 27 (18%) had a sensitivity of ≤ 1000 pg/mL, and 6 (4%) had a sensitivity of ≥ 1,000 pg/mL (Table 1). Sixty-two of the cytokines represented on the chip are unique, with no corresponding commercially available ELISA kits. The sensitivity goal for these arrays was adequacy to detect biologically relevant (ie, 2-fold) increases in cytokine level above normal values in clinical fluids including serum and plasma.
Table 1.
Performance characteristics of the 150-feature protein microarray.
| Analyte | Biological ED50 (pg/mL) | Mean serum levels (pg/mL) | Array sensitivity (pg/mL) | ELISA sensitivity (pg/mL) |
| ALCAM | na | 52 000 | 100 | 24 |
| ANG | na | 360 000 | 10 | 6 |
| AR | 5000–15 000 | 45.4 | 100 | na |
| BDNF | 3000–10 000 | 27 793 | 10 | 20 |
| BLC | 5000–20 000 | na | 10 | na |
| SVE-cadherin | na | 2800 | 1000 | 313 |
| CCL28 | 400 000–2 000 000 | 43.8 | 30 | 2.58 |
| SCD23 | na | 1.3 IU/mL | 10 000 | 0.15 U/mL |
| CD27 | na | na | 100 | na |
| CD30 | 30 000–100 000 | 6.4 U/mL | 10 | na |
| CD40 | na | 102.1 | 300 | 15.6 |
| CNTF | 50 000–150 000 | nd | 300 | 8 |
| CNTF Rα | 200 000–400 000 | na | 100 | na |
| CT-1 | 1000–4000 | 619.5 | 1000 | na |
| CTACK | 100 000–400 000 | 522 | 10 | 1.55 |
| CTLA-4 | 2 000 000–4 000 000 | nd | 1000 | 313 |
| DR6 | na | na | 10 | na |
| EGF | 100–400 | 336 | 10 | 0.7 |
| ENA-78 | 3000–15 000 | 1449 | 100 | 15 |
| Eot | 10 000–20 000 | 68.6 | 10 | 5 |
| Eot-2 | 10 000–50 000 | 249 | 10 | 1.83 |
| Eot-3 | 250 000–1 000 000 | 9.7 | 100 | 2 |
| Fas | 10 000–40 000 | 9406 | 100 | 20 |
| Fas ligand | 200 000–500 000 | nd | 100 | 100 |
| FGF acidic | 100 000–300 000 | na | 10 | na |
| FGF basic | 100 000–250 000 | nd | 100 | 3 |
| FGF-4 | 50–150 | 93.8 | 300 | 30 |
| FGF-6 | 100–300 | na | 100 | na |
| FGF-7 | 15 000–25 000 | < 31.2 | 10 | 15 |
| FGF-9 | 1000–2000 | na | 100 | na |
| Flt-3 L | 500–1000 | 93.9 | 10 | 7 |
| Follistatin | 100 000–400 000 | 2483 | 30 | 29 |
| G-CSF | 20–60 | 22 | 1000 | 20 |
| GCP-2 | na | 156 | 100 | 1.6 |
| GDNF | 1000–3000 | na | 10 | na |
| GM-CSF | 20–80 | 1.72 | 10 | 3 |
| Sgp130 | 3000–9000 | 306 000 | 100 | 80 |
| GRO-α | 1000–4000 | 93 | 10 | 10 |
| GRO-β | 3000–300 000 | na | 10 | na |
| GRO-γ | 10 000–100 000 | na | 10 | na |
| HB-EGF | 2000–5000 | na | 100 | na |
| HCC-1 | 200 000–8 000 000 | na | 30 | na |
| HCC4 | 150 000–750 000 | na | 100 | na |
| HGF | 20 000–40 000 | 721 | 100 | 40 |
| HVEM | 500 000–2 000 000 | na | 30 | na |
| ICAM-1 | na | 211 000 | 10 | 350 |
| ICAM-3 | na | 50 000 | 100 | 580 |
| IFN-α | 3.8×10⁸ U/mg | < 10 | 100 | 15.6 |
| IFN-γ | 800–1500 | < 15.6 | 10 | 8 |
| IFN-ω | na | nd | 100 | 9.375 |
| IGF-I | 1000–3000 | 105 000 | 100 | 26 |
| IGF-IR | na | na | 100 | na |
| IGF-II | 5000–10 000 | 29 300 | 1000 | na |
| IGFBP-1 | 1 000 000–4000 000 | 14 300 | 30 | na |
| IGFBP-2 | 30 000–90 000 | 434 200 | 100 | na |
| IGFBP-3 | 50 000–150 000 | 2 375 000 | 1000 | 50 |
| IGFBP-4 | 30 000–90 000 | na | 100 | na |
| I-309 | 3000–9000 | nd | 10 | 0.71 |
| IL-1α | 3.0–7.0 | < 3.9 | 10 | 1 |
| IL-1β | 13–20 | 0.536 | 10 | 1 |
| IL-1rα | 20 000–60 000 | 418 | 100 | 22 |
| IL-1 sRI | 500 000–1000 000 | na | 100 | na |
| IL-1 sRII | 1 000 000–5000 000 | 11 000 | 10 | 10 |
| IL-2 | 250–500 | 1.6 | 10 | 7 |
| IL-2 Rβ | 1 000 000–3000 000 | na | 300 | na |
| IL-2 sRa | 500 000–1 000 000 | 1346 | 10 | 10 |
| IL-2 Rγ | 3 000 000–6 000 000 | na | 30 | na |
| IL-3 | 100–400 | < 31.2 | 1000 | 7.4 |
| IL-4 | 50–200 | < 0.25 | 10 | 10 |
| IL-5 | 100–200 | < 7.8 | 10 | 3 |
| IL-5 Rα | 200 000–300 000 | na | 100 | na |
| IL-6 | 200–800 | 1.62 | 10 | 0.7 |
| IL-6 sR | 5000–15 000 | 31 000 | 10 | 7 |
| IL-7 | 200–500 | 2.82 | 10 | 0.1 |
| IL-8 | 100–500 | 13.2 | 1 | 10 |
| IL-9 | 500–1000 | na | 1000 | na |
| IL-10 | 500–1000 | 2 | 10 | 3.9 |
| IL-10 Rβ | na | na | 10 | na |
| IL-11 | 60–240 | < 31.2 | 100 | 8 |
| IL-12 (p40) | 50–200 | 77 | 10 | 15 |
| IL-12 (p70) | 50–200 | 1.93 | 10 | 0.5 |
| IL-13 | 3000–6000 | < 62.5 | 10 | 32 |
| IL-15 | 500–2000 | 2.14 | 100 | 2 |
| IL-16 | 2 000 000–10000 000 | 171 | 100 | 6.2 |
| IL-17 | 2000–6000 | < 31.2 | 10 | 15 |
| IL-18 | na | 126 | 100 | 12.5 |
| IL-21 | 10 000–40 000 | na | 300 | na |
| IP-10 | 20 000–60 000 | 89 | 10 | 1.7 |
| I-TAC | 1000–5000 | 177 | 10 | 13.9 |
| Leptin/OB | 400–2000 | 4760(M), 20676(F) | 3000 | 7.8 |
| LIF | 500 | na | 100 | 8 |
| SLIF-Rα | 3 000 000–6000 000 | 4300 | 300 | 156 |
| Lymphotactin | 50 000–200 000 | na | 100 | na |
| M-CSF | 500–1500 | 670 | 10 | 9 |
| M-CSF R | 4000–12 000 | na | 300 | na |
| MCP-1 | 5000–20 000 | 370 | 10 | 5 |
| MCP-2 | 30 000–120 000 | 200 | 10 | na |
| MCP-3 | 20 000–80 000 | < 15.6 | 10 | 2 |
| MCP-4 | 200 000–400 000 | na | 300 | na |
| MDC | 3000–9000 | 1089 | 10 | 62.5 |
| MIF | 50 000–100 000 | 1337 | 100 | na |
| MIG | 200 000–600 000 | 914 | 10 | na |
| MIP-1α | 2000–10 000 | < 46.9 | 10 | 10 |
| MIP-1β | 10 000–30 000 | 80 | 10 | 11 |
| MIP-1δ | 2000–4000 | na | 100 | na |
| MIP-3α | 500–2000 | 26.3 | 30 | 0.47 |
| MIP-3β | 100 000–300 000 | na | 10 | na |
| MMP-1 | na | 6490 | 300 | 52 |
| MMP-2 | na | 1 169 000 | 300 | na |
| MMP-7 | na | 2290 | 100 | 16 |
| MMP-9 | na | 436 000 | 300 | 156 |
| MMP-10 | na | 770 | 100 | 4.13 |
| MPIF | 200 000–500 000 | 536 | 100 | 3.3 |
| MSP | 10 000–30 000 | 4 nM | 100 | na |
| NAP-2 | 100 000–300 000 | na | 100 | na |
| β-NGF | 800–1500 | 265 | 10 | na |
| NT-3 | 10 000–30 000 | 13.4 | 100 | na |
| NT-4 | 5000–15 000 | na | 10 | na |
| OSM | 150–300 | < 15.6 | 10 | na |
| PARC | 500 000–2000 000 | na | 100 | na |
| PDGF-Rα | 5 000 000–10 000 000 | na | 3000 | na |
| PECAM-1 | na | 20 000 | 1000 | na |
| PF4 | 5 000 000–15 000 000 | 14 700 | 300 | na |
| PlGF | na | 18 | 10 | 7 |
| Prolactin | 30–100 | 9300 | 1000 | 7.6 mIU/L |
| RANK | 4000–10 000 | na | 300 | na |
| RANTES | 1000–5000 | 49 137 | 10 | 8 |
| SCF | 2 500–5000 | 984 | 10 | 9 |
| SCF R | 2 000 000–6000 000 | na | 100 | na |
| SDF-1α | 3000–9000 | 2000 | 10 000 | 18 |
| SDF-1β | 10 000–30 000 | na | 10 000 | na |
| L-Selectin | na | 954 000 | 10 | 300 |
| ST2 | na | 500 | 30 | na |
| TARC | 3000–9000 | 331 | 100 | 5 |
| TGF-α | 100–400 | 22 | 100 | na |
| TGF-β1 | 20–60 | 48 600 | 10 | 7 |
| TGF-β3 | 10.0–30.0 | 2400 | 10 | na |
| TIMP-1 | 8 nM | 190 000 | 30 | 80 |
| TIMP-2 | na | 106 000 | 10 | na |
| TNF-α | 20–50 | 1.25 | 3 | 4.4 |
| TNF-β | 20–50 | < 156 | 10 | 16 |
| TNF RI | 45 000–90 000 | 1198 | 10 | 3 |
| TNF-RII | 4000–16 000 | 1725 | 100 | 1 |
| TRAIL | 4000–12 000 | nd | 5000 | 120 |
| TRAIL R1 | 1000–3000 | na | 10 | na |
| TRAIL R4 | 30 000–60 000 | na | 100 | na |
| UPAR | 50 000–150 000 | 2370 | 100 | 33 |
| SVAP-1 | na | 125 900 | 100 | 300 |
| VEGF | 2000–6000 | 220 | 10 | 9 |
| VEGF-R2 | 4000–8000 | 9768 | 1000 | 4.6 |
Specificity of antibody microarray
Although antibodies are highly specific for their respective cognate proteins, it is possible that structurally related proteins might have similar epitopes. Cross-reactivity or nonspecific signals between immobilized capture antibodies and antigens or detection antibodies for 150 features were determined in three different ways. First, the cross-reactivity of individual antigens or detection antibodies was determined by analyzing a single antigen at 0 and 50 ng/mL with its corresponding paired detection antibody. Any signals on the 0 ng/mL array were categorized as cross-reactivity between the detection and capture antibodies. With 50 ng/mL analyte, signals should have only been observed at the specific locations. Other signals after background subtraction (the 0 ng/mL array) were assumed to be cross-reactivity from the analyte. Nonspecific signals were eliminated by segregating all features into multiple subarrays, thus the capture antibodies producing nonspecific signals were physically separated from those particular detection antibodies or antigens. This also allowed simultaneous detection of both components of a biological signaling system, such as a growth factor and its receptor.
Residual cross-reactivity and nonspecific signals were first minimized by optimization of washing and blocking conditions [4]. Next, a mixture of several analytes at concentrations of 10 ng/mL each was applied to the chip, followed by detection with the complete detection antibody cocktail. Signals were only observed where both the analyte and its specific detection antibody were present. Then a mixture of all analytes in the subarray at 10 ng/mL each was added to the microarray, but detection was with an incomplete cocktail of antibodies. Signals were only detected on those features corresponding to the specific detection antibodies added. As shown in Figure 4, both cross-reactivity between capture antibodies and analytes and cross-reactivity between capture antibodies and detection antibodies in each subarray were minimized. Approximately 99% of nonspecific binding pairs had fluorescence intensity units of less than 300, used as the background signal minimum during the data quantitation. Interferences from biological specimen were screened using normal human serum and single detectors (biotinylated detection antibody) corresponding to each feature on the chip. Only specific signals of the proteins present in the specimen were detected by their associated detector antibody. Other nonspecific signals or background signals were negligible.
Figure 4.
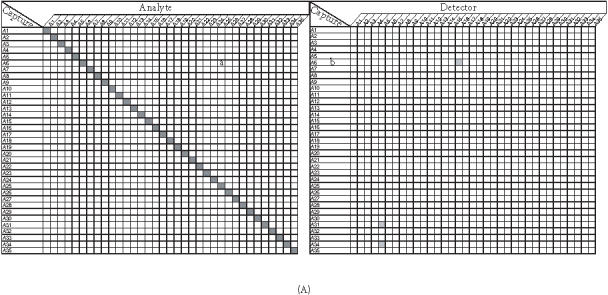
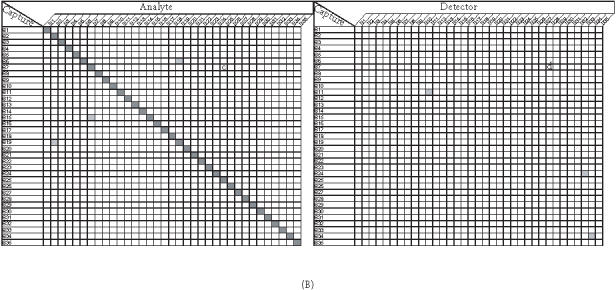
Cross-reactivity of capture antibodies and analytes ((a) and (c)), capture antibodies and detection antibodies ((b) and (d)) on the subarrays 3 (A) and 4 (B). Each subarray was printed with about 35 different capture antibodies (listed on the chart). Cross-reactivity was determined by using different matched secondary antibody and 50 ng/mL or 0 ng/mL of its cognate analyte, which has been described in the text. A shaded square off the diagonal indicates the presence of nonspecific signals (intensity ≥ 300). None of these nonspecific signals exceed the intensity of 600 fluorescence intensity units (images are scanned at PMT of 600 and power of 100% on Axon scanner).
Validation of the antibody microarray
The antibody microarray was validated by running assays with normal human serum (Sigma, St. Louis, Mo) on our 70-feature protein chip. We simultaneously detected 70 proteins in normal human serum. Signals corresponding to specific proteins were identified (Figure 5), which are consistent with their presence with significant level in the normal human serum (Table 1). Proteins with low fluorescence signal intensities agree with their very low level in serum (if present), indicating that our antibody microarray provides a specific, robust, and high-throughput approach for global analysis of protein expression.
Figure 5.
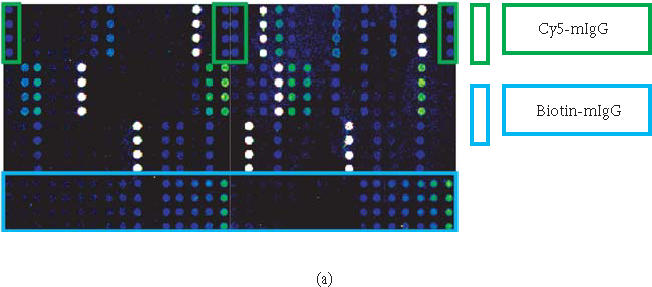
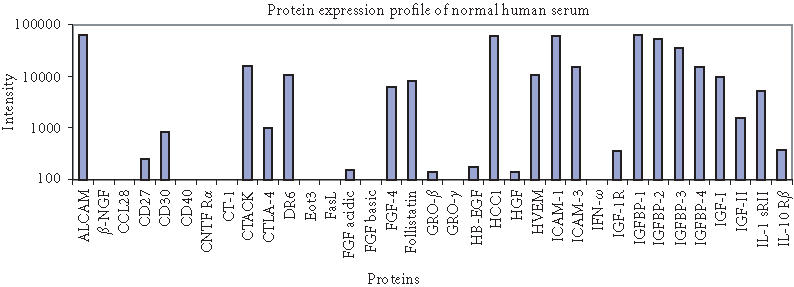
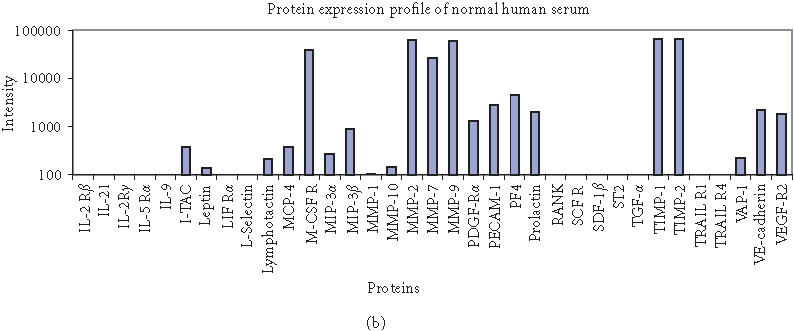
Protein expression profiling of normal human serum (Sigma) on 70-feature antibody microarray. Specific signals detected were consistent with the protein level in serum. (a) Images of detecting 70 proteins in antibody microarray obtained with Axon microarray scanner. (b) Fluorescence intensities were derived from microarray images with averaging four spots of the same feature.
CONCLUSION
Immunoassays on microarrays hold appeal for studies requiring the ability to quantify many selected proteins simultaneously. Considerable progress has been made in this area recently in terms of increased assay sensitivity and complexity (ie, degree of multiplexing). Rolling-circle amplification facilitates the use of such arrays with its powerful degree of signal enhancement and simultaneous detection of a large number of defined analytes. Such robust systems will enable routine use of antibody arrays in both research and diagnostic modalities.
References
- MacBeath G, Schreiber S L. Printing proteins as microarrays for high-throughput function determination. Science. 2000;289(5485):1760–1763. doi: 10.1126/science.289.5485.1760. [DOI] [PubMed] [Google Scholar]
- Zhu H, Bilgin M, Bangham R, et al. Global analysis of protein activities using proteome chips. Science. 2001;293(5537):2101–2105. doi: 10.1126/science.1062191. [DOI] [PubMed] [Google Scholar]
- Haab B B, Dunham M J, Brown P O. Protein microarrays for highly parallel detection and quantitation of specific proteins and antibodies in complex solutions. Genome Biol. 2001;2(2):1–13. doi: 10.1186/gb-2001-2-2-research0004. [DOI] [PMC free article] [PubMed] [Google Scholar]
- Schweitzer B, Roberts S, Grimwade B, et al. Multiplexed protein profiling on microarrays by rolling-circle amplification. Nat Biotechnol. 2002;20(4):359–365. doi: 10.1038/nbt0402-359. [DOI] [PMC free article] [PubMed] [Google Scholar]
- Petricoin E F. 3rd, Ardekani A M, Hitt B A, et al. Use of proteomic patterns in serum to identify ovarian cancer. Lancet. 2002;359(9306):572–577. doi: 10.1016/S0140-6736(02)07746-2. [DOI] [PubMed] [Google Scholar]
- Huang R P, Huang R, Fan Y, Lin Y. Simultaneous detection of multiple cytokines from conditioned media and patient's sera by an antibody-based protein array system. Anal Biochem. 2001;294(1):55–62. doi: 10.1006/abio.2001.5156. [DOI] [PubMed] [Google Scholar]
- Wiese R, Belosludtsev Y, Powdrill T, Thompson P, Hogan M. Simultaneous multianalyte ELISA performed on a microarray platform. Clin Chem. 2001;47(8):1451–1457. [PubMed] [Google Scholar]
- Lizardi P M, Huang X, Zhu Z, Bray-Ward P, Thomas D C, Ward D C. Mutation detection and single-molecule counting using isothermal rolling circle amplification. Nat Genet. 1998;19(3):225–232. doi: 10.1038/898. [DOI] [PubMed] [Google Scholar]
- Schweitzer B, Wiltshire S, Lambert J, et al. Immunoassays with rolling circle DNA amplification: a versatile platform for ultrasensitive antigen detection. Proc Natl Acad Sci USA. 2000;97(18):10113–10119. doi: 10.1073/pnas.170237197. [DOI] [PMC free article] [PubMed] [Google Scholar]
- Falipou S, Chovelon J M, Martelet C, Margonari J, Cathignol D. New use of cyanosilane coupling agent for direct binding of antibodies to silica supports. Physicochemical characterization of molecularly bioengineered layers. Bioconjug Chem. 1999;10(3):346–353. doi: 10.1021/bc9800421. [DOI] [PubMed] [Google Scholar]
- Nallur G, Luo C, Fang L, et al. Signal amplification by rolling circle amplification on DNA microarrays. Nucleic Acids Res. 2001;29(23):e118. doi: 10.1093/nar/29.23.e118. [DOI] [PMC free article] [PubMed] [Google Scholar]