

Abstract
Recent reports from our laboratory and others support the SELDI ProteinChip technology as a potential clinical diagnostic tool when combined with n-dimensional analyses algorithms. The objective of this study was to determine if the commercially available classification algorithm biomarker patterns software (BPS), which is based on a classification and regression tree (CART), would be effective in discriminating ovarian cancer from benign diseases and healthy controls. Serum protein mass spectrum profiles from 139 patients with either ovarian cancer, benign pelvic diseases, or healthy women were analyzed using the BPS software. A decision tree, using five protein peaks, resulted in an accuracy of 81.5% in the cross-validation analysis and 80% in a blinded set of samples in differentiating the ovarian cancer from the control groups. The potential, advantages, and drawbacks of the BPS system as a bioinformatic tool for the analysis of the SELDI high-dimensional proteomic data are discussed.
INTRODUCTION
Ovarian cancer has the highest fatality-to-case ratio of all gynecologic malignancies [1, 2]. This is attributed to the lack of early warning signs and efficacious early detection techniques [1, 3]. Another problem hindering the successful management of the disease is the paucity in prognosticators that could assist the selection of treatment modality. One of the most promising routes towards improvement in the detection and surveillance of ovarian cancer is the identification of serum markers. Utilization of the CA125 as an ovarian cancer serum marker has improved cancer detection rates during the last few years [1, 2, 3]. Nevertheless, CA125 does not diagnose early-stage cancers with high accuracy and is prone to false positives. Therefore, the need to identify additional serum markers for ovarian cancer is paramount to the successful management of this disease.
A major obstacle in finding a diagnostic biomarker is the tremendous molecular heterogeneity that exists for nearly all human cancer, suggesting that simultaneous screening of a patient specimen for multiple biomarkers will be required to improve the early detection/diagnosis of cancer. DNA chip technologies address this problem at the genomic level, and provide accessibility to gene expression profiles. However, since proteins are, for the most part, the mediators of a cell's function, the study of the changes in proteins that result from a pathological lesion, such as cancer, would appear to be a rich source of potential cancer biomarkers.
Most of the previous studies in search of diagnostic biomarkers have employed two-dimensional electrophoresis (2DE) which can resolve hundreds to thousands of proteins present in complex protein mixtures, such as cell lysates and body fluids. Although some successes have been reported in detecting potential ovarian cancer-associated biomarkers [4, 5, 6, 7], this classical proteomic technique is very time consuming, not highly reproducible, and not easily adaptable to a clinical assay format.
A recently developed mass spectrometry proteomic approach, the SELDI (surface-enhanced laser desorption/ionization) ProteinChip System (Ciphergen Biosystems, Inc, Fremont, Calif), appears to hold promise for biomarker discovery and as a potential clinical assay format [8, 9]. (The SELDI system and its applications are described in the report by Reddy and Dalmasso [10]; and a recent review by Wright [11]). Using this system, distinct protein patterns of normal, premalignant, and malignant cells were found for ovarian, esophageal, prostate, breast, and hepatic cancers [12, 13, 14]. Potential biomarkers for breast and bladder cancers were also detected in nipple aspirate fluid and urine, see respectively [15, 16], by the SELDI system.
Recent reports also support that analysis of the SELDI data by “artificial intelligence” algorithms can lead to the identification of protein “fingerprints” specific for prostate, ovarian, and breast cancers, significantly increasing the accuracy in differentiating cancer from the noncancer groups [17, 18, 19, 20]. These studies employed different algorithms to analyze the SELDI data, including a genetic algorithm [19], a decision tree [17, 18], and a support vector machine algorithm [20]. Each method appeared to be effective in developing accurate classification systems.
The high dimensionality of the data generated by SELDI requires a mathematical algorithm to analyze the data without overfitting. Since the SELDI protein profiling approach is new, it is difficult to determine up-front which algorithm to select for the data analysis and development of a “diagnostic” classifier. It is also fair to assume that different bioinformatic tools may be required for different cancer or disease systems. The objective of this study was to evaluate the commercially available classification algorithm (biomarker pattern software [BPS]) developed by Ciphergen Biosystems Inc for analysis of the SELDI serum protein profiling data from patients with ovarian cancer, benign pelvic diseases, and normal women. The potential, advantages, and drawbacks of this approach as well as suggestions for improvement are discussed.
METHODS
Serum samples
Serum samples were obtained from patients with epithelial ovarian cancer prior to treatment administration (n = 44), benign pelvic diseases (n = 61), and from women with no evidence of pelvic disease (n = 34) enrolled through the Division of Gynecologic Oncology, University of Texas, Southwestern Medical Center. Informed consent was obtained from all patient and control groups. The demographics of the patients and the stage distribution of the ovarian cancers are presented in Table 1. Benign conditions included benign pelvic masses (endometriosis, cystadenomas, hydrosalpinx, lipoma, Brenner tumor, fibroids, endometrial polyp). The sera were aliquoted and stored at −80°C.
Table 1.
Demographics of the cancer and control groups included in the study.
| n | Mean age | Age range | Cancer stage | n | |
| Cancer | 44 | 55.9 | 20–85 | Stage I | 10 |
| Normal | 34 | 43.7 | 28–59 | Stage II | 4 |
| Benign | 61 | 46.8 | 20–83 | Stage III | 21 |
| Stage IV | 9 | ||||
SELDI processing of serum samples
Serum samples were applied on the strong anion exchange (SAX) and immobilized-copper (IMAC) chip surfaces. In brief, 21 μL of serum were mixed with 30 μL 8M urea in 1% CHAPS-PBS pH 7.4 buffer for 30 minutes at 4°C, followed by the addition of 100 μL of 1M urea in 0.125% CHAPS-PBS buffer and 600 μL of binding buffer compatible with the type of surface in use (PBS for IMAC and 20 mM Hepes containing 0.1% Triton for SAX). Fifty μL of the diluted samples were then applied onto the chips using a bioprocessor. Following a 30-minute incubation, nonspecifically bound molecules were removed by 3 brief washes in binding buffer followed by 3 washes with HPLC-gradient H2O. Sinapinic acid (2X 1 μL of 50% SPA in 50% ACN-0.1%TFA) was applied to the chip array surface and mass spectrometry was performed using a PBS2 SELDI mass spectrometer (Ciphergen Biosystems Inc). Protein data were collected by averaging a total of 192 laser shots. Mass calibration was performed using the all-in-one peptide standard (Ciphergen Biosystems Inc) which contains vasopressin (1084.2 daltons), somatostatin (1637.9 daltons), bovine insulin β-chain (3495.9 daltons), human insulin recombinant (5807.6 daltons), and hirudin (7033.6 daltons). All samples were processed in duplicate.
Processing of SELDI data
Protein peaks were labeled and their intensities were normalized for total ion current (mass range 2–200 kd) to account for variation in ionization efficiencies, using the SELDI software (version 3.1). Peak clustering was performed using the Biomarker Wizard software (Ciphergen Biosystems) and the following specific settings: spectral data from IMAC surface; signal/noise (first pass): 4, minimum peak threshold: 10%, mass error: 0.3%, and signal/noise (second pass): 2 for the 2–20 kd mass range and signal/noise (first pass): 5, minimum peak threshold: 10%, mass error: 0.3%, and signal/noise (second pass): 2.5 for the 20–100 kd mass range. Spectral data from the SAX surface were analyzed with the same set of settings with the difference that the minimum peak threshold was set to 5%. With these labeling parameters, a total of 122 protein clusters (45 from the IMAC and 77 from the SAX surface) were generated. Peak mass and intensity were exported to an excel file, and the peak intensities from each duplicate spectra were averaged. Pattern recognition and sample classification were performed using the BPS. The decision tree described in the result section was generated using the Gini method nonlinear combinations. A 10-fold cross-validation analysis was performed as an initial evaluation of the test error of the algorithm. Briefly, this process involves splitting up the dataset into 10 random segments and using 9 of them for training and the 10th as a test set for the algorithm. Multiple trees were initially generated from the 122 classifiers by varying the splitting factor by increments of 0.1. These trees were evaluated by cross-validation analysis. The peaks that formed the main splitters of the tree with the highest prediction rates were then selected, the tree was rebuilt based on these peaks alone and evaluated by the test set. The values of P were calculated based on t-test (Biomarker Wizard software). The value P < .05 was considered to be statistically significant.
RESULTS
One hundred thirty-nine serum samples were assayed by SELDI mass spectrometry. Both SAX and IMAC surfaces could effectively resolve low-mass (< 20 kd) protein peaks, although the SAX surface appeared superior in resolving larger (> 20 kd) protein peaks. Figure 1 shows representative protein spectra from one serum sample processed on SAX and IMAC chips.
Figure 1.
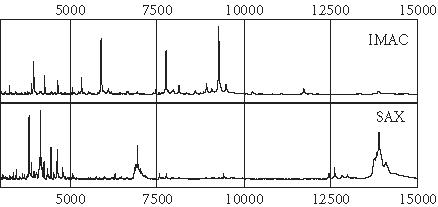
Protein spectra of one serum sample processed on the IMAC metal binding chip array and on the positively charged SAX chip array. Note that several different proteins are captured by the two different chip chemistries.
Of a total of 139 serum samples, 124 (85 controls and 39 cancers) were randomly selected to form the learning set and 15 (10 controls and 5 cancers) to form the blinded test set for the algorithm. Five peaks were selected by the BPS algorithm to discriminate cancer from the noncancer groups. Figure 2 is the decision tree that was generated from the learning set to classify the two groups. Three peaks (5.54, 6.65, and 11.7 kd) detected on the IMAC chip and 2 (4.4 and 21.5 kd) detected on the SAX surface form the main splitters. Their mass spectra and gray-scale/gel views are shown in Figures 3, 4, 5, 6, and 7. These peaks have significantly different intensity levels between the cancer and benign or normal controls with the exception of the 6.65 and 21.5 kd peaks, which did not differ significantly between cancers and benigns (Table 2). A 10-fold cross-validation analysis was performed as an initial evaluation of the accuracy of the algorithm in predicting ovarian cancer. A specificity of 80% and sensitivity of 84.6% were obtained (Table 3). In the test set, sensitivity and specificity of 80% were obtained (Table 3). The misclassified samples in the test set included one benign (uterine fibroid), one normal, and a stage III C cancer.
Figure 2.

Decision tree classification of the ovarian cancer (C) and noncancer (normal and benign or B) groups. The blue boxes show the decision nodes with the peak mass (M in kd), the peak intensity (I) cutoff levels, and the number of samples. The 5.54, 6.65, and 11.7 kd masses were detected on the IMAC chip, and the 4.4 and 21.5 kd on the SAX chip. These five masses form the splitting rules. Cases that follow the rule are placed in the left daughter node. The red boxes are the terminal nodes with the classification being either cancer or benign (normal + benign).
Figure 3.
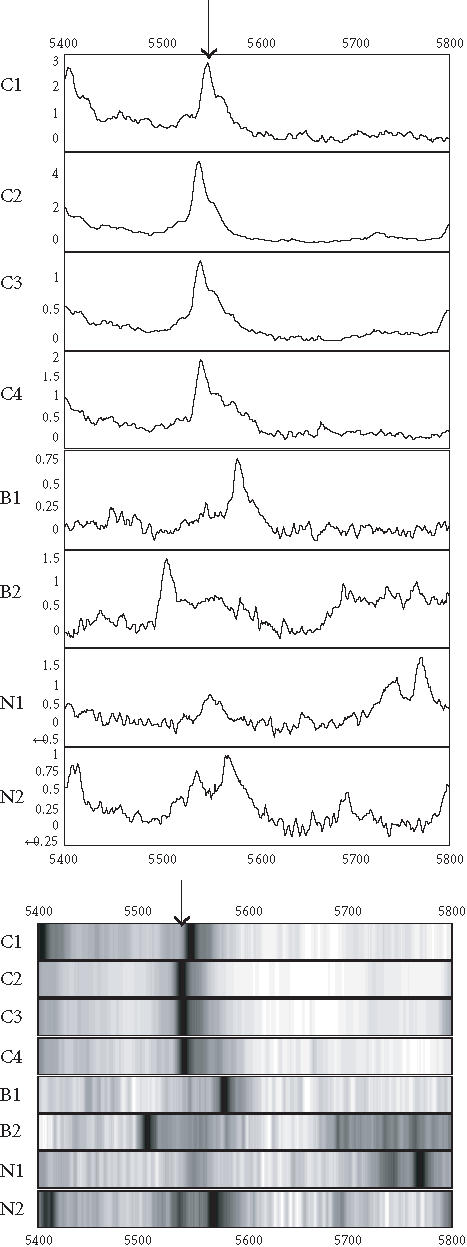
Spectra (top) and grey-scale or gel views (bottom) of the peaks (arrows) forming the splitting rules. The protein peak was detected on IMAC chip. The peak appears to be upregulated in the cancer (C1 C4) compared to the benign (B1-B2) and normal (N1-N2) groups.
Figure 4.
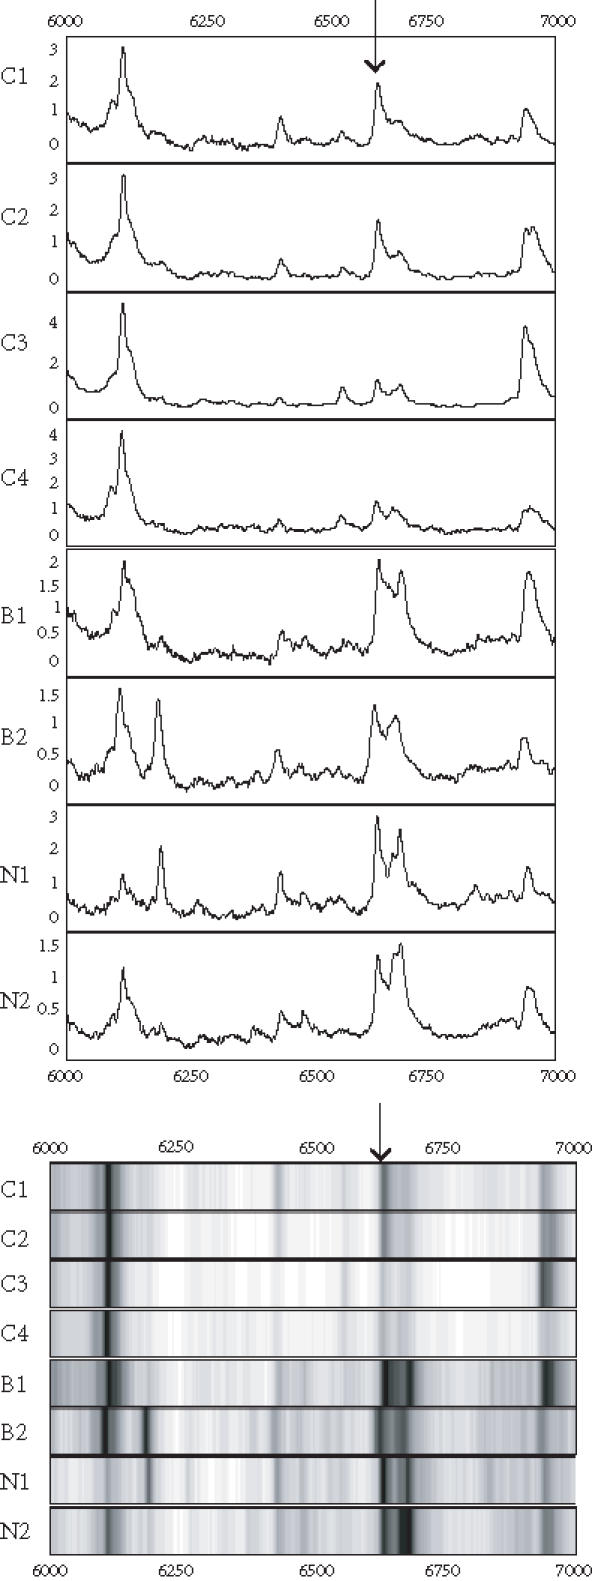
Spectra (top) and grey-scale or gel views (bottom) of the peaks (arrows) forming the splitting rules. The protein peak was detected on IMAC chip. The peak appears to be downregulated in the cancers.
Figure 5.
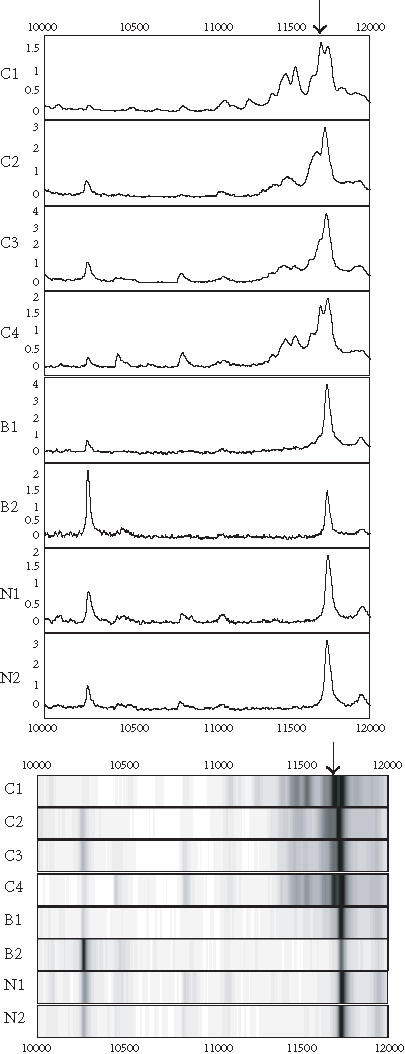
Spectra (top) and grey-scale or gel views (bottom) of the peaks (arrows) forming the splitting rules. The protein peak was detected on IMAC chip. The peak appears to be upregulated in cancer (C1–C4) compared to the benign (B1-B2) and normal (N1-N2) groups.
Figure 6.
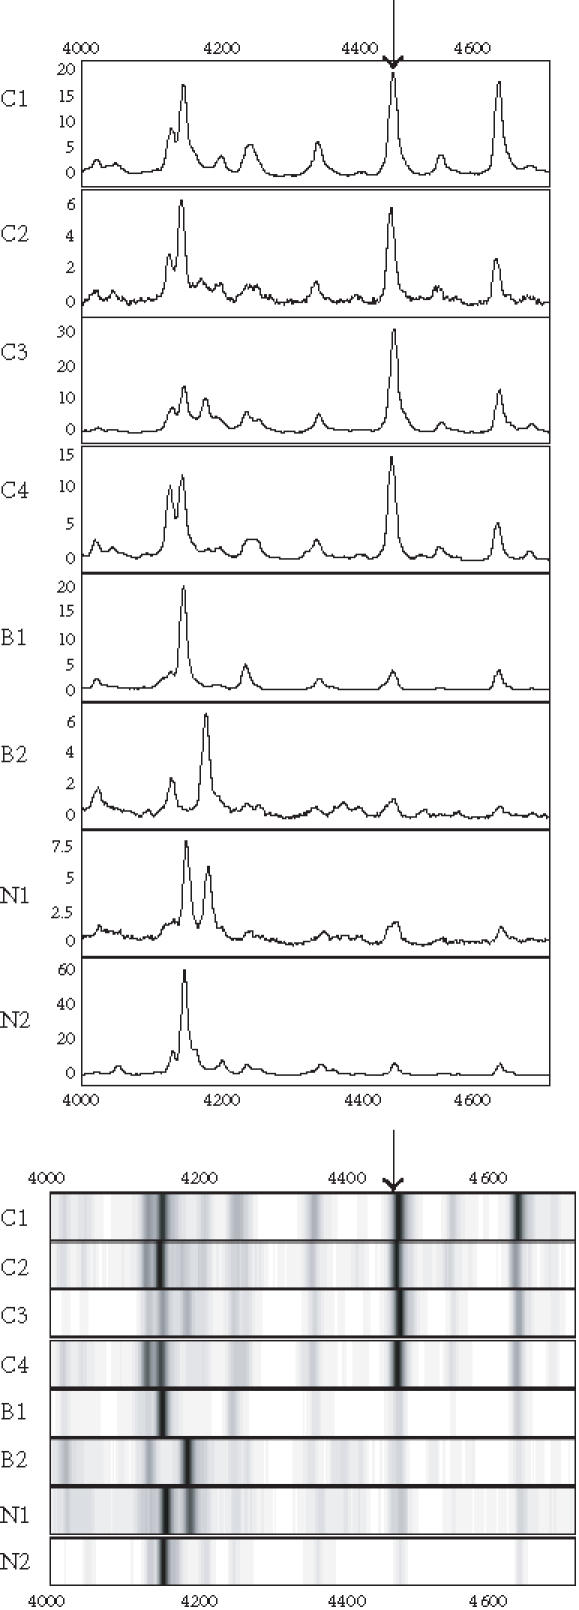
Spectra (top) and grey-scale or gel views (bottom) of the peaks (arrows) forming the splitting rules. The protein peak was detected on the SAX surface. The peak appears to be upregulated in the cancer (C1–C4) compared to the begin (B1-B2) and normal (N1-N2) groups.
Figure 7.
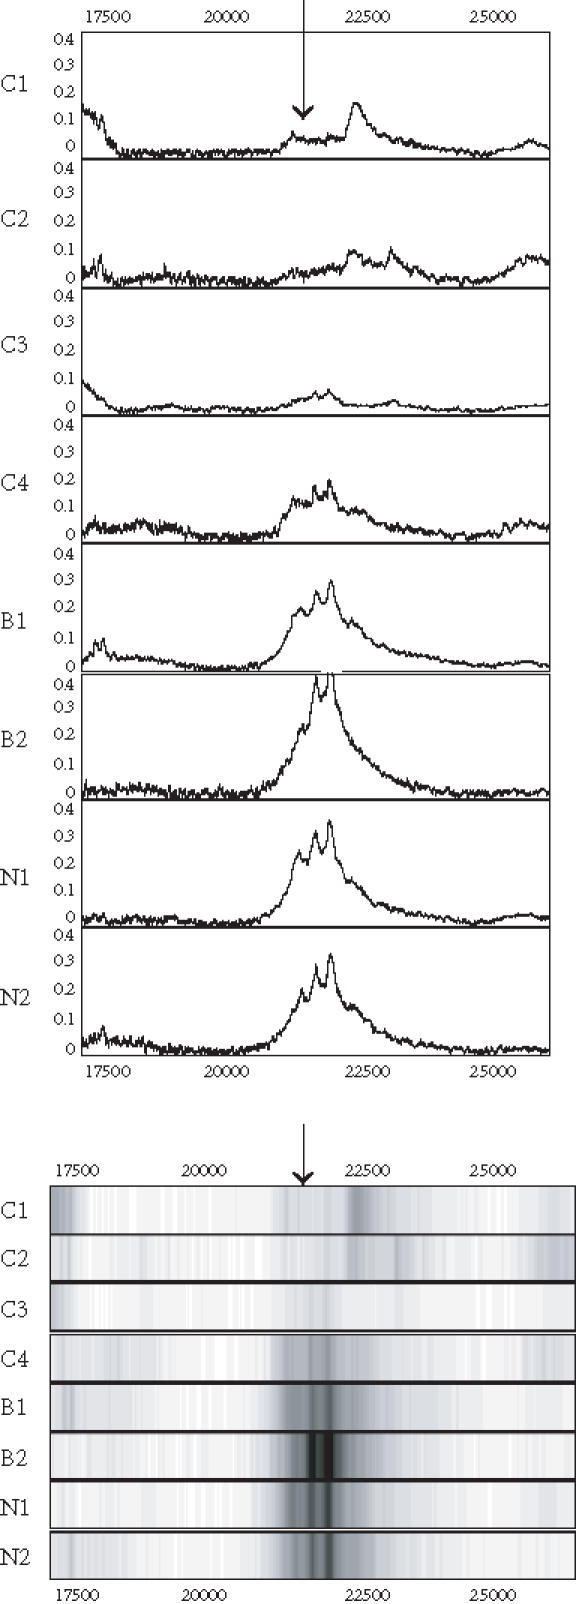
Spectra (top) and grey-scale or gel views (bottom) of the peaks (arrows) forming the splitting rules. The protein peak was detected on the SAX surface. The peak appears to be downregulated in the cancers.
Table 2.
Statistical comparison of the intensity levels of the peaks used in the decision tree between the cancer and control groups. C-N: cancer versus normal; C-B: cancer versus benign; and C-B/N: cancer versus normal and benign.
| MW (kd) | P (C-N) | P (C-B) | P (C-N/B) |
| 4.47 | < 0.001 | < 0.001 | < 0.001 |
| 5.54 | < 0.001 | < 0.001 | < 0.001 |
| 6.65 | < 0.001 | 0.13 | < 0.001 |
| 11.69 | < 0.001 | 0.017 | < 0.001 |
| 21.5 | < 0.001 | 0.43 | < 0.001 |
Table 3.
Performance of the decision tree in predicting ovarian cancer. Numbers in parentheses denote the number of correctly classified sample out of total number of samples in the group.
| Sensitivity% | Specificity% | |
| Learning set | 94.9 (37/39) | 85.9 (73/85) |
| Cross-validation | 84.6 (33/39) | 80.0 (68/85) |
| Test set | 80.0 (4/5) | 80.0 (8/10) |
DISCUSSION
The high degree of genetic heterogeneity associated with human cancers makes it likely that panels of multiple biomarkers will be needed to improve early detection/diagnosis. This entails the development of high-throughput proteomic and genetic approaches as well as of reliable bioinformatic tools for data analysis.
The SELDI proteinChip system offers the advantage of rapid and simultaneous detection of multiple proteins from complex biologic mixtures. We employed this system in combination with the BPS classification algorithm for protein profiling of ovarian cancer in serum. Using this approach, a classifier that was 80% accurate in discriminating patients with ovarian cancer from patients with benign disease and healthy controls from a blinded test set was generated. Evaluation of the classifier by cross-validation and the analysis of the independent test set offers statistical confidence of the potential of this approach as an ovarian cancer detection tool. However, the sample size included in this study decreases the validity of generalized conclusions. Complete evaluation of this classifier will require testing its prediction rates for larger “blinded” and independent serum sets.
The BPS software was found to be relatively simple to use. However, BPS, like other mathematical algorithms, is prone to data overfitting, and also is not reliable when a large number of variables relative to samples sizes are included in the analysis. A preselection process of the most significant variables using statistical analysis (eg, ROC curve, ANOVA) may help in alleviating this problem.
Petricoin et al [19] recently reported the successful application of a genetic algorithm for the analysis of SELDI proteomic data from ovarian cancer patients. In this study, five discriminatory peptides were detected, moleculalr mass range 500–2500 daltons, and the accuracy in predicting ovarian cancer in a blinded set of samples was 97.4%. We focused on the analysis of potential biomarkers in higher mass ranges (> 2000 daltons). Furthermore, in contrast to the case where BPS algorithm is processed, that is, labeled peak information is analyzed, the genetic algorithm employed by Petricoin et al analyzes time-of-flight “raw” SELDI data. In this case, prerequisite for the further identification of the potential discriminatory markers is the coupling of the genetic algorithm with a peak identification system where the raw data are translated into protein peak information. BPS employs the peak identification system of the SELDI software facilitating biomarker detection. It should be noted, however, that careful and precise selection of the peak labeling settings and normalization of peak intensities are considered critical for biomarker identification and for the efficient and reliable performance of any learning algorithm used in conjunction with the SELDI system.
Besides providing a preliminary evaluation of the suitability of BPS for the comparison of SELDI data, our study also demonstrates the potential of combining spectral data from different types of surfaces as a means to increase protein resolution. Although, compared to SELDI, the resolving power of 2D gel electrophoresis remains unchallenged, we have found that this combinatorial approach can significantly enhance biomarker discovery and increase test accuracy for ovarian and breast cancers from 70–75% up to 90% [21].
In conclusion, the BPS software appears to be potentially suitable for analysis of the high-dimensional SELDI spectral data. Avenues for improvement of the algorithm performance include optimization of the peak labeling process as well as preselection of the most significant peaks by statistical approaches. More extended studies will be required to validate the potential and reliability of BPS as a bioinformatic tool for proteomic studies. It should also be emphasized that comparative analysis of different types of algorithms will be of paramount importance for the better evaluation of their performance and the selection of the bioinformatic features needed for effective biomarker discovery and discrimination of cancer.
Acknowledgments
ACKNOWLEDGMENT
This study was supported by grants from the Gustavus and Louise Pfeiffer Research Foundation, the Early Detection Research Network, NCI (CA85067), and the Virginia Prostate Center.
References
- Hensley M L, Castiel M, Robson M E. Screening for ovarian cancer: what we know, what we need to know. Oncology (Huntingt) 2000;14(11):1601–1616. [PubMed] [Google Scholar]
- Holschneider C H, Berek J S. Ovarian cancer: epidemiology, biology, and prognostic factors. Semin Surg Oncol. 2000;19(1):3–10. doi: 10.1002/1098-2388(200007/08)19:1<3::aid-ssu2>3.0.co;2-s. [DOI] [PubMed] [Google Scholar]
- Menon U, Jacobs I J. Recent developments in ovarian cancer screening. Curr Opin Obstet Gynecol. 2000;12(1):39–42. doi: 10.1097/00001703-200002000-00007. [DOI] [PubMed] [Google Scholar]
- Jones M B, Krutzsch H, Shu H, et al. Proteomic analysis and identification of new biomarkers and therapeutic targets for invasive ovarian cancer. Proteomics. 2002;2(1):76–84. [PubMed] [Google Scholar]
- Bergman A C, Benjamin T, Alaiya A, et al. Identification of gel-separated tumor marker proteins by mass spectrometry. Electrophoresis. 2000;21(3):679–686. doi: 10.1002/(SICI)1522-2683(20000201)21:3<679::AID-ELPS679>3.0.CO;2-A. [DOI] [PubMed] [Google Scholar]
- Alaiya A A, Franzen B, Fujioka K, et al. Phenotypic analysis of ovarian carcinoma: polypeptide expression in benign, borderline and malignant tumors. Int J Cancer. 1997;73(5):678–683. doi: 10.1002/(sici)1097-0215(19971127)73:5<678::aid-ijc11>3.0.co;2-2. [DOI] [PubMed] [Google Scholar]
- Thompson S, Turner G A. Elevated levels of abnormally-fucosylated haptoglobins in cancer sera. Br J Cancer. 1987;56(5):605–610. doi: 10.1038/bjc.1987.249. [DOI] [PMC free article] [PubMed] [Google Scholar]
- Hutchens T W, Yip T T. New desorption strategies for the mass spectrometric analysis of macromolecules. Rapid Commun Mass Spectrom. 1993;7:576–580. [Google Scholar]
- Merchant M, Weinberger S R. Recent advancements in surface-enhanced laser desorption/ionization-time of flight-mass spectrometry. Electrophoresis. 2000;21(6):1164–1177. doi: 10.1002/(SICI)1522-2683(20000401)21:6<1164::AID-ELPS1164>3.0.CO;2-0. [DOI] [PubMed] [Google Scholar]
- Reddy G, Dalmasso E A. SELDI proteinchip® array technology: protein-based predictive medicine and drug discovery applications. J Biomed Biotechnol. 2003;2003(4):237–241. doi: 10.1155/S1110724303210020. [DOI] [PMC free article] [PubMed] [Google Scholar]
- Wright G L.Jr. SELDI proteinchip MS: a platform for biomarker discovery and cancer diagnosis. Expert Rev Mol Diagn. 2002;2(6):549–563. doi: 10.1586/14737159.2.6.549. [DOI] [PubMed] [Google Scholar]
- Wright G L.Jr, Cazares L H, Leung S M, et al. Proteinchip(R) surface enhanced laser desorption/ionization (SELDI) mass spectrometry: a novel protein biochip technology for detection of prostate cancer biomarkers in complex protein mixtures. Prostate Cancer Prostatic Dis. 1999;2(5-6):264–276. doi: 10.1038/sj.pcan.4500384. [DOI] [PubMed] [Google Scholar]
- Paweletz C P, Gillespie J W, Ornstein D K, et al. Rapid protein display profiling of cancer progression directly from human tissue using a protein biochip. Drug Dev Res. 2000;49:34–42. [Google Scholar]
- Cazares L H, Adam B L, Ward M D, et al. Normal, benign, preneoplastic, and malignant prostate cells have distinct protein expression profiles resolved by surface enhanced laser desorption/ionization mass spectrometry. Clin Cancer Res. 2002;8(8):2541–2552. [PubMed] [Google Scholar]
- Paweletz C P, Trock B, Pennanen M, et al. Proteomic patterns of nipple aspirate fluids obtained by SELDI-TOF: potential for new biomarkers to aid in the diagnosis of breast cancer. Dis Markers. 2001;17(4):301–307. doi: 10.1155/2001/674959. [DOI] [PMC free article] [PubMed] [Google Scholar]
- Vlahou A, Schellhammer P F, Mendrinos S, et al. Development of a novel proteomic approach for the detection of transitional cell carcinoma of the bladder in urine. Am J Pathol. 2001;158(4):1491–1502. doi: 10.1016/S0002-9440(10)64100-4. [DOI] [PMC free article] [PubMed] [Google Scholar]
- Adam B L, Qu Y, Davis J W, et al. Serum protein fingerprinting coupled with a pattern-matching algorithm distinguishes prostate cancer from benign prostate hyperplasia and healthy men. Cancer Res. 2002;62(13):3609–3614. [PubMed] [Google Scholar]
- Qu Y, Adam B L, Yasui Y, et al. Boosted decision tree analysis of surface-enhanced laser desorption/ionization mass spectral serum profiles discriminates prostate cancer from noncancer patients. Clin Chem. 2002;48(10):1835–1843. [PubMed] [Google Scholar]
- Petricoin E F, Ardekani A M, Hitt B A, et al. Use of proteomic patterns in serum to identify ovarian cancer. Lancet. 2002;359(9306):572–577. doi: 10.1016/S0140-6736(02)07746-2. [DOI] [PubMed] [Google Scholar]
- Li J, Zhang Z, Rosenzweig J, Wang Y Y, Chan D W. Proteomics and bioinformatics approaches for identification of serum biomarkers to detect breast cancer. Clin Chem. 2002;48(8):1296–1304. [PubMed] [Google Scholar]
- Vlahou A, Laronga C, Wilson L, et al. A novel approach toward development of a rapid blood test for breast cancer. Clin Breast Cancer. 2003;4(3):203–209. doi: 10.3816/cbc.2003.n.026. [DOI] [PubMed] [Google Scholar]