

Abstract
Activation of inflammatory processes is observed within the brain as well as periphery of subjects with Alzheimer's disease (AD). Whether or not inflammation represents a possible cause of AD or occurs as a consequence of the disease process, or, alternatively, whether the inflammatory response might be beneficial to slow the disease progression remains to be elucidated. The cytokine IL-18 shares with IL-1 the same pro-inflammatory features. Consequent to these similarities, IL-18 and its endogenous inhibitor, IL-18BP, were investigated in the plasma of AD patients versus healthy controls (HC). An imbalance of IL-18 and IL-18BP was observed in AD, with an elevated IL-18/IL-18BP ratio that might be involved in disease pathogenesis. As part of the inflammatory response, altered levels of RANTES, MCP-1 and ICAM-1, molecules involved in cell recruitment to inflammatory sites, were observed in AD. Hence, correlations between IL-18 and other inflammatory plasma markers were analyzed. A negative correlation was observed between IL-18 and IL-18BP in both AD and HC groups. A positive correlation was observed between IL-18 and ICAM-1 in AD patients, whereas a negative correlation was evident in the HC group. IL-18 positively correlated with Aβ in both groups, and no significant correlations were observed between IL-18, RANTES and MCP-1. An important piece of evidence supporting a pathophysiologic role for inflammation in AD is the number of inflammatory mediators that have been found to be differentially regulated in AD patients, and specific ones may provide utility as part of a biomarker panel to not only aid early AD diagnosis, but follow its progression.
Keywords: IL-18, IL-18BP, ICAM-1, RANTES, MCP-1, THP-1, amyloid-β peptide, Alzheimer's disease, neuroinflammation
Introduction
Alzheimer's disease (AD) is clinically characterized by a progressive cognitive decline accompanied by the presence of amyloid plaques and neurofibrillary tangles within the brain. The major component of neuritic plaques is the amyloid-β (Aβ) protein. Aβ peptides can be measured both within cerebrospinal fluid (CSF) and plasma; however, the source of the peptides remains unknown. Aβ-Apolipoprotein (Apo)E and Aβ-ApoJ complexes may cross the blood-brain barrier (BBB) [1] and plasma Aβ may be incorporated into amyloid plaques. Thus, ApoE may represent a key regulator of brain Aβ levels, and it is likely that processes that regulate ApoE activity will influence Aβ deposition and clearance. The ApoE-ε4 allele is known to be a risk factor for common late-onset familial and sporadic AD [2]. Protein interactions between ApoE and tau protein or Aβ are proposed as mechanisms that could explain this genetic effect. As yet, however, the mechanisms controlling Aβ deposition or clearance and the relationship between peripheral and brain Aβ concentrations remain incompletely understood. Giri et al. have shown that Aβ can induce the migration of monocytes across a monolayer of normal human brain endothelial cells that serves as a cellular model of the BBB [3], suggesting that the same may occur in vivo.
Depending on their activation status, T cells may cross-talk with neurons and microglia, and either mediate damage or protect neurons from stressful stimuli [4]. Inter-Cellular Adhesion Molecule 1 (ICAM-1) is involved in cell-cell interactions and leukocyte extravasation at inflammatory sites, and has been found not only in senile plaques containing Aβ but also within structures containing low levels of Aβ. It is hence likely that ICAM may have a peripheral role in AD, as supported by a study showing increased plasma levels of ICAM-1 in individuals with AD compared to healthy controls (HC). An inflammatory state is invariably associated with AD, as evidenced by an increase of pro-inflammatory cytokines and chemokines (cyto-chemokines) around amyloid deposition. CC chemokines, such as RANTES (regulated on activation, normal T-cell expressed and secreted) and monocyte chemoattractant protein (MCP), are found on endothelial cells, glia and neurons throughout the brain, suggesting important functions for this inflammatory superfamily in the CNS [5,6]. RANTES and MCP-1 expression has been associated with a wide range of inflammatory disorders and some neurological disorders, including AD [7]. In these diseases, RANTES could be correlated with Th1 (helper T cell) responses, since it is thought to promote leukocyte infiltration in sites of inflammation and activate T cells [8,9]. MCP-1, however, promotes attraction and activation of monocytes, activates T cells, NK cells, and basophils, and plays a role in trans-endothelial migration of inflammatory cells. Recently, some authors have reported that MCP-1 and RANTES show opposing trends during healthy ageing, consequent to a complex remodelling of the cytokine network and altered T cell function [9]. Interleukin 18 (IL-18), a cytokine primarily recognized to be a modulator of immune functions, plays an important role in the deregulation of Th1-mediated diseases and exerts proinflammatory effects by inducing gene expression and synthesis of TNF-α, IL-1, chemokines [10], and adhesion molecules [11-12].
IL-18 is generated as a biologically inactive precursor molecule (pro-IL-18) that lacks a signal peptide. The processing and release of IL-18 from its precurrsor-form is induced by inflammasomes. These multiprotein oligomers contain caspase-1 and other immune proteins (NALP and PYCARD, and occasionally caspase-5 or -11) cleave precursors of pro-inflammatory cytokines, such as IL-1β and IL-18, to generate their mature and active forms. Interestingly, Aβ activates NALP-dependent inflammasomes, which can subsequently evoke the hallmarks of AD via caspase cascades and the release of inflammatory cytokines. In this regard, the expression of IL-18 appears to be significantly elevated in brain specimens from AD patients and also in Aβ treated neurons from transgenic Alzheimer mice [13]. IL-18 can additionally enhance amyloid plaque formation by inducing the expression of presenelin-1 (PS-1) and the Aβ cleaving enzyme, BACE-1. Likewise, IL-18 can elevate protein levels of Cdk5/p35 and GSK-3 kinases, leading to tau phosphorylation [13]. These results suggest that IL-18 may act as a signal that mediates communication between the nervous and immune systems. The activity of IL-18 can be regulated by IL-18-binding protein (IL-18BP), which is constitutively expressed and secreted in mononuclear cells, has a high and selective affinity for IL-18 and thus appears to be the natural inhibitor of IL-18 activity [14]. It is feasible that IL-18BP, localized in plaques may function as the binding site for IL-18, and this complex may thereby inhibit plaque uptake from the extracellular space to the glial cells. Thus, whereas IL-18 can enhance progression of AD, the IL-18BP neutralizing IL-18 activity can potentially slow the progression of AD.
Recent studies have suggested a possible involvement of systemic cyto-chemokines in AD, although debate continues as to whether brain cytokine overproduction might contribute to the pool of peripheral cytokines consequent to spillover from the central nervous system (CNS) or, alternatively, whether peripheral cytokines might affect human brain functions by crossing the BBB and interacting within the CNS. The presence of the ApoE-ε4 allele, a major risk factor for sporadic AD, was also analyzed to verify the relationship between the inflammatory molecules and ApoE genotype and to determine their value in a panel of possible biomarkers in AD.
Materials and Methods
Subjects
Patients with probable AD were considered appropriate for enrolment (20 men and 18 women) aged 73.8±5.5 years from the Department of Neurology, University of Chieti-Pescara, Chieti, Italy. The diagnosis of probable AD was based on the guidelines of the Diagnostic and Statistical Manual of Mental Disorders–fourth edition (DSM-IV- TR) [15] and the criteria of the National Institute of Neurological and Communicative Disorders and Stroke-Alzheimer's Disease and Related Disorders Association (NINCDS-ADRDA) [16]. Cognitive and functional status was assessed by the Mini Mental State Examination (MMSE) [17]. A full history, including family history, was completed for each patient. Written informed consent was obtained from all subjects or their legal caregivers. All subjects were assessed in a uniform manner with identical instruments and procedures. Laboratory blood tests were performed to exclude metabolic causes of dementia (FT3, FT4, TSH, Vitamin B-12 and folic acid) and assessed the inflammatory status (erythrocyte sedimentation rate and C-reactive protein) of each recruited subject.
AD patients with concomitant neoplastic or hematological disorders, alcoholism, diabetes, recent infections, abnormal white blood cell count or surgery, severe hepatic or renal insufficiency, myocardial infarction or cranial trauma in the previous 6 months, or who had undergone antiplatelet, anti-inflammatory, antihypertensive, antineoplastic, corticosteroid or immunosuppressive drug treatments in the preceding 2 weeks were excluded. All patients were requested to have undergone a computed tomography or magnetic resonance imaging (MRI), to validate the diagnosis of AD. None of the participants were smokers or vegetarians, none were known to be taking vitamin B12 or folates (including multivitamins) or prescribed drugs known to affect circulating homocysteine or nitric oxide concentrations. Signs of malnutrition were excluded on the basis of physical examination and biochemical parameters (serum albumin, vitamin B-12 and folic acid).
We also included 39 healthy (18 men, 21 women, mean age 72.7±4.8) age-frequency matched controls. All control subjects had no history of neurological or psychiatric disorders and underwent the same examinations and laboratory blood tests as the AD patients.
Genotyping
DNA was purified from 200 μl whole blood with the QIAamp® DNA Blood Mini Kit (Qiagen, Milano, Italy) according to the manufacturer's Protocol, DNA binds specifically to the QIAamp silica-gel membrane while contaminants pass through, and pure and ready-to-use DNA is then eluted in water or low-salt buffer. The DNA concentration was measured by reading optical densities at 260 nm, and it then was stored at –20°C. until utilized. The fourth exon of the ApoE gene was amplified by the polymerase chain reaction (PCR), by using biotinylated primers, and the ApoE genotype determined by using a reverse DNA hybridization test, as recommended by INNO-LiPA ApoE Kit (Innogenetics S.r.l, Italy).
Plasma collection
Citrate treated (Sarstedt, Nümbrecht, Germany) plasma samples were obtained from AD patients and HC subjects with informed consent by peripheral vein puncture. Plasma was prepared by centrifugation (10 min at 2000 rpm), the samples were then aliquoted and stored in polypropylene tubes at -80°C until analysed. A consecutive code number was assigned to each sample to ensure that all assays were performed in a blinded manner.
Plasma Aβ
Plasma levels of Aβ, were determined with commercially available single-parameter ELISA kits (Biosource International, Camarillo, CA, U.S.A.). With each assay, the clinical samples, together with a blank (sample diluent), the prepared calibrator solutions and the appropriate controls, were tested strictly following the test instructions provided within the kit inserts. Absorbance was measured by Bio-Rad ELISA plate reader (Bio-Rad, Hercules, CA, USA) set at 450 nm and 550nm λ. To correct for optical imperfections in the microplate, 550 nm λ values were subtracted from 450 nm λ values. All samples were run in duplicate. If the intra-assay coefficient of variation (CV) was >20% (calculated as range×100/average) or if concentrations obtained were out-of-range (OD values not between mean OD values of highest and lowest calibrator concentration), samples were retested (with appropriate extension of the calibrator concentration range in the case of any out-of-range concentrations). The concentration range of the test kits, as described in the package inserts, is Aβ40: 7.1–1000pg/ml.
Quantification of cytokine levels
Concentrations of IL-18 and IL-18BP in the serum samples and culture supernatants were determined using commercial ELISA kits from Bender Medsystems (Burlingame, CA, USA) and R&D Systems (Minneapolis, MN, USA), respectively. The detection limits for these kits are 12 pg/mL and 60 pg/mL, respectively. Influence deriving from cross-reactivity and interference of circulating factors of the immune system was evaluated by spiking these proteins at physiologically relevant concentrations into a human IL-18 positive sample. No cross reactivity or interference was detectable, notably not with pro-IL-18. The IL-18BP kit is specific for measurement of the “a” isoform, which accounts for almost all the IL-18-binding activity in the human circulation. The inter- and intra-assay coefficients of variation were 8% and 5%, respectively. For each individual, free IL-18 was calculated from the individual's data on serum IL-18 and IL-18BP concentrations, in accordance with the law of mass action [18]. The calculation was based on the fact that IL-18BP binds IL-18 with a 1:1 stoichiometry and with a dissociation constant (Kd) of 0.4 nmol/L.
Chemokine assay
MCP-1 and RANTES release were evaluated by commercial ELISA kits (Endogen, Woburn, MA, USA), following the manufacturer's instructions. Before assay, samples were thawed at room temperature and diluted (1:10), with the sample diluents, in order to obtain values lower than the upper limit of the calibration range. The detection limit of the assay (described in the ENDOGEN Lab manual) was <10pg/ml for MCP-1 and <2pg/ml for RANTES. The range of analysis was between 51-2000 pg/ml for both MCP-1 and RANTES. The intra- and inter-assay reproducibility were >90%. Duplicate values that differed from the mean by greater than 10% were not considered for further analysis.
Soluble adhesion molecule ICAM-1
Plasma concentrations of ICAM-1 were measured with a commercially available ELISA, in accord with the manufacturer's protocol (Invitrogen, Life Technologies, Paisley, UK)
Isolation of PBMCs (peripheral blood mononuclear cells)
Separation and stimulation of PBMCs was performed as described elsewhere [19]. Briefly, 10 ml EDTA tubes (Terumo, Leuven, Belgium) were filled with venous blood drawn from AD patients and HC volunteers between 9 and 10 a.m. The PBMC fraction was obtained by density centrifugation of diluted blood (1 part blood to 1 part pyrogen-free saline) over Ficoll-Paque (GE Healthcare, EuroClone, Pero (MI) Italy). PBMCs were washed twice in saline and suspended in culture medium (RPMI-1640, Sigma) supplemented with 10% FBS, L-glutamine, and PES (Sigma-Aldrich Co., St. Louis, MO, USA). The cells were counted and the concentration was adjusted to 1×10⁶ cells/ polypropylene round-bottom tube (Becton Dickinson, Franklin Lakes, NJ). The viability of cells, assessed by Trypan blue dye exclusion, was not significantly influenced by the cell culture conditions, and more than 98% of PBMCs were viable at the end of incubation. After a 24 hr incubation at 37°C, cell-free supernatants were removed and stored at -80°C until assay, and pelletted cells were similarly kept until analysis. No solution contained detectable LPS, as determined by the Limulus amoebocyte lysate assay (sensitivity limit 12 pg/ml; Associates of Cape Cod, MA, USA), and mycoplasma contamination (General-probe II; General-probe Inc., San Diego, CA, USA) was found to be negative. The same batch of serum and medium were used in all experiments.
THP-1 maintenance and preparation
Cells were grown as a suspension culture and maintained in RPMI-1640 media with 10% fetal bovine serum and 200 ug/mL of penicillin and streptomycin at a cell density of 2×10⁵ cells/mL (37°, 5% CO2). The cells were split and the media changed three times a week. Before each experiment, cell viability was assessed by Trypan blue exclusion. Cell suspensions were harvested by centrifugation for 5 min at 4°, 300 g. Finally, cells together with cell-free supernatants were maintained at -80°C until analysis.
mRNA extraction and reverse transcription–polymerase chain reaction analysis
Total RNA was extracted from PBMC and THP-1 cell cultures using TRIzol reagent (Invitrogen, Life Technologies, Paisley, U.K.), according to the manufacturer's protocol. The RNA concentration was estimated by measuring the absorbance at 260 nm λ using a Bio-Photometer (Eppendorf AG, Hamburg, Germany), and RNA samples were kept frozen at –80 °C until use. Purified RNA was electrophoresed on a 1% agarose gel to assess the integrity of the purified RNA. One microgram of RNA was reverse transcribed into cDNA using a High Fidelity Superscript reverse transcriptase commercially available kit (Applied Biosystems, Foster City, CA, USA), in accord with the manufacturer's instructions. mRNA/cDNA specific cytokine primer pairs were designed and PCR was performed using the following primer pairs (20 pmol/ l each): IL-18 (product 342 bp), forward: 5′ GCTTGAATCTAAATTATCAGTC 3′ and reverse: 5′ GAAGATTCAAATTGCATCTTAT 3′. IL18BPa (product 466 bp), forward: 5′ TGGGAGATGTAGCCGACCTT 3′ and reverse: 5′ GCCCCGACCCTCTATTTCA 3′, 18S (product 199 bp) was used as a control, forward: 5′ TTGCCATCACTGCCATTAAG 3' and reverse: 5′ TTTCCATCCTTTACATCCTTCTG 3′. All polymerase chain reactions (PCRs) were performed in PCR-express cyclers (Hybaid, Heidelberg, Germany). The PCR amplification condition was as follows: 94 °C 1 min, 55 °C, 1 min, 72 °C 1 min 32 cycles; 94 °C 45 sec, 57 ° 45 sec, 72 °C 1 min, 32 cycles, 94 °C 1 min, 55 °C, 1 min, 72 °C 1 min 28 cycles. The program was terminated with a period of 10 min at 72 °C. To be within the exponential phase of the semi-quantitative PCR reaction, the appropriate number of cycles was pre-established for every set of samples. PCR products were separated by gel electrophoresis on 2% agarose gels and visualized by ethidium bromide staining. All gels were scanned and the normalized intensities of all reverse transcription (RT)-PCR products were determined by the BioRad gel documentation system (BioRad, Hercules, CA, USA). Mean ± SD intensities were calculated for all RT-PCR experiments.
Statistical analysis
All quantitative characteristics are summarized as the mean value ± standard deviation (SD) and all qualitative variables as frequency and percentage. The results are reported separately for AD patients (stratified in ApoE-ε4, ApoE-ε3 and ApoE-ε2) and HC subject.
A Shapiro-Wilk test could not confirm that the data are distributed normally and, therefore, non-parametric statistical methods were used in their analysis. Box-whiskers plots were used for the presentation of cytokine levels and show median values (transverse lines in the box), the 25th and 75th percentile range (hinges of the box) and the range of the values that fall within the 1.5 inter-quartile range (whiskers). The points outside the ends of the whiskers are outliers or suspected outliers.
Differences in characteristics and inflammatory molecule levels of patients amongst HC and AD were tested by Mann-Whitney U test and Pearson chi-square test for continuous and categorical variables, respectively. Kruskal-Wallis H test was applied for assessing the comparison between the following four groups (ApoE-ε4, ApoE-ε3, ApoE-ε2 and HC), such comparison between groups were then evaluated using a Kruskal-Wallis post-hoc test. The Spearman rho correlation coefficient was applied to evaluate the correlation between IL-18 and other inflammatory molecules. All statistical tests were evaluated at an alpha level of 0.05. Statistical analysis was performed using SPSS® Advanced Statistical 11.0 software (SPSS Inc., Chicago, Illinois, USA).
Results
Subjects
The demographics and clinical characteristics of the population studied are presented in Table 1. The two groups were similar with respect to age, gender and educational state. AD patients, as expected, had a significantly lower Mini-Mental Status Examination (MMSE) score compared to the HC group. The ApoE-ε4 allele frequency was higher within the AD group. Within the AD ApoE genotype subgroups, there were no statistical differences between gender, age, education and MMSE.
Table 1.
Characteristics of patients with Alzheimer's disease (AD) for different ApoE genotype and healthy control (HC) subjects.
| Variable | HC (n=39) | AD (n=38) | p-valuea | AD | |||
|---|---|---|---|---|---|---|---|
|
| |||||||
| ApoE- ε4 (n=14) | ApoE- ε3 (n=15) | ApoE-ε2 (n=9) | p-valuec | ||||
| Age (years), mean±SD | 72.7±4.8 | 73.8±5.5 | 0.171 | 72.9±6.2 | 75.9±5.1 | 72.0±4.5 | 0.702 |
| Gender, n (%) | 0.734b | 0.803b | |||||
| Male | 18 (46.2) | 20 (52.6) | 6 (42.8) | 8(53.3) | 6 (66.7) | ||
| Female | 21 (53.8) | 18(47.4) | 7 (57.2) | 7 (46.7) | 4(33.3) | ||
| MMSE score, mean±SD | 25.7±3.2 | 19.2±3.9 | <0.001 | 19.3±4.1 | 18.8±4.1 | 19.6±3.3 | 0.963 |
| ADAS-Cog, mean±SD | - | 21.6±1.4 | 20.7±1.6 | 21.3±2.1 | 20.9±2.3 | ||
| Disease duration (months), range | - | 8-24 | - | 8-24 | 9-24 | 9-20 | |
| Education (years), mean±SD | 10.2±2.1 | 9.3±3.3 | 0.093 | 9.1 ±3.2 | 9.3 ±3.3 | 9.5 ±3.2 | 0.972 |
Mann-Whitney U test;
Chi-squared test AD patients vs HC subject.
Kruskal-Wallis H test.
MMSE: higher scores correspond to better performance
ADAS-Cog: higher scores indicate greater cognitive impairment
Plasma concentration of the inflammatory molecules
Significant differences in plasma levels of IL-18 were observed between AD patients and controls. As IL-18 is neutralized by its circulating natural inhibitor, IL-18BP, a good estimation can be provided by the simultaneous detection of both IL-18 and IL-18BP. Dramatically higher plasma IL-18BP levels were observed in HC compared to AD subjects (3720.3±663.3 vs 359.2±142.5 pg/mL). In accord with lower circulating levels of IL-18BP, the mean free IL-18 plasma level in AD patients was elevated (247.8±92.6 pg/mL (Table 2)), and all individual levels of IL-18 were above the highest observed level in control subjects by approximately 2-fold (p<0.001 Mann-Whitney U test). Consequently, in AD patients the ratio of IL-18/IL-18BP (0.89±0.68) was higher than in HC (0.03±0.01). Analysis of IL-18BP and IL-18 levels demonstrated a significant negative correlation between these two proteins in each group (rho=-0.437, p<0.01 and rho=-0.395; p<0.05 for AD and HC, respectively). Unbound IL-18BP was in excess compared with total IL-18 in HC, whereas within the AD group there was relatively little difference between IL-18 and IL-18BP levels (Table 2).
Table 2.
Mean ± Standard deviation of inflammatory molecule levels in patients with Alzheimer's disease (AD) and healthy control (HC) subjects.
| Variable | HC (n=39) | AD (n=38) | p-valuea |
|---|---|---|---|
| IL-18(pg/ml) | 102.6±11.4 | 247.8±92.6 | <0.001 |
| IL-18BP(pg/ml) | 3720.3±663.3 | 359.2±142.5 | <0.001 |
| IL-18/IL-18BP | 0.03±0.01 | 0.89±0.68 | <0.001 |
| MCP-1 (pg/ml) | 2196.9±472.8 | 1599.3±578.5 | <0.001 |
| RANTES (pg/ml) | 1812.0±583.5 | 5344.4±2204.8 | <0.001 |
| ICAM-1 (pg/ml) | 152,7±15.8 | 188.5±83.5 | 0.004 |
Mann-Whitney U test
To assess whether the observed IL-18 elevation supports the hypothesis that activation of the inflammatory response in AD is Th1-dependent, the levels of RANTES, MCP-1 and sICAM-1 were quantified in the plasma of all AD and HC subjects. Shown in Table 2, approximately 3-fold higher levels of RANTES were evident in the plasma of AD compared to HC subjects, whereas lower plasma MCP-1 levels (0.73-fold) were apparent in AD. These results replicate the previously established finding that higher RANTES and lower MCP-1 levels are expressed and released from PBMCs isolated from peripheral blood of AD compared to those from HC [20]. Additionally, and in accord with data reported by Rentzos et al. [21], plasma levels of ICAM-1 were significantly elevated (p=0.004) in AD (188.5±83.5 pg/mL) compared to HC (152.7±15.8 pg/mL) (Table 2).
Correlation between IL-18 concentrations and IL-18BP, ICAM-1, RANTES and MCP-1
Correlations were studied between free IL-18 concentrations and various molecules detected in plasma of AD and HC subjects. As described above, a negative significant correlation was observed between IL-18 and IL-18BP in both groups. A positive correlation was observed between ICAM-1 and IL-18 in AD patients (rho=0.629, p<0.001), whereas a negative correlation was observed in HC (rho= -0.192, p=0.256). IL-18 was positively correlated with Aβ in both groups (rho=0.571, p<0.001 and rho=0.052, p=0.761, respectively). No significant correlations were observed between IL-18 and RANTES and MCP-1 (Fig. 1).
Figure 1.

Correlation coefficient between IL-18 concentration and inflammatory molecules analyzed in plasma of Alzheimer Disease (AD) patients and healthy controls (HC) subjects.
IL-18 and IL-18BP mRNA expression
The mRNA expression of IL-18 and IL-18BP was assessed in freshly isolated PBMCs from 10 AD and 10 HC subjects amongst those enrolled in the study, to define mechanisms responsible for the observed changes in the circulating levels of these proteins. Figure 2 shows that higher IL-18 mRNA expression was observed in PBMCs from AD patients compared to HC (1.26±0.02 vs 1.02±0.01), as was the case for IL-18BP mRNA (0.9±0.3 vs. 0.5±0.01).
Figure 2.
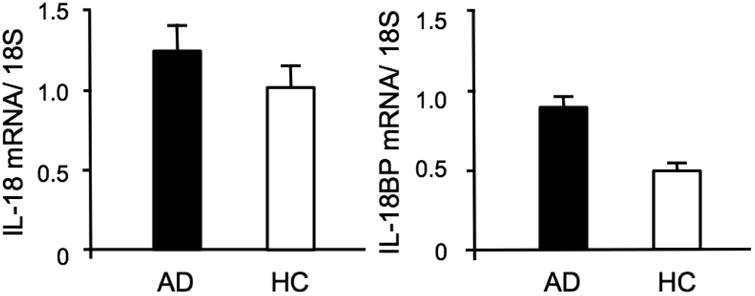
Expression of IL-18 and IL-18BP mRNA in patients with Alzheimer Disease (AD) and in healthy controls (HC).
Interaction of ApoE genotype with biological markers
In order to elucidate the impact of ApoE genotype on the levels of analyzed inflammatory markers, AD patients were subdivided based on their ApoE-ε genotype. A significant influence of ApoE genotype on IL-18 and IL-18BP levels was observed. Specifically, AD patients with an ApoE-ε4 allele showed higher IL-18 plasma levels (304.6±88.6 pg/ml) compared to patients with ApoE-ε3 (218.0±87.8 pg/ml) and ApoE-ε2 (202.7±59.5 pg/ml) (p=0.009 Kruskal-Wallis H test) (Fig. 3); however, ApoE genotype had no significant effect on IL-18 mRNA expression levels (Fig. 4). Conversely, AD patients with ApoE-ε2 and ApoE-ε3 possessed higher plasma IL-18BP levels (490.3±120.9 pg/ml and 418.1±90.7 pg/ml, respectively) than patients with ApoE-ε4 (221.6±59.1 pg/ml) (Fig. 3). An analysis of ApoE genotype interaction on IL-18BP mRNA expression determined that IL-18BP mRNA levels were lower in ApoE-ε4 (n=3; 0.58±0.01) compared to ApoE-ε3 (n=3; 0.61±0.01) and ApoE-ε2 (n=4; 1.28±0.02) (Fig. 4). The relative levels of plasma IL-18, expressed as the ratio IL-18/IL-18BP, were 1.5±0.7 for ApoE-ε4, 0.5±0.2 for ApoE-ε3 and 0.4±0.2 for ApoE-ε2. This lower IL-18/IL-18BP ratio in the plasma of AD patients with ApoE-ε2 supports the prospect of a differential regulation of IL-18BP production amongst ApoE genotypes.
Figure 3.

Box-whiskers graphs of IL-18 and IL-18BP levels in AD patients, stratified in ApoE-ε4, ApoE-ε3 and ApoE-εs2, and HC subject. Box-whiskers plots show the 25th and 75th percentile range (box) and median values (transverse lines within the box). Statistically significant differences were found between four groups (p-value of Kruskal-Wallis post hoc test).
Figure 4.

mRNA levels of IL-18 and IL-18BP in AD patients with different ApoE-ε genotypes. PBMC mRNA levels were analyzed by semiquantitative RT-PCR using primers for hIL-18, hIL-18BP and β-actin.
The association between AD APOE genotype and plasma levels of RANTES, MCP-1 and ICAM-1 is shown in Table 3. Significantly higher levels of RANTES were detected in ApoE-ε4 compared to ApoE-ε3 carriers. In contrast, ApoE-ε2 AD patients possessed significantly higher MCP-1 plasma levels in respect to both ApoE-ε4 (p<0.01) and ApoE-ε3 (p<0.05). ICAM-1 plasma levels were not significantly different across genotypes, albeit there was a trend towards higher levels in ApoE-ε4 versus ApoE-ε3 versus ApoE-ε2 carriers, with the latter being within the realm of HC values.
Table 3.
Mean ± standard deviation of plasma RANTES, MCP-1 and ICAM-1 levels in different ApoE genotype AD patients.
| Variable | ApoE- ε4 (n=14) | ApoE- ε3 (n=15) | ApoE- ε2 (n=9) | Kruskal-Wallis H test p-value |
|---|---|---|---|---|
| RANTES (pg/ml) | 6659.4±2068.7 | 4047.7±1923.9** | 5459.9±1690.3 | 0.010 |
| MCP-1 (pg/ml) | I388.8±355.7 | 1486.8±471.8 | 2114.1±743.8**† | 0.018 |
| ICAM-1 (pg/ml) | 207.5±48.9 | 184.3±98.5 | 163.9± 102.9 | 0.053 |
p<0.05,
p<0.01 and
p<0.001 Kruskal-Wallis post hoc test vs ApoE-ε4
p<0.05 Kruskal-Wallis post hoc test vs ApoE-ε3
Aβ and Aβ challenge
Plasma levels of Aβ1-40 proved to be lower in our AD (83.06±32.1 pg/ml) group than in HC (106.1±19.8 pg/ml) subjects and, similar to Mehta et al. [22], showed no association with MMSE score. However, plasma Aβ levels were significantly influenced by ApoE genotype (ApoE-ε4 114.8 ± 21.7; ApoE-ε3 59.5 ± 18.8 and ApoE-ε2 69.5 ± 18.1 pg/ml; p<0.001Kruskal-Wallis H test), a finding similarly described by Blennow et al. [23] and in accord with the reported differential ability of ApoE isoforms to facilitate the proteolytic degradation of soluble Aβ [24], with ApoE-ε4 showing little activity and hence being associated with higher Aβ levels.
To elucidate mechanisms, PBMCs from HC subjects and THP-1 monocytes were challenged with Aβ and the production and IL-18 and IL-18BP was evaluated. These cells respond to fibrillar forms of Aβ1-42, Aβ 1-40 and Aβ 25-35 with similar efficiency. Both THP-1 and PBMC were treated with different concentrations of Aβ and cells treated with LPS alone were used as a positive control. IL-18BP mRNA was expressed at higher constitutive levels than IL-18 mRNA (Fig. 5). Ex vivo treatment with LPS has been described to induce a marked up-regulation of IL-18 and IL-18BP [25] and, as illustrated in Figure 5, our treatment of LPS-stimulated THP-1 monocytes with Aβ1-40 (10 μM) significantly increased the mRNA expression of IL-18 and IL-18BP. The concentrations of IL-18 and IL-18BP measured in the supernatants of PBMC and THP-1 cultures confirmed the transcription data. IL-18 release was significantly increased (∼8.9-fold and ∼7.6-fold in THP-1 and PBMC, respectively) after incubation with LPS+Aβ, compared to LPS alone. IL-18BP release was, likewise, significantly elevated following incubation with LPS+Aβ (∼6.3-fold and ∼4.4-fold in THP-1 and PBMC, respectively), compared to LPS alone (Fig.6). We propose that this condition may, in part, emulate the increased inflammatory response that could occur during AD pathogenesis.
Figure 5.

Fold-increase of Aβ-mediated mRNA expression of IL-18 and IL-18BP in THP-1 monocytes and PBMCs. Data are representative of three separate experiments. The intensities of bands for IL-18 and IL-18BP are normalized to the 18S signals. Quantification of three separate experiments was performed. The data are expressed as the fold increase relative to mRNA expression of each gene in LPS-stimulated THP-1 and PBMC cells. Data are representative of pooled experiments.
Figure 6.
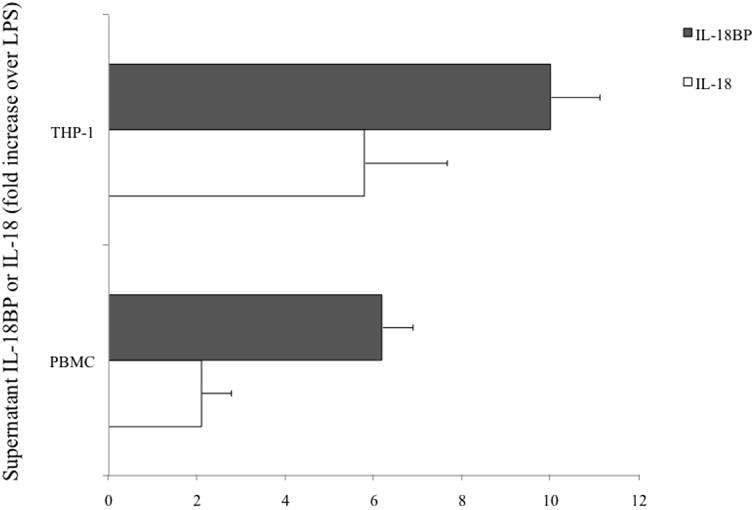
Secretion of IL-18 and IL-18BP in response to LPS+Aβ. PBMC and THP-1 cells were cultured in RPMI containing Aβ (10 μg/ml) and were incubated for 18 hr in the presence or absence of LPS (10 μg/ml). The data represent the fold-increase over the LPS-induced IL-18 and IL-18BP production.
Discussion
Our interest focused on the levels of inflammatory molecules within the plasma of AD patients and their relation with the presence of the ε4 allele of ApoE, the major genetic susceptibility factor for late-onset AD. Interestingly, studies on AD have revealed that IL-1β and IL-18 are the key cytokines that display major up-regulation in AD patients, both in brain and plasma [26,13]. The role of IL-1β in AD has been extensively investigated [27], and some studies have indicated a crucial role for IL-18 in the pathogenesis of AD [28,29]. In this study, a comparison of their plasma levels in AD patients with HC subjects assessed the feasibility of pro-inflammatory IL-18 and its endogenous inhibitor IL-18BP as biomarkers for AD. This evaluation expands our previous investigation that revealed higher expression and release of pro-inflammatory cytokines in PBMCs deriving from AD patients [30,31]. A primary finding within the current study is the relation between high plasma levels of pro-inflammatory cyto-chemokines and the ApoE genotype of AD patients. Specifically, AD patients with the ε4 allele appear to be more susceptible to a pro-inflammatory status than those without this allele. Hence ex vivo experiments were undertaken to assess the role of ApoE genotype on IL-18 and IL-18BP mRNA expression in PBMCs.
IL-18 is a potent pro-inflammatory cytokine of the IL-1 superfamily [32-34] that, like IL-1β, is synthesized as a 23-kDa biologically inactive precursor peptide that is subsequently cleaved by caspase-1 to the active 18-kDa monomer. IL-18 acts in synergy with other cytokines and, via its receptor, activates Th1 cells and stimulates release of other pro-inflammatory cytokines, such as TNF-α, IL-1β and IL-8, as well as nitric oxide and prostaglandins [35,36]. IL-18 not only induces IFN-γ production but also up-regulates Fas ligand (CD95), which is expressed on activated T cells and NK cells, and plays a central role in regulating the immune response by inducing apoptosis in activated lymphocytes. The principal protection against disease-promoting actions of IL-18 is provided through its natural counterpart, IL-18BP. Of relevance, this soluble binding protein has no transmembrane or cytoplasmic domain. Its genomic sequence lacks any coding exon for such domains, and thus IL-18BP does not derive from cleavage of a membrane-bound receptor. Rather, and like IL-18, IL-18BP is regulated at the level of its mRNA, that is constitutively expressed in peripheral blood lymphocytes and its induction occurs, at least in part, as a result of IL-18-mediated IFN-γ production. Hence, IL-18BP act as a signal for terminating the IL-18 mediated inflammatory response and, in general, a molar excess of IL-18BP to IL-18 exists, that is in the order of 30-fold in healthy humans [37]. In our AD patients, an IL-18/IL-18BP imbalance was observed, with concentrations of plasma IL-18 being elevated and levels of IL-18BP substantially decreased versus HC subjects (both p<0.001). In line with this heightened plasma IL-18 level in AD, an increase in IL-18 mRNA was evident in PBMCs derived from AD patients vs. HC subjects (Fig. 2). However, contrasting with the IL-18BP plasma level reduction noted in our AD patients, mRNA IL-18BP expression was elevated in AD vs. HC PBMCs. It is hence possible that AD patients have a reduced ability to regulate plasma IL-18 that likely occurs at the level of IL-18BP production, which appears to be deficient. With an IL-18/1l-18BP ratio that is close to unity (0.86) in AD, the availability of plasma IL-18 remains both high and potentially sufficient to perpetuate the pathogenesis of AD. An examination of the relationship between ApoE genotype and IL-18BP mRNA expression (Fig. 4 in comparison to Fig. 2) indicates that expression levels of IL-18BP mRNA were higher (p<0.05) than those of HC subjects only for AD ApoE-ε2 carriers, whereas APOE-ε3 and -ε4 carriers were not different from HC (p>0.05). In contrast, ApoE genotype had little effect on IL-18 mRNA expression levels (Fig. 4). In synopsis, those AD subjects with ApoE-ε2 genotype showed a higher expression and production of IL-18BP and lower IL-18 plasma levels, corroborating the importance of IL-18BP as the inhibitor of the pro-inflammatory activity of IL-18.
As IL-18 induces the synthesis of cell adhesion molecules, nitric oxide, chemokines and other proinflammatory cytokines [20,38,39], we therefore analyzed plasma sICAM-1 levels in our subjects. A significantly higher level of sICAM-1 was evident in AD compared to HC plasma (Table 2), and a correlation between IL-18 and sICAM-1 levels was determined (Fig. 1). These observations are in accord with studies showing that IL-18 enhances sICAM-1 expression and might play a potential role in immune-regulation by mediating adhesive interactions between endothelium and circulating cells during inflammatory reactions [40,41]. In addition, the IL-18 initiated cytokine cascade has been proposed to be dependent on the up-regulation of ICAM-1 on monocytes; indeed, anti-ICAM-1 antibody has been described to down-regulate IL-18-induced IL-12, TNF-α and IFNγ production and up-regulate IL-10 production in a concentration-dependent manner [42]. In primary rat astrocytes, the mRNA expression of IL-1α, IL-1β, and IL-6 is significantly up-regulated by ICAM-1 engagement, suggesting an ICAM-1-mediated inflammatory signal [43]. Hence, the concomitant determination of IL-18, IL-18BP and ICAM-1 could be used as a supplementary non-invasive procedure for monitoring immune reactions in AD.
The entry of activated leukocytes into the central nervous system is guided by leukocyte-secreted chemokines that act in an autocrine manner [44]. The opposing trends in MCP-1 and RANTES levels present in AD (Table 2) likely relates to a complex remodelling of the cytokine network and altered T cell function. In our previous studies we hypothesized that the observed levels of RANTES and MCP-1 in AD subjects, may reflect an alteration in the Th1/Th2 balance [45] and may regulate the selective migration of Th1/Tc1 and Th2/Tc2 cells to the target tissue and affect the type 1 and type 2 immune response [46,47].
Within the current study, we additionally evaluated whether or not the levels of RANTES, MCP-1 and ICAM-1 are correlated with ApoE genotype (Table 3). We hence divided AD patients on the basis of ApoE genotype, and higher levels of RANTES and sICAM-1 and reduced levels of MCP-1 were observed in those with ApoE-ε4, compared to patients with ApoE-ε2. A potential explanation for these results should take into account the role of IL-18. Interestingly, a positive correlation was observed between levels of IL-18, ICAM-1, RANTES and Aβ, whereas a negative correlation was observed between IL-18, IL-18BP and MCP-1. ApoE-ε4 patients, furthermore, showed higher plasma Aβ levels that were sufficient to induce IL-18 and consequently to increase RANTES and ICAM-1, but insufficient to induce MCP-1 and IL-18BP. MCP-1 has been reported to play a crucial role in plaque clearance in animal models of AD [48], suggesting a potentially reparative role. Hence in subjects with lower levels of MCP-1, the up regulation of inflammatory molecules likely helps drive neurodegeneration. Of relevance, the promoter region of the ApoE gene contains inflammatory response transcription factor sites [49] that support the cross-directional regulation of ApoE-ε4 expression by inflammatory proteins and vice versa [50,51].
Previous cross-sectional studies comparing plasma Aβ levels in patients with sporadic AD and controls have reported contradictory results. Elevations of plasma Aβ40 [52] or Aβ42 [53,54] have been described, whereas other studies found no differences between AD and controls [55]. A non-significant correlation between the type of clinical diagnosis and serum Aβ intensity has been described, however, the presence of the ApoE ε4 allele and certain ABCB1 genotypes may predict serum Aβ levels [56]. In general, it has been suggested that changes in blood Aβ levels may be an indicator of AD onset and progression [57,58], albeit further research in this area would be valuable, with the platelet likely contributing the largest source of Aβ peptide in human blood [59]. Platelets have the highest level of APP expression amongst all peripheral tissues and are able to produce all APP fragments found in neurons. Hence platelets are able to process APP via the amyloidogenic pathway (involving β-secretase and γ -secretase) to generate Aβ [60]. The existence of an Aβ-fingerprint in blood can thus partly be explained by the fact that γ-secretase has multiple (seven) potential cleavage sites [61] and it is likely active in platelets. The BBB has been described as critical for brain Aβ homeostasis [1], it is therefore plausible that BBB dysfunction alters the ability of brain Aβ to cross the BBB and enter in the periphery [62], which triggers sICAM-1 shedding from peripheral cells. One can then postulate that brain Aβ accumulation with AD onset and progression may elicit a response by endothelial cells at the BBB that results in an increase in plasma sICAM-1 levels.
Studies have shown that peripheral hemopoietic cells, such as monocytes, can cross the BBB and differentiate into microglial cells within the brain parenchyma [63]. Microglia and astrocytes have been identified as brain-derived sources of growth factors and inflammatory mediators. A well characterized peripheral model of cytokine production by cultured PBMCs, derived from AD and HC subjects, was hence utilzed to elucidate the relative increase in inflammatory response that the brain could be subjected to from microglia and astrocyte exposure to from soluble Aβ and its accumulation in brain. Notably, IL-18 expression was markedly elevated upon exposure of PBMCs to Aβ, which is in accord with studies showing that interaction of Aβ with either microglial cells or THP-1 monocytes, pretreated with LPS, elicit similar responses and increase secretion of proinflammatory cytokines [64]. Hence it is generally considered that Aβ provokes the microglial-mediated inflammatory response, by stimulating glial cells to release inflammatory mediators, which contributes both to neuronal apoptosis [65], synaptic dysfunction and, ultimately, cognitive impairment that is characteristic of AD.
In summary, we demonstrate disturbance within the delicate cytokine/chemokine network in AD patients with up-regulation of specific cytokines/chemokines leading to imbalance of their normal homeostasis. A fuller understanding of the control of IL-18/IL-18BP expression and adaptive regulatory mechanisms in Aβ-stimulated peripheral mononuclear cells are important not only for maintaining an optimal balance of immune system function but also to allow modulation of the development of neuroinflammation in AD. A clear dys-equilibrium in IL-18/IL-18BP is evident in the inflammatory processes of AD and, consequent to the role of IL-18 early within the initiation cascade of severe inflammatory reactions, further elucidation of its part in the pathogenesis of AD could aid in rebalancing the complex actions of the altered cytokine/chemokine network. Hence a panel of biomarkers may prove more useful than an individual protein for assessment of early diagnosis and/or disease progression of AD. Such a panel that allows determination of changes in the ratio of cyto-chemokines known to be regulated and mechanistically linked, as epitomized by IL-18/IL-18BP, likely yields a greater potential to detect a statistically relevant change, rather than assessment of IL-18 alone whose change may [13,26] or may not [66] always reach statistical significance. In a move towards this goal, in the current study we characterized plasma cyto-chemokine levels along with ICAM-1, Aβ and ApoE genotype to elucidate their suitability as part of a putative AD biomarker panel. The changes in key proteins within this panel clearly warrant further investigation both in plasma and CSF in HC, mild cognitive impairment, AD and other neuropsychiatric disorders.
Acknowledgments
This research was supported by the grants from the Italian MIUR (60%, 2009). NG and KM are supported by the Intramural Research Program of the National Institute on Aging, NIH and King Fahd Medical Research Center, King Abdulaziz University, respectively. Authors are grateful to R. Barbacane for his generosity in providing time for observations on this manuscript to improve its scientific quality. Moreover, authors are grateful to Dr. C. Iarlori for providing motivation and inspiration to initiate this research.
References
- 1.Zlokovic BV. Cerebrovascular transport of Alzheimer's amyloid-β and apolipoproteins J and E: possible anti-amyloidogenic role of the blood-brain-barrier. Life Sci. 1996;59:1483–97. doi: 10.1016/0024-3205(96)00310-4. [DOI] [PubMed] [Google Scholar]
- 2.Genin E, Hannequin D, Wallon D, Sleegers K, Hiltunen M, Combarros O, Bullido MJ, Engelborghs S, De Deyn P, Berr C, Pasquier F, Dubois B, Tognoni G, Fiévet N, Brouwers N, Bettens K, Arosio B, Coto E, Del Zompo M, Mateo I, Epelbaum J, Frank-Garcia A, Helisalmi S, Porcellini E, Pilotto A, Forti P, Ferri R, Scarpini E, Siciliano G, Solfrizzi V, Sorbi S, Spalletta G, Valdivieso F, Vepsäläinen S, Alvarez V, Bosco P, Mancuso M, Panza F, Nacmias B, Bossù P, Hanon O, Piccardi P, Annoni G, Seripa D, Galimberti D, Licastro F, Soininen H, Dartigues JF, Kamboh MI, Van Broeckhoven C, Lambert JC, Amouyel P, Campion D. APOE and Alzheimer disease: a major gene with semi-dominant inheritance. Mol Psychiatry. 2011;16:903–7. doi: 10.1038/mp.2011.52. [DOI] [PMC free article] [PubMed] [Google Scholar]
- 3.Giri R, Shen Y, Stins M, Yan SD, Schmidt AM, Stern D, Kim KS, Zlokovic B, Kalra VK. β-Amyloid-induced migration of monocytes across human brain endothelial cells involves RAGE and PECAM-1. Am J Physiol Cell Physiol. 2000;279:C1772–C1781. doi: 10.1152/ajpcell.2000.279.6.C1772. [DOI] [PubMed] [Google Scholar]
- 4.Kerschensteiner M, Meinl E, Hohlfeld R. Neuro-immune crosstalk in CNS diseases. Neuroscience. 2009;158:1122–32. doi: 10.1016/j.neuroscience.2008.09.009. [DOI] [PubMed] [Google Scholar]
- 5.Tripathy D, Thirumangalakudi L, Grammas P. RANTES upregulation in the Alzheimer's disease brain: a possible neuroprotective role. Neurobiol Aging. 2010;31:8–16. doi: 10.1016/j.neurobiolaging.2008.03.009. [DOI] [PMC free article] [PubMed] [Google Scholar]
- 6.Conductier G, Blondeau N, Guyon A, Nahon JL, Rovère C. The role of monocyte chemoattractant protein MCP1/CCL2 in neuroinflammatory diseases. J Neuroimmunol. 2010;224:93–100. doi: 10.1016/j.jneuroim.2010.05.010. [DOI] [PubMed] [Google Scholar]
- 7.Karpus WJ. Chemokines and central nervous system disorders. J Neurovirol. 2001;7:493–500. doi: 10.1080/135502801753248079. [DOI] [PubMed] [Google Scholar]
- 8.Schall TJ, Bacon K, Toy KJ, Goeddel DV. Selective attraction of monocytes and T lymphocytes of the memory phenotype by cytokine RANTES. Nature. 1990;347:669–71. doi: 10.1038/347669a0. [DOI] [PubMed] [Google Scholar]
- 9.Sandmand M, Bruunsgaard H, Kemp K, Andersen-Ranberg K, Pedersen AN, Skinhøj P, Pedersen BK. Is ageing associated with a shift in the balance between Type 1 and Type 2 cytokines in humans? Clin Exp Immunol. 2002;127:107–14. doi: 10.1046/j.1365-2249.2002.01736.x. [DOI] [PMC free article] [PubMed] [Google Scholar]
- 10.Puren AJ, Fantuzzi G, Gu Y, Su MS, Dinarello CA. Interleukin-18 (IFNg-inducing factor) induces IL-8 and IL-1β via TNF-α production from non-CD14 human blood mononuclear cells. J Clin Invest. 1998;101:711–21. doi: 10.1172/JCI1379. [DOI] [PMC free article] [PubMed] [Google Scholar]
- 11.Vidal-Vanaclocha F, Fantuzzi G, Mendoza L, Fuentes AM, Anasagasti MJ, Martin J, Carrascal T, Walsh P, Reznikov LL, Kim SH, Novick D, Rubinstein M, Dinarello CA. IL-18 regulates IL-1-dependent hepatic melanoma metastasis via vascular cell adhesion molecule-1. Proc Natl Acad Sci USA. 2000;97:734–9. doi: 10.1073/pnas.97.2.734. [DOI] [PMC free article] [PubMed] [Google Scholar]
- 12.Stuyt RJ, Netea MG, Geijtenbeek TB, Kullberg BJ, Dinarello CA, van der Meer JW. Selective regulation of intercellular adhesion molecule-1 expression by interleukin-18 and interleukin-12 on human monocytes. Immunology. 2003;110:329–34. doi: 10.1046/j.1365-2567.2003.01747.x. [DOI] [PMC free article] [PubMed] [Google Scholar]
- 13.Ojala J, Alafuzoff I, Herukka S, Van Groen T, Tanila H, Pirttila T. Expression of interleukin-18 is increased in the brains of Alzheimer's disease patients. Neurobiol Aging. 2009;30:198–209. doi: 10.1016/j.neurobiolaging.2007.06.006. [DOI] [PubMed] [Google Scholar]
- 14.Reznikov LL, Kim SH, Zhou L, Bufler P, Goncharov I, Tsang M, Dinarello CA. The combination of soluble IL-18Ralpha and IL-18Rbeta chains inhibits IL-18-induced IFN-gamma. J Interferon Cytokine Res. 2002;22:593–601. doi: 10.1089/10799900252982070. [DOI] [PubMed] [Google Scholar]
- 15.Diagnostic and Statistical Manual of Mental Disorders. 4th. American Psychiatric Association; Washington, D.C.: 1994. [Google Scholar]
- 16.McKhann G, Drachman D, Folstein M, Katzman R, Price D, Stadlan EM. Clinical diagnosis of Alzheimer's disease: report of the NINCDS-ADRDA Work Group under the auspices of the Department of Health and Human Services Task Force on Alzheimer's Disease. Neurology. 1984;34:939–44. doi: 10.1212/wnl.34.7.939. [DOI] [PubMed] [Google Scholar]
- 17.Folstein MF, Folstein SE, McHugh PR. Mini-Mental State: a practical method for grading the cognitive state of patients for the clinician. J Psychiatr Res. 1975;12:189–98. doi: 10.1016/0022-3956(75)90026-6. [DOI] [PubMed] [Google Scholar]
- 18.Novick D, Schwartsburd B, Pinkus R, Suissa D, Belzer I, Sthoeger Z, Keane WF, Chvatchko Y, Kim SH, Fantuzzi G, Dinarello CA, Rubinstein M. A novel IL-18BP ELISA shows elevated serum IL-18BP in sepsis and extensive decrease of free IL-18. Cytokine. 2001;14:334–42. doi: 10.1006/cyto.2001.0914. [DOI] [PubMed] [Google Scholar]
- 19.Böyum A. Isolation of mononuclear cells and granulocytes from human blood. Isolation of monuclear cells by one centrifugation, and of granulocytes by combining centrifugation and sedimentation at 1 g. Scand J Clin Lab Invest. 1968;97:77–89. [PubMed] [Google Scholar]
- 20.Iarlori C, Gambi D, Gambi F, Lucci I, Feliciani C, Salvatore M, Reale M. Expression and production of two selected beta-chemokines in peripheral blood mononuclear cells from patients with Alzheimer's disease. Exp Gerontol. 2005;40:605–11. doi: 10.1016/j.exger.2005.04.007. [DOI] [PubMed] [Google Scholar]
- 21.Rentzos M, Michalopoulou M, Nikolaou C, Cambouri C, Rombos A, Dimitrakopoulos A, Vassilopoulos D. The role of soluble intercellular adhesion molecules in neurodegenerative disorders. J Neurol Sci. 2005;228:129–35. doi: 10.1016/j.jns.2004.11.001. [DOI] [PubMed] [Google Scholar]
- 22.Metha PD, Pirtila T, Patrick BA, Barshatzky Metha SP. Amiloid β protein 1-40 and 1-42 levels in matched cerebrospinal fluid and plasma from patients with Alzheimer disease. Neurosci Lett. 2001;304:101–6. doi: 10.1016/s0304-3940(01)01754-2. [DOI] [PubMed] [Google Scholar]
- 23.Blennow K, De Meyer G, Hansson O, Minthon L, Wallin A, Zetterberg H, Lewczuk P, Vanderstichele H, Vanmechelen E, Kornhuber J, Wiltfang J, KND-Study Group. Heuser I, Maier W, Luckhaus C, Rüther E, Hüll M, Jahn H, Gertz HJ, Frölich L, Hampel H, Pernetzki R. Evolution of Abeta42 and Abeta40 levels and Abeta42/Abeta40 ratio in plasma during progression of Alzheimer's disease: a multicenter assessment. J Nutr Health Aging. 2009;13:205–8. doi: 10.1007/s12603-009-0059-0. [DOI] [PubMed] [Google Scholar]
- 24.Jiang Q, Lee CY, Mandrekar S, Wilkinson B, Cramer P, Zelcer N, Mann K, Lamb B, Willson TM, Collins JL, Richardson JC, Smith JD, Comery TA, Riddell D, Holtzman DM, Tontonoz P, Landreth GE. ApoE promotes the proteolytic degradation of Abeta. Neuron. 2008;58:681–93. doi: 10.1016/j.neuron.2008.04.010. [DOI] [PMC free article] [PubMed] [Google Scholar]
- 25.Reale M, Patruno A, De Lutiis MA, Pesce M, Felaco M, Di Giannantonio M, Di Nicola M, Grilli A. Dysregulation of chemo-cytokine production in schizophrenic patients versus healthy controls. BMC Neurosci. 2011;12:13. doi: 10.1186/1471-2202-12-13. [DOI] [PMC free article] [PubMed] [Google Scholar]
- 26.Zuliani G, Ranzini M, Guerra G, Rossi L, Munari MR, Zurlo A, Volpato S, Atti AR, Ble A, Fellin R. Plasma cytokine profile in older subjects with late onset Alzheimer's disease or vascular dementia. J Psychiatric Res. 2007;41:686–93. doi: 10.1016/j.jpsychires.2006.02.008. [DOI] [PubMed] [Google Scholar]
- 27.Di Bona D, Plaia A, Vasto S, Cavallone L, Lescai F, Franceschi C, Licastro F, Colonna-Romano G, Lio D, Candore G, Caruso C. Association between the interleukin-1beta polymorphisms and Alzheimer's disease: a systematic review and meta-analysis. Brain Res Rev. 2008;59:155–63. doi: 10.1016/j.brainresrev.2008.07.003. [DOI] [PubMed] [Google Scholar]
- 28.Di Rosa M, Dell'Ombra N, Zambito AM, Malaguarnera M, Nicoletti F, Malaguarnera L. Chitotriosidase and inflammatory mediator levels in Alzheimer's disease and cerebrovascular dementia. Eur J Neurosci. 2006;23:2648–56. doi: 10.1111/j.1460-9568.2006.04780.x. [DOI] [PubMed] [Google Scholar]
- 29.Bossu P, Ciaramella A, Moro ML, Bellincampi L, Bernardini S, Federici G, Trequattrini A, Macciardi F, Spoletini I, Di Iulio F, Caltagirone C, Spalletta G. Interleukin 18 gene polymorphisms predict risk and outcome of Alzheimer's disease. J Neurol Neurosurg Psychiatry. 2007;78:807–11. doi: 10.1136/jnnp.2006.103242. [DOI] [PMC free article] [PubMed] [Google Scholar]
- 30.Reale M, Iarlori C, Gambi F, Feliciani C, Salone A, Toma L, DeLuca G, Salvatore M, Conti P, Gambi D. Treatment with an acetylcholinesterase inhibitor in Alzheimer patients modulates the expression and production of the pro-inflammatory and anti-inflammatory cytokines. J Neuroimmunol. 2004;148:162–71. doi: 10.1016/j.jneuroim.2003.11.003. [DOI] [PubMed] [Google Scholar]
- 31.Reale M, Greig NH, Kamal MA. Peripheral chemo-cytoines profiles in alzheimer's and Parkinson's disease. Mini-Reviews Med Chem. 2009;9:1229–41. doi: 10.2174/138955709789055199. [DOI] [PMC free article] [PubMed] [Google Scholar]
- 32.Dinarello CA. Interleukin-18, a proinflammatory cytokine. Eur Cytokine Netw. 2000;11:483–6. [PubMed] [Google Scholar]
- 33.Dinarello CA. Interleukin 1 and interleukin 18 as mediators of inflammation and the aging process. Am J Clin Nutr. 2006;83:447S–455S. doi: 10.1093/ajcn/83.2.447S. [DOI] [PubMed] [Google Scholar]
- 34.Dinarello CA. Interleukin-18 and the pathogenesis of inflammatory diseases. Semin Nephrol. 2007;27:98–114. doi: 10.1016/j.semnephrol.2006.09.013. [DOI] [PubMed] [Google Scholar]
- 35.Nakanishi KA, Yoshimoto T, Tsutsui H, Okamura H. Interleukin-18 regulates both Th1 and Th2 responses. Annu Rev Immunol. 2001;19:423–74. doi: 10.1146/annurev.immunol.19.1.423. [DOI] [PubMed] [Google Scholar]
- 36.Puren AJ, Fantuzzi G, Gu Y, Su MS, Dinarello CA. Interleukin-18 (IFNgamma-inducing factor) induces IL-8 and IL-1beta via TNF-alpha production from non-CD14+ human blood mononuclear cells. J Clin Invest. 1998;101:711–21. doi: 10.1172/JCI1379. [DOI] [PMC free article] [PubMed] [Google Scholar]
- 37.Arend WP, Palmer G, Gabay C. IL-1, IL-18, and IL-33 families of cytokines. Immunol Rev. 2008;223:20–38. doi: 10.1111/j.1600-065X.2008.00624.x. [DOI] [PubMed] [Google Scholar]
- 38.Frohman EM, Frohman TC, Gupta S, de Fougerolles A, van den Noort S. Expression of intercellular adhesion molecule 1 (ICAM-1) in Alzheimer's disease. J Neurol Sci. 1991;106:105–11. doi: 10.1016/0022-510x(91)90202-i. [DOI] [PubMed] [Google Scholar]
- 39.Akiyama H, Barger S, Barnum S, Bradt B, Bauer J, Cole GM, Cooper NR, Eikelenboom P, Emmerling M, Fiebich BL, Finch CE, Frautschy S, Griffin WS, Hampel H, Hull M, Landreth G, Lue L, Mrak R, Mackenzie IR, McGeer PL, O'Banion MK, Pachter J, Pasinetti G, Plata-Salaman C, Rogers J, Rydel R, Shen Y, Streit W, Strohmeyer R, Tooyoma I, Van Muiswinkel FL, Veerhuis R, Walker D, Webster S, Wegrzyniak B, Wenk G, Wyss-Coray T. Inflammation in Alzheimer's disease. Neurobiol Aging. 2000;21:383–421. doi: 10.1016/s0197-4580(00)00124-x. [DOI] [PMC free article] [PubMed] [Google Scholar]
- 40.Merendino RA, Di Pasquale G, Sturniolo GC, Ruello A, Albanese V, Minciullo PL, Di Mauro S, Gangemi S. Relationship between IL-18 and sICAM-1 serum levels in patients affected by coeliac disease: preliminary considerations. Immunol Lett. 2003;85:257–60. doi: 10.1016/s0165-2478(02)00243-2. [DOI] [PubMed] [Google Scholar]
- 41.Perejaslov A, Chooklin S, Bihalskyy I. Implication of interleukin 18 and intercellular adhesion molecule (ICAM)-1 in acute pancreatitis. Hepatogastroenterology. 2008;55:1806–13. [PubMed] [Google Scholar]
- 42.Takahashi HK, Iwagaki H, Yoshino T, Yoshino T, Mori S, Morichika T, Itoh H, Yokoyama M, Kubo S, Kondo E, Akagi T, Tanaka N, Nishibori M. Prostaglandin E2 inhibits IL-18-induced ICAM-1 and B7.2 expression through EP2/EP4 receptor in human peripheral blood mononuclear cells. J Immunol. 2002;168:4446–4554. doi: 10.4049/jimmunol.168.9.4446. [DOI] [PubMed] [Google Scholar]
- 43.Lee SJ, Drabik K, Van Wagoner NJ, Lee S, Choi C, Dong Y, Benveniste EN. ICAM-1-induced expression of proinflammatory cytokines in astrocytes: involvement of extracellular signal-regulated kinase and p38 mitogen-activated protein kinase pathways. J Immunol. 2000;165:4658–66. doi: 10.4049/jimmunol.165.8.4658. [DOI] [PubMed] [Google Scholar]
- 44.Miller DW. Immunobiology of the blood-brain barrier. J Neurovirol. 1999;5:570–8. doi: 10.3109/13550289909021286. [DOI] [PubMed] [Google Scholar]
- 45.Reale M, Iarlori C, Gambi F, Feliciani C, Isabella L, Gambi D. The acetylcholinesterase inhibitor, Donepezil, regulates a Th2 bias in Alzheimer's disease patients. Neuropharmacology. 2006;50:606–13. doi: 10.1016/j.neuropharm.2005.11.006. [DOI] [PubMed] [Google Scholar]
- 46.D'Ambrosio D, Iellem A, Colantonio L, Clissi B, Pardi R, Sinigaglia F. Localizzation of Th-cell subsets in inflammation: differential thresholds for extravasion of Th1 and Th2 cells. Immunol Today. 2000;21:183–6. doi: 10.1016/s0167-5699(00)01590-5. [DOI] [PubMed] [Google Scholar]
- 47.Appay V, Rowland-Jones SL. RANTES: a versatile and controversial chemokine. Trends Immunol. 2001;22:83–7. doi: 10.1016/s1471-4906(00)01812-3. [DOI] [PubMed] [Google Scholar]
- 48.Naert G, Rivest S. CC chemokine receptor 2 deficiency aggravates cognitive impairments and amyloid pathology in a transgenic mouse model of Alzheimer's disease. J Neurosci. 2011;31:6208–20. doi: 10.1523/JNEUROSCI.0299-11.2011. [DOI] [PMC free article] [PubMed] [Google Scholar]
- 49.Lahiri DK, Sambamurti K, Bennett DA. Apolipoprotein gene and its interaction with the environmentally driven risk factors: molecular, genetic and epidemiological studies of Alzheimer's disease. Neurobiol Aging. 2004;25:651–60. doi: 10.1016/j.neurobiolaging.2003.12.024. [DOI] [PubMed] [Google Scholar]
- 50.Gafencu AV, Robciuc MR, Fuior E, Zannis VI, Kardassis D, Simionescu M. Inflammatory signaling pathways regulating ApoE gene expression in macrophages. J Biol Chem. 2007;282:21776–85. doi: 10.1074/jbc.M611422200. [DOI] [PubMed] [Google Scholar]
- 51.Finch CE, Morgan TE. Systemic inflammation, infection, ApoE alleles, and Alzheimer disease: a position paper. Curr Alzheimer Res. 2007;4:185–9. doi: 10.2174/156720507780362254. [DOI] [PubMed] [Google Scholar]
- 52.Mehta PD, Pirttila T, Mehta SP, Sersen EA, Aisen PS, Wisniewski HM. Plasma and cerebrospinal fluid levels of amyloid beta proteins 1-40 and 1-42 in Alzheimer disease. Arch Neurol. 2000;57:100–5. doi: 10.1001/archneur.57.1.100. [DOI] [PubMed] [Google Scholar]
- 53.Mayeux R, Honig LS, Tang MX, Manly J, Stern Y, Schupf N, Mehta PD. Plasma Aβ40 and Aβ42 and Alzheimer's disease: relation to age, mortality, and risk. Neurology. 2003;61:1185–90. doi: 10.1212/01.wnl.0000091890.32140.8f. [DOI] [PubMed] [Google Scholar]
- 54.Pesaresi M, Lovati C, Bertora P, Mailland E, Galimberti D, Scarpini E, Quadri P, Forloni G, Mariani C. Plasma levels of beta-amyloid (1–42) in Alzheimer's disease and mild cognitive impairment. Neurobiol Aging. 2006;27:904–5. doi: 10.1016/j.neurobiolaging.2006.03.004. [DOI] [PubMed] [Google Scholar]
- 55.Tamaoka A, Fukushima T, Sawamura N, Ishikawa K, Oguni E, Komatsuzaki Y, Shoji S. Amyloid beta protein in plasma from patients with sporadic Alzheimer's disease. J Neurol Sci. 1996;141:65–8. doi: 10.1016/0022-510x(96)00143-8. [DOI] [PubMed] [Google Scholar]
- 56.Frankfort SV, van Campen JPCM, Tulner LR, Beijnen JH. Serum amyloid beta peptides in patients with dementia and age-matched non-demented controls as detected by surface-enhanced laser desorption ionisation-time of flight mass spectrometry (SELDI-TOF MS) Curr Clin Pharmacol. 2008;3:144–52. doi: 10.2174/157488408785747665. [DOI] [PubMed] [Google Scholar]
- 57.Ertekin-Taner N, Younkin LH, Yager DM, Parfitt F, Baker MC, Asthana S, Hutton ML, Younkin SG, Graff-Radford NR. Plasma amyloid beta protein is elevated in late-onset Alzheimer disease families. Neurology. 2008;70:596–606. doi: 10.1212/01.WNL.0000278386.00035.21. [DOI] [PubMed] [Google Scholar]
- 58.Graff-Radford NR, Crook JE, Lucas J, Boeve BF, Knopman DS, Ivnik RJ, Smith GE, Younkin LH, Petersen RC, Younkin SG. Association of low plasma Abeta42/Abeta40 ratios with increased imminent risk for mild cognitive impairment and Alzheimer disease. Arch Neurol. 2007;64:354–62. doi: 10.1001/archneur.64.3.354. [DOI] [PubMed] [Google Scholar]
- 59.Chen M, Inestrosa NCK, Ross GS, Fernandez HL. Platelets are the primary source of Aβ peptide in human blood. Biochem Biophys Res Comm. 1995;2139:6–103. doi: 10.1006/bbrc.1995.2103. [DOI] [PubMed] [Google Scholar]
- 60.Evin G, Zhu A, Holsinger D, Masters CL, Li QX. Proteolytic processing of the Alzheimer's Disease amyloid precursor protein in brain and platelets. J Neurosci Res. 2003;74:386–92. doi: 10.1002/jnr.10745. [DOI] [PubMed] [Google Scholar]
- 61.Beher D, Wrigley JD, Owens AP, Shearman MS. Generation of C- terminally truncated amyloid-beta peptides is dependent on gamma-secretase activity. J Neurochem. 2002;82:563–75. doi: 10.1046/j.1471-4159.2002.00985.x. [DOI] [PubMed] [Google Scholar]
- 62.Deane R, Zlokovic BV. Role of the blood-brain barrier in the pathogenesis of Alzheimer's disease. Curr Alzheimer Res. 2007;4:191–7. doi: 10.2174/156720507780362245. [DOI] [PubMed] [Google Scholar]
- 63.Eglitis MA, Mezey E. Hematopoietic cells differentiate into both microglia and macroglia in the brains of adult mice. Proc Natl Acad Sci USA. 1997;94:4080–5. doi: 10.1073/pnas.94.8.4080. [DOI] [PMC free article] [PubMed] [Google Scholar]
- 64.Giri R, Selvaraj SK, Kalra VK. Amyloid Peptide-Induced Cytokine and Chemokine Expression in THP-1 Monocytes Is Blocked by Small Inhibitory RNA Duplexes for Early Growth Response-1 Messenger RNA. J Immunol. 2003;170:5281–94. doi: 10.4049/jimmunol.170.10.5281. [DOI] [PubMed] [Google Scholar]
- 65.Smits HA, van Beelen AJ, de Vos NM, Rijsmus A, van der BT, Verhoef J, van Muiswinkel FL, Nottet HS. Activation of human macrophages by amyloid-β is attenuated by astrocytes. J Immunol. 2001;166:6869–76. doi: 10.4049/jimmunol.166.11.6869. [DOI] [PubMed] [Google Scholar]
- 66.Lindberg C, Chromek M, Ahrengart L, Brauner A, Schultzberg M, Garlind A. Soluble interleukin-1 receptor type II, IL-18 and caspase-1 in mild cognitive impairment and severe Alzheimer's disease. Neurochem Int. 2005;46:551–7. doi: 10.1016/j.neuint.2005.01.004. [DOI] [PubMed] [Google Scholar]