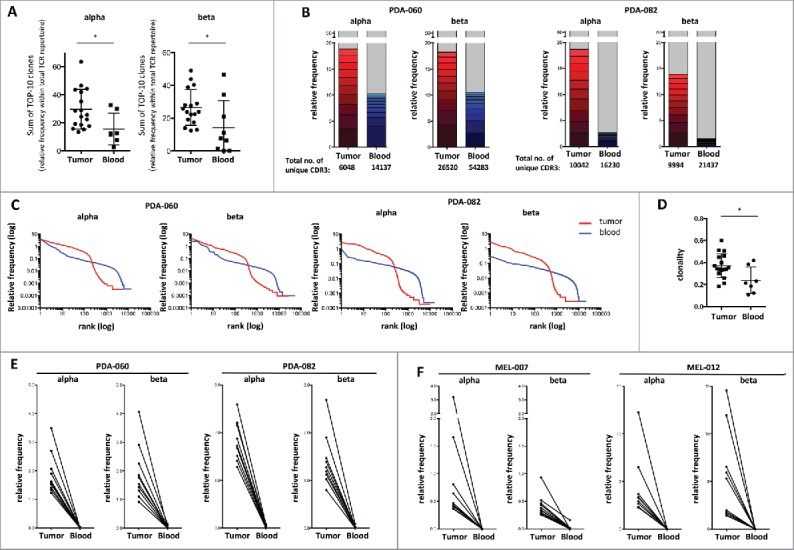
Figure 3.

Evidence of highly enriched T-cell clones in PDA and melanoma on basis of TCR deep-sequencing. (A) Sum of the 10 largest clones/unique CDR3 sequences (relative frequency) identified in tumor (n = 17) and blood samples (n = 7) of PDAC patients by deep-sequencing of TCR-α and -β chains. (B) Relative frequency of the 10 largest clones (detected by TCR-α and -β chain sequencing) in tumor (red) and blood (blue) samples of two representative PDA patients versus all remaining clones (gray), where 100% represents the total number of CDR3 reads as given below the bars. (C) All unique CDR3 sequences detected in tumor (red) or blood (blue) of the two aforementioned PDA patients sorted according to their frequency within the sample, showing that larger clones (left) dominate in tumor, whereas smaller clones dominate in the blood (right). (D) Clonality of the TCR-β repertoire in tumor (n = 17) and blood (n = 5) of PDA patients, showing lower TCR diversity in tumor-infiltrating T-cells. Values can range from 0 (maximum diversity) to 1 (minimal diversity). (E) Size of the 10 largest TCR clones (TCR-α and -β sequencing) detected in the tumor of the two aforementioned PDA patients in tumor vs. blood. (E) Size of the 10 largest TCR clones (TCR-α and -β sequencing) detected in the tumor of two representative melanoma patients in tumor versus blood (n = 7 tumor and n = 5 blood samples were analyzed).
