

Summary
The purpose of this systematic review and meta‐analysis was to estimate the prevalence of personal weight control attempts (weight loss and/or maintenance) worldwide and to identify correlates, personal strategies used and the underlying motives. We included epidemiological/observational studies of adults (≥18 years) reporting prevalence of weight control attempts in the past‐year. Seventy‐two studies (n = 1,184,942) met eligibility criteria. Results from high quality studies showed that 42% of adults from general populations and 44% of adults from ethnic‐minority populations reported trying to lose weight, and 23% of adults from general populations reported trying to maintain weight annually. In general population studies, higher prevalence of weight loss attempts was observed in the decade of 2000–2009 (48.2%), in Europe/Central Asia (61.3%) and in overweight/obese individuals and in women (p < 0.01). Of the 37 strategies (grouped in 10 domains of the Oxford Food and Activity Behaviours Taxonomy) and 12 motives reported for trying to control weight, exercising and dieting (within the energy compensation and restraint domains, respectively) and wellbeing and long‐term health were the most prevalent. To our knowledge, this is the first systematic review to investigate weight control attempts worldwide. Key strategies and motives were identified which have implications for future public health initiatives on weight control.
Keywords: Maintenance, motives, strategies, weight loss
Introduction
The causes of obesity are complex and multifaceted. Obesity control interventions usually focus on a combination of physical and dietary aspects of social, economic and cultural environments together with individual approaches 1, 2. Personal weight control efforts (i.e. intentionally trying to lose or maintain weight) are of particular relevance for public health as they reflect an active investment of the population and provide an opportunity to guide individuals to evidence‐based weight control approaches.
In other areas of public health (e.g. smoking cessation), a focus on personal behaviour change attempts (e.g. quit smoking) has been key to understanding and enhancing effects of public health strategies 3. The relationship between personal weight loss attempts and obesity is complex, and well‐informed attempts to lose weight (e.g. those utilizing evidence‐based weight loss strategies) may result in better weight loss and maintenance 1, 4. However, there is also consistent evidence that amongst obese adults the number of weight loss attempts is a negative predictor of success in weight loss interventions 5. Recurrent weight control efforts may negatively impact on self‐concept, body image, pessimistic attributions and feelings of helplessness, all of which could predispose individuals to failure 6, 7. Therefore, it is important to understand how many weight control attempts are made, by whom, how and why, in order to provide a clearer knowledge base about what people seeking weight control are currently doing (and why) and inform public health policies and interventions regarding changes that need to occur in weight loss/maintenance attempts to improve population outcomes.
This systematic review and meta‐analysis aimed to (i) synthesize the available epidemiological data on the prevalence of weight control (weight loss and weight maintenance) attempts among adults worldwide; (ii) provide a comprehensive description of the personal strategies used and (iii) describe the motives behind those attempts. To our knowledge, this is the first study providing such a perspective.
Methods
This systematic review and meta‐analysis is reported in accordance with The Joanna Briggs Institute Reviewers' Manual 2014 for systematic reviews of prevalence and incidence data 8. Methodological aspects of this review were specified in advance and documented in a protocol (PROSPERO registration number: CRD42014010572).
Eligibility criteria
Studies were selected for this review if they were population‐based epidemiological/observational studies that included samples of adults (≥18 years old). To be eligible, studies should also include a question on the prevalence of weight control (loss and/or maintenance ) attempts within a 12‐month period preceding the survey (e.g. ‘Are you currently trying to lose weight?’, ‘Have you tried to lose weight in the past 6 months?’, ‘Have you tried to lose weight in the last year?’, ‘Are you now trying to maintain your weight, that is, to keep from gaining weight?’, ‘Have you tried to keep from gaining weight during the previous 12 months?’). Past year prevalence was chosen instead of ever prevalence because it has a greater potential to reflect changing patterns over time and capture differences (e.g. between geographical regions). Studies of pregnant women (or women within 1‐year postpartum), athletes and populations with specific health conditions, disabilities or mental disorders were excluded.
Search strategy and study selection
A comprehensive search of peer‐reviewed articles was conducted in three electronic databases: PubMed, PsycInfo and Web of Science (all articles published until December 2015). Searches included various combinations of the following terms: weight control, weight loss, weight maintenance, diet, attempts, prevalence, strategies, practices, determinants and motives (Full search strategy is available from the authors upon request). The search was limited to studies with participants aged 18 years and older. There were no restrictions regarding the language of publication. Additionally, manual cross‐referencing of retrieved articles and hand‐searches of key scientific journals (e.g. International Journal of Public Health, American Journal of Preventive Medicine) were performed.
Potentially eligible studies were independently identified by two authors (IS, EVC), based on titles, abstracts and references. Duplicate entries were removed. Relevant articles were then retrieved for a full‐text review. The same two researchers independently reviewed the full‐text of potential studies and discrepancies were resolved by consensus. Endnote® X7 for Mac® OS X® was used to manage the references.
Methodological quality
The methodological quality of included studies was assessed using a standardized form based on a short version of The Joanna Briggs Institute critical appraisal checklist for studies reporting prevalence data 8, consisting of a five‐category tool addressing critical issues of internal and external validity of prevalence data, including (i) representativeness of the sample; (ii) appropriate recruitment of study participants; (iii) adequacy of sample size; (iv) non‐response and refusals and (v) use of a standard criteria for the measurement of the condition. For each study, each category of the checklist was classified as Yes, No, Unclear or Not applicable. No corresponds to a limitation in the respective methodological category. Two of three researches (IS, MM and EVC) independently assessed the methodological quality of each study and discussed the results of their critical appraisals. Disagreements were resolved by consensus.
Data extraction
The Joanna Briggs Institute data extraction form for prevalence and incidence studies 8 was used to extract relevant information. Data extraction included information about (i) study details (authors, year, publication journal); (ii) study methods (design, mode of data collection, year of survey, geographical region, setting); (iii) subject characteristics (sample size, age, gender, percentage of overweight/obesity, response rate) and (iv) outcomes of interest (prevalence of weight loss and maintenance attempts, strategies used and motives reported by those trying to control their weight).
Data synthesis and statistical analyses
We conducted separate meta‐analyses for the prevalence of weight loss and weight maintenance attempts in (i) general populations and (ii) ethnic‐minority populations.
Analyses were conducted using the Comprehensive Meta‐Analysis Software version 2.2 9. Meta‐analyses were conducted using random‐effects models, in which the summary effect is an estimate of the mean of a distribution of effect sizes 10. Pooled effects were the prevalence estimates of weight loss and maintenance attempts (represented as event rate plus confidence intervals). To evaluate the amount of variation in the effects of included studies, we inspected for heterogeneity using: (i) the Cochran's Q statistic 11, for which a significant p‐value (<0.05) demonstrates that studies do not share a common effect size (i.e. there is heterogeneity in the effect sizes between studies); and (ii) I 2 statistic 12 that assesses the proportion of observed dispersion that is because of real differences in the actual effect sizes (rather than sampling error). The I 2 ranges from 0 to 100%, where a value of 0% indicates no observed heterogeneity and values of 25%, 50% and 75% reflect low, moderate and high heterogeneity, respectively.
Subgroup analyses were conducted to examine whether prevalence estimates varied according to the decade of the survey (1970–1979, 1980–1989, 1990–1999, 2000–2009 and 2010–2015) and the geographic region where the survey took place (coded according with the World Bank Atlas as Africa, East Asia and Pacific, Europe and Central Asia, Latin America and the Caribbean, Middle East and North Africa, North America and South Asia). These subgroup analyses were conducted using mixed‐effect models (i.e. random‐effects model is conducted within subgroups and a fixed effect model was used across subgroups) 10. Between‐groups Q statistic and corresponding p‐values were used to compare the mean effect across subgroups. Further, meta‐regressions using mixed‐effects models were conducted to analyse the moderation effect of the following continuous variables: (i) percentage of overweight and obese individuals in the sample; (ii) percentage of women in the sample and (iii) mean age of the sample. Meta‐regressions were conducted when there were at least 10 studies/analyses and were analysed based on the Z‐value and associated p‐value of the slope 10. Because of the limited number of studies reporting the prevalence of weight maintenance attempts, we only conducted moderator analyses for the prevalence of weight loss attempts.
Some studies did not provide separated prevalence rates of weight loss and maintenance attempts and did not include sufficient data (e.g. mean age) for subgroup analyses and meta‐regression. Therefore, the number of studies included in moderation analyses varies.
Personal weight control strategies and motives reported by those trying to control their weight in the past year were qualitatively synthetized and presented in tabular form. Personal weight control strategies were independently classified within the domains of the Oxford Food and Activity Behaviours (OxFAB) Taxonomy 13 by two of three researchers (IS, MM and EVC) and discrepancies were resolved by consensus. This taxonomy was chosen because it is a comprehensive tool to systematically describe the cognitive and behavioural strategies used by individuals for weight management 13. Only the domains where at least one strategy fell on were shown. Two additional domains were included – dietary choices and extreme strategies – as some of the reported strategies did not fit within any existing domain. Likewise, some strategies seemed to fit in more than one domain; nevertheless, we have selected the one that appeared more appropriate. Weight control motives were independently extracted by two of three researchers (IS, MM and EVC).
Sensitivity analyses
Sensitivity analyses were carried out to explore if overall results were affected by methodological quality. Primary analyses were repeated excluding studies presenting methodological limitations in either and in all (cumulative) categories of the The Joanna Briggs Institute critical appraisal checklist for studies reporting prevalence data 8. Moderation analyses were also repeated excluding all studies presenting methodological limitations.
Publication bias was examined by (i) visual inspection of funnel plot and asymmetry and (ii) Egger's test 14 to confirm the visual impression.
Results
The literature search yielded a total of 9,759 records. Sixteen articles identified through manual searches and cross‐referencing were added, leading to a total of 9,775 potential articles (Fig. 1). After duplicate removal (n = 3,818), 5,957 articles were assessed for eligibility. Of these, 5,781 were excluded based on title/abstract screening, leaving 176 eligible for full‐text screening. Seventy‐two articles with a total sample size of 1,184,942 met eligible criteria and were included.
Figure 1.

Flow diagram of studies.
Study and sample characteristics
Characteristics of included studies are summarized in Table 1. Sixty studies were conducted within general populations and 12 within ethnic‐minority populations. Most studies had a cross‐sectional design (k = 67), and the remaining five studies were prospective cohorts. Surveys were conducted between 1975 and 2013 across 40 countries within five continents, and data was collected via in‐person/self‐administered (k = 41), telephone (k = 17), mail (k = 11) and online (k = 3) surveys. Sixty‐two studies included mixed‐gender samples, nine included only women and one study was conducted only with men. Eleven studies targeted overweight and obese individuals only. Sample sizes in the studies ranged from 123 to 170,971 participants and response rates from 24% to 97.7%.
Table 1.
Studies on the prevalence of weight control attempts sorted by country
| Prevalence of weight control attempts (%) | ||||||||||||
|---|---|---|---|---|---|---|---|---|---|---|---|---|
| Reference | Study design | Data collection | Year of survey | Population | Sample size/% women | Age (range; mean ± SD (years)) | %Overweight1/Obesity2 | Trying to lose | Trying to maintain4 | Total | Response rate (%) | Methodological limitations (categories) |
| (a) | ||||||||||||
| 15 | PCS | MS | 1993 | Australia reg. | n = 1,342/50.4 | ≥18; — | 38.2/15.9 | 20.4 | 22.2 | 42.6 | 67.8 | — |
| 16 | CSS | MS | 1997 | Australia reg. | n = 900/57.9 | ≥18; 44.7 ± 16.5 | 30.0/12.7 | 22.9* | 26.3* | 49.2* | 41.6 | 3 |
| 17 | CSS | IS | 2004 | Australia spec.a | n = 1,973/58.0 | ≥18; — | 33.4/23.2 | 37.0 | — | — | — | 4 |
| 18 | PCS | MS | 2007–2008 | Australia spec.b | n = 1,634/100 | 18–46; 36.5 ± 7.6 | — | 39.1 | 29.9 | 69.0 | 45.0 | 3, 4 |
| 19 | CSS | OS | 2010–2011 | Australia spec.a | n = 1,335/60.9 | ≥18; — | 35.4/22.8 | 50.0 | — | — | 85.0 | 1, 3 |
| 20 | CSS | IS/MS | — | Australia spec.c | n = 994/54.0 | ≥18, — | 28.4/8.4 | 46.9 | — | — | 65.4 | 4 |
| 21 | CSS | IS | 2013 | Bangladesh spec.d | n = 649/— | 16–30; 20.8 ± 2.8 | 34.23 | 32.1*** | — | — | — | 1, 3 |
| 21 | CSS | IS | 2013 | Barbados spec.d | n = 577/— | 16–30; 20.8 ± 2.8 | 40.03 | 11.4*** | — | — | — | 1, 3 |
| 22 | CSS | MS | 2001 | Belgium nat. | n = 2,591/62.6 | 18–74; — | 23.4/9.8 | — | — | 46.4 | — | — |
| 23 | CSS | IS | 2010 | Brazil reg. | n = 2,732/57.9 | ≥20; 46.1 ± 17.0 | 36.3/26.0 | 26.6* | — | — | 89.3 | — |
| 24 | CSS | IS | 1986–1992 | Canada nat. | n = 17,564/50.9 | 18–74; — | 34.3/15.4 | 32.6* | — | — | 66.5 | — |
| 25 | CSS | OS | 2008 | Canada spec.d | n = 3,069/74.8 | —; 27.9 ± 10.2 | 25.63 | 33.3 | — | — | — | 1, 2, 3, 4 |
| 21 | CSS | IS | 2013 | Colombia spec.d | n = 810/— | 16–30; 20.8 ± 2.8 | 25.53 | 18.8*** | — | — | — | 1, 3 |
| 21 | CSS | IS | 2013 | Egypt spec.d | n = 696/— | 16–30; 20.8 ± 2.8 | 41.63 | 20.5*** | — | — | — | 1, 3 |
| 26 | CSS | IS | 1997–1998/2002 | England nat. | n = 9,098/48.1 | 25–60; — | 1003 | 66.5* | — | — | — | — |
| 27 | PCS | MS | 1975 | Finland nat. | n = 7,729/54.3 | 18–54; — | — | 18.6* | — | — | 89.0 | 4 |
| 28 | CSS | IS | 1990–1991 | France spec.d | n = 656/55.6 | 18–30; 21.4 ± 2.5 | 1.8/0.3 | 23.8 | — | — | 82.0 | 1, 2, 3, 4 |
| 29 | CSS | IS | 1999 | Great Britain nat. | n = 1,894/50.5 | —; 45.8 ± 18.2 | 32.3/10.8 | 28.5 | 36.4 | 64.9 | 70.0 | 4 |
| 30 | CSS | IS | 2012 | Great Britain nat. | n = 810/46.7 | 16–90; 51.3 ± 17.9 | 65.2/34.8 | 45.0 | — | — | — | — |
| 21 | CSS | IS | 2013 | India spec.d | n = 800/— | 16–30; 20.8 ± 2.8 | 36.83 | 16.4*** | — | — | — | 1, 3 |
| 22 | CSS | MS | 2001 | Italy nat. | n = 1,062/42.4 | 18–74; — | 29.2/6.8 | — | — | 46.5 | — | — |
| 21 | CSS | IS | 2013 | Ivory Coast spec.d | n = 777/— | 16–30; 20.8 ± 2.8 | 11.73 | 18.1*** | — | — | — | 1, 3 |
| 21 | CSS | IS | 2013 | Jamaica spec.d | n = 675/— | 16–30; 20.8 ± 2.8 | 27.93 | 14.3*** | — | — | — | 1, 3 |
| 31 | CSS | IS | 1998 | Japan spec.e | n = 146/0 | 30–65; 47.5 ± 9.3 | 30.83 | 32.2 | — | — | 80.1 | 1, 2, 3, 4 |
| 21 | CSS | IS | 2013 | Kyrgyzstan spec.d | n = 814/— | 16–30; 20.8 ± 2.8 | 9.23 | 23.1*** | — | — | — | 1, 3 |
| 21 | CSS | IS | 2013 | Laos spec.d | n = 759/— | 16–30; 20.8 ± 2.8 | 20.63 | 9.5*** | — | — | — | 1, 3 |
| 32 | CSS | IS | 2001 | Lebanon spec.d | n = 2,013/60.0 | —; 21.0 ± 2.4 | 18.03 | 30.0 | — | — | 90.0 | 1, 3 |
| 21 | CSS | IS | 2013 | Madagascar spec.d | n = 780/— | 16–30; 20.8 ± 2.8 | 5.13 | 21.6*** | — | — | — | 1, 3 |
| 33 | CSS | IS | 2009 | Malaysia spec.e | n = 233/55.4 | 18–60; 32.5 ± 10.5 | 29.6/20.6 | 73.8 | — | — | 70.6 | 4 |
| 34 | CSS | IS | — | Malaysia spec.f | n = 1,032/62.8 | ≥18; — | — | 24.5 | — | — | — | 1, 2, 3, 4 |
| 21 | CSS | IS | 2013 | Mauritius spec.d | n = 461/— | 16–30; 20.8 ± 2.8 | 13.03 | 16.4*** | — | — | — | 1, 3 |
| 35 | CSS | IS | 2004 | Mexico spec.d | n = 2,651/62.0 | 17–45; 20.2 ± 2.6 | 28.93 | 38.8 | — | — | — | 1, 3, 4 |
| 21 | CSS | IS | 2013 | Namibia spec.d | n = 466/— | 16–30; 20.8 ± 2.8 | 19.33 | 16.4*** | — | — | — | 1, 3 |
| 36 | CSS | MS | 2009 | New Zealand nat. | n = 1,601/100 | 40–50; 45.5 ± 3.2 | 29.4/20.7 | 39.4 | 42.1 | 81.5 | 65.8 | — |
| 21 | CSS | IS | 2013 | Nigeria spec.d | n = 800/— | 16–30; 20.8 ± 2.8 | 13.33 | 12.7*** | — | — | — | 1, 3 |
| 37 | PCS | MS | 1997 | Norway nat. | n = 10,025/100 | 45–59; — | 31.0/8.0 | 51.6 | — | — | 51.2 | 2 |
| 21 | CSS | IS | 2013 | Pakistan spec.d | n = 761/— | 16–30; 20.8 ± 2.8 | 15.03 | 27.7 | — | — | — | 1, 3 |
| 21 | CSS | IS | 2013 | Philippines spec.d | n = 769/— | 16–30; 20.8 ± 2.8 | 22.53 | 24.5*** | — | — | — | 1, 3 |
| 22 | CSS | MS | 2001 | Portugal nat. | n = 1,313/55.4 | 18–74; — | 32.9/9.3 | — | — | 37.0 | — | — |
| 38 | CSS | TS | 2012 | Portugal nat. | n = 1,098/48.5 | 18–65; 40.1 ± 13.3 | 34.0/10.8 | 24.3 | 19.4 | 43.7 | 57.9 | — |
| 21 | CSS | IS | 2013 | Russia spec.d | n = 785/— | 16–30; 20.8 ± 2.8 | 17.03 | 22.0*** | — | — | — | 1, 3 |
| 21 | CSS | IS | 2013 | Singapore spec.d | n = 678/— | 16–30; 20.8 ± 2.8 | 22.13 | 26.8*** | — | — | — | 1, 3 |
| 21 | CSS | IS | 2013 | South Africa spec.d | n = 749/— | 16–30; 20.8 ± 2.8 | 30.73 | 15.3*** | — | — | — | 1, 3 |
| 22 | CSS | MS | 2001 | Spain nat. | n = 3,543/52.6 | 18–74; — | 33.5/11.6 | — | — | 43.3 | — | — |
| 39 | CSS | IS | 2012 | Thailand spec.d | n = 860/72.7 | 18–25; 20.1 ± 1.3 | 7.8/13.0 | 42.5 | — | — | 97.3 | 1, 3 |
| 21 | CSS | IS | 2013 | Thailand spec.d | n = 785/— | 16–30; 20.8 ± 2.8 | 20.83 | 29.0*** | — | — | — | 1, 3 |
| 21 | CSS | IS | 2013 | Tunisia spec.d | n = 961/— | 16–30; 20.8 ± 2.8 | 26.33 | 23.8*** | — | — | — | 1, 3 |
| 21 | CSS | IS | 2013 | Turkey spec.d | n = 795/— | 16–30; 20.8 ± 2.8 | 18.73 | 22.5*** | — | — | — | 1, 3 |
| 40 | CSS | MS | 1985Ŧ | US nat. | n = 170,971/52.8 | ≥18; — | 23.93 | 35.0 | — | — | — | — |
| 41 | CSS | TS | 1985–1988ŦŦ | US nat. | n =117,827/50.8 | ≥18; — | 20.03 | 38.6* | — | — | — | — |
| 42 | CSS | IS | 1987–1988 | US spec.e | n = 4,647/54.7 | ≥18; 37.9 ± 0.21 | — | 19.7 | — | — | 75.0 | 1, 3 |
| 43 | CSS | IS | 1988–1994ŦŦŦ | US nat. | n = 13,092/51.9 | ≥20; 45.7 ± 0.83 | — | 45.9 | — | — | — | — |
| 44 | CSS | TS | 1989ŦŦ | US nat. | n = 64,637/56.6 | ≥18; 45.0 (no SD) | — | 33.5* | 28.2* | 61.7* | 82.0 | — |
| 41 | CSS | TS | 1989/1991–1992 | US nat. | n = 114,025/— | ≥18; — | 23.33 | 33.7* | — | — | — | — |
| 45 | CSS | IS | 1990 | US nat. | n = 31,347/— | ≥25; — | — | 31.7* | — | — | 86.3 | — |
| 46 | CSS | TS | 1991 | US nat. | n = 7,805/— | ≥18; — | — | 19.3 | — | — | 72.0 | — |
| 47 | CSS | TS | 1991 | US reg. | n = 2,072/61.5 | ≥18; — | — | 34.4* | — | — | 82.4 | — |
| 48 | CSS | IS | 1994–1998 | US reg. | n = 123/73.2 | 18–70; — | 67.03 | 48.8 | — | — | 29.0 | — |
| 49 | CSS | TS | 1996ŦŦ | US nat. | n = 107,804/50.4 | ≥18; — | — | 36.4* | 33.7* | 70.1* | — | — |
| 50 | CSS | TS | 1996 | US reg. | n = 3,010/61.0 | ≥18; — | 59.03 | 38.0 | — | — | 60.5 | — |
| 51 | CSS | TS | 1996–1997 | US nat. | n = 1,760/100 | ≥40; — | 52.8/47.2 | 64.8 | — | — | 87.3 | — |
| 52 | CSS | IS | 1997–1998 | US reg. | n = 3,832/62.0 | ≥18; 43.5 ± 15.6 | — | — | — | 52.7 | 66.0 | — |
| 53 | CSS | IS | 1998Ŧ | US nat. | n = 30,433/55.5 | ≥18; — | — | 30.9* | — | — | 73.9 | — |
| 54 | CSS | TS | 1999 | US reg. | n = 1,232/— | ≥20; — | — | 36.1* | 34.1* | 70.2* | — | — |
| 55 | CSS | TS | 1999–2002ŦŦŦ | US nat. | n = 5,608/48.3 | ≥20; 51.5 (no SD) | 53.6/46.4 | 51.2 | — | — | — | — |
| 56 | CSS | TS | 2000ŦŦ | US nat. | n = 164,187/57.6 | ≥18; — | 36.4/20.7 | 39.5* | — | — | 48.9 | — |
| 57 | CSS | IS | 2000Ŧ | US nat. | n = 17,317/52.0 | ≥18; — | 35.0/18.0 | 30.0 | 21.0 | 51.0 | 83.0 | — |
| 58 | CSS | IS | 2001–2002ŦŦŦ | US nat. | n = 4,354/49.3 | ≥20; — | 37.3/30.2 | 40.9 | 10.4 | 51.3 | 81.0 | — |
| 59 | CSS | IS | 2001–2006ŦŦŦ | US nat. | n = 4,021/— | ≥20; — | 0.0/100 | 63.0 | — | — | — | — |
| 60 | CSS | IS | 2002 | US spec.a | n = 210/74.0 | —; 52.0 (no SD) | 8.0/92.0 | 49.8 | — | — | 97.7 | 1, 2, 3, 4 |
| 61 | CSS | IS | 2002–2003 | US spec.d | n = 38,204/65 | 18–25; 20.3 ± 1.71 | 21.0/7.0 | 49.8 | 23.4 | 73.2 | 57.0 | 1, 3, 4 |
| 62 | CSS | MS | 2003 | US nat. | n = 3,771/59.4 | ≥18; — | 35.0/32.5 | 58.0 | — | — | 69.0 | — |
| 63 | CSS | TS | 2003ŦŦ | US nat. | n = 111,456/52.9 | ≥20; 51.8 ± 14.5 | 60.1/39.9 | 55.7 | — | — | — | — |
| 64 | CSS | IS | 2003–2006ŦŦŦ | US nat. | n = 4,784/46.6 | ≥20; 48.1 ± 0.51 | 1003 | 47.4 | — | — | — | — |
| 65 | CSS | IS | 2003–2008ŦŦŦ | US nat. | n = 16,720/51.0 | ≥18; — | 33.5/32.7 | 37.0 | 11.4 | 48.4 | — | — |
| 66 | CSS | IS | 2005 | US spec.e | n = 813/79.0 | 18–65; — | 32.0/35.2 | 62.7 | — | — | 56.0 | 1, 3, 4 |
| 67 | CSS | IS | 2005–2008ŦŦŦ | US nat. | n = 5,474/47.2 | 20–64; — | 47.5/52.5 | 50.2* | — | — | — | — |
| 68 | CSS | IS | 2007–2010ŦŦŦ | US nat. | n = 9,569/51.0 | ≥20; — | 35.0/33.0 | 43.0 | — | — | — | — |
| 69 | CSS | TS/MS | 2008ŦŦŦŦ | US nat. | n = 7,059/50.8 | ≥18; 46.1 (no SD) | 34.4/27.8 | 53.4* | — | — | 31.0 | — |
| 70 | CSS | IS | 2009 | US spec.a | n = 3,949/65.3 | ≥18; 39.9 ± 0.88 | 28.8/47.5 | 60.1** | — | — | 71.0 | 2 |
| 71 | CSS | MS | 2009–2010 | US spec.g | n = 1,510/74.0 | ≥18; — | 26.0/46.0 | 51.0 | — | — | 24.0 | 4 |
| 72 | PCS | MS | 2012ŦŦŦŦ | US nat. | n = 3,407/49.8 | ≥18; — | — | 52.0* | 24.0* | 76.0* | 40.0 | — |
| 73 | CSS | OS | — | US nat. | n = 4,023/100 | 25–45; 35.2 ± 5.9 | — | 67.2 | — | — | — | — |
| 74 | CSS | IS | — | US spec.a | n = 414/66.3 | 19–79; 55.0 ± 15.4 | 0.0/100 | 73.0 | — | — | — | 1, 2, 3, 4 |
| 21 | CSS | IS | 2013 | Venezuela spec.d | n = 444/— | 16–30; 20.8 ± 2.8 | 20.53 | 19.2*** | 1, 3 | |||
| (b) | ||||||||||||
| 75 | CSS | IS | 2001–2003 | Holland reg. | n = 1,441/58.8 | 35–60; 45.4 ± 6.5 | 62.4/24.8 | 38.8* | 12.9* | 51.7* | 60.0 | 1, 3 |
| 76 | CSS | IS | 2002 | Norway, reg. | n = 629/42.3 | 30–60; 42.4 (no SD) | 49.1/15.5 | 27.5* | — | — | 44.0 | — |
| 77 | CSS | TS | 1990 | US reg. | n = 1,445/67 | ≥18; 45.2 ± 18.1 | 43.83 | 66.0** | — | — | 81.1 | — |
| 78 | CSS | IS | 1992–1993 | US reg. | n = 1,143/100 | 24–42; 31.6 ± 3.8 | — | 9.9* | — | — | — | — |
| 79 | CSS | TS | 1994 | US reg. | n = 244/55.7 | ≥18; — | — | 41.9 | — | — | 91.1 | 3 |
| 80 | CSS | IS | 1985 | US spec.e | n = 500/100 | 25–65; 40.6 ± 10.1 | 39.0 | 40.0 | — | — | — | 1, 2, 3, 4 |
| 81 | CSS | TS | 2003 | US spec.h | n = 572/71.2 | ≥18; 53.9 ± 15.7 | — | 49.4 | — | — | 56.8 | 1, 2, 3, 4 |
| 82 | CSS | IS | 2003 | US spec.d | n = 392/69.0 | —; 23.7 ± 5.5 | 28.6/15.6 | 38.3 | — | — | — | 1, 2, 3, 4 |
| 83 | CSS | IS | 2003–2004 | US spec.i | n = 585/49.0 | ≥18; 45.9 (no SD) | 1003 | 58.0 | — | — | — | 1, 2, 3, 4 |
| 84 | CSS | IS | 2009 | US spec.i | n = 413/100 | ≥18; 35.6 ± 14.7 | 25.0/41.0 | 59.0 | — | — | — | 1, 2, 3, 4 |
| 85 | CSS | IS | — | US spec.i | n = 203/100 | 20–64; 33.8 (no SD) | 65.73 | 29.1 | 40.4 | 69.5 | — | 1, 2, 3, 4 |
| 86 | CSS | IS | — | US spec.i | n = 219/58.0 | —; 31.0 (no SD) | 55.53 | 33.3 | 41.1 | 74.4 | — | 1, 2, 3, 4 |
| Sample size weighed mean | 39.1 | 30.3 | 66.6 | |||||||||
| Only (a) | 38.6 | 30.3 | 66.7 | |||||||||
| Only (b) | 41.7 | 19.2 | 56.3 | |||||||||
Overweight plus Obesity.
Or avoid gaining weight.
(a) General population studies.
(b) Ethnic‐minority population studies.
CSS, cross‐sectional survey; IS, in‐person/self‐administered survey; MS, mail survey; OS, online survey; PCS, prospective cohort study; TS, telephone survey.
nat., national representative data; reg., regional representative data; spec., specific setting data.
Patients from Health/Primary Care Centers.
Individuals from low socioeconomic areas.
Individuals from high and low socioeconomic areas.
University students/community.
Workers/employees.
Stationary individuals in a shopping center.
Patients covered by National Healthcare Insurance.
Members of religious congregations.
Members of the community at large.
Estimated percentages based on the data available.
Prevalence reported only for overweight and obese individuals.
Prevalence reported only for underweight and normal weight individuals.
Data from the National Health Interview Survey (NHIS).
Data from the Behavioral Risk Factor Surveillance System (BRFSS).
Data from the National Health and Nutrition Examination Survey (NHANES).
Data from the Health Information National Trends Survey (HINTS).
Sample was not representative.
Participants were not recruited from an appropriate source and/or no random selection was used to recruit them.
No sample size calculation.
No information on non‐response/refusals and/or no comparison between responders and non‐responders was made (if there was oversampling and data was weighed to reflect country/region population estimates, we assumed that non‐response was taken into account).
Limitations of the studies were determined with The Joanna Briggs Institute Critical Appraisal Checklist for Studies Reporting Prevalence Data 8.
Methodological appraisal
Table 1 shows the limitations regarding methodological quality of the included studies. In 22 (general population: 14; ethnic minorities: 8) of the 72 included studies, the population was not representative of the country, region or setting where the studies were conducted (Category 1). In 15 studies (general population: 8; ethnic minorities: 7), participants were not randomly selected and/or were not recruited from an appropriate source (Category 2). Sample size calculation (Category 3) was not performed in 25 studies (general population: 16; ethnic minorities: 9). Furthermore, in 23 studies (general population: 16; ethnic minorities: 7) there was no information on response/refusals rate and/or no comparison between responders and non‐responders (Category 4). All studies presented a standard criterion for the measurement of weight control attempts and therefore none presented limitations in this regard (Category 5).
Prevalence of weight control attempts
Prevalence rates of weight loss and weight maintenance attempts varied widely across studies, ranging from 9.5% 21 to 73.8% 33 and 10.4% 58 to 42.1% 36, respectively (Table 1). Five studies did not report separate prevalence rates of weight loss and maintenance attempts. The overall prevalence of weight control (i.e. loss plus maintenance) attempts ranged between 37% 22 and 81.5% 36.
General population studies
The overall summary prevalence of weight loss and maintenance attempts in general populations was 34.6% (95% CI [32.7%, 36.5%]; Q = 36,355, p < 0.001; I 2 = 99.8%) and 24.7% (95% CI [23.7%, 31.7%]; Q = 5,737, p < 0.001; I 2 = 99.8%), respectively. Sensitivity analysis showed that excluding studies with limitations in categories 1 and 3 led to substantial changes in the overall prevalence estimates of weight loss attempts in general populations: +7.0% (k = 44) and +7.5% (k = 42), respectively. Excluding studies with limitations in categories 2 and 4 led to minimal changes: −0.9% (k = 50) and −1.7% (k = 42), respectively. Figure 2 presents the overall results excluding all studies with limitations in any methodological category. The pooled estimate for the prevalence of weight loss attempts in general populations was 41.5% (95% CI [38.7%, 44.4%]; Q = 27,947, p < 0.001; I 2 = 99.9%; k = 34).
Figure 2.
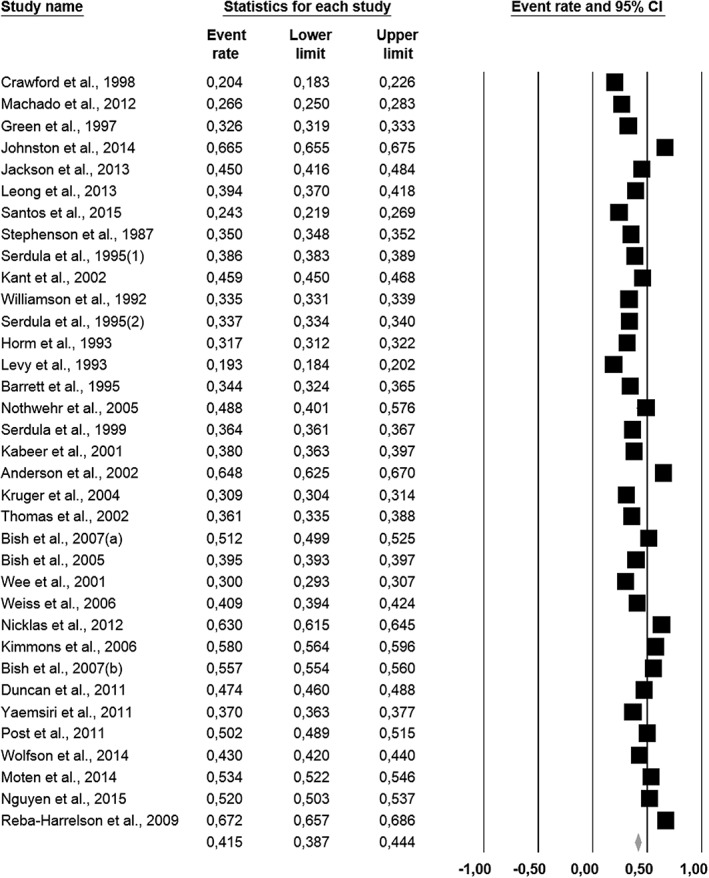
Forest plot for prevalence estimates of weight loss attempts in general populations excluding studies with methodological limitations (k = 34).
For the overall prevalence estimates of weight maintenance attempts in general populations, excluding studies with limitations led to minimal changes (from −1.5% to +0.1%). The combined estimate excluding studies with limitations in any methodological category was 23.2% (95% CI [18.8%, 28.3%]; Q = 4,838, p < 0.001; I 2 = 99.8%; k = 10).
Regarding publication bias, visual inspections of the funnel plots did not show the presence of asymmetry, which was confirmed with Egger's test (all p > 0.05), either for the prevalence of weight loss or maintenance attempts in general populations.
Table 2 presents the results of the subgroup analyses. A clear significant increase in the prevalence of weight loss attempts across decades is observed (from 18.6% to 47.7%, Q = 138.454, p < 0.001), until the decade of 2000–2009. Between 2010 and 2015 the combined prevalence was 24.1%. High heterogeneity and large proportion of dispersion in the prevalence rates was observed within subgroups (I 2 varied between 98.8% and 99.8%). Sensitivity analysis showed that excluding studies with any methodological limitation led to important changes in the overall prevalence estimates of weight loss attempts in the decade of 2010–2015 (increased to 39.7%). For the other decades, changes were small.
Table 2.
Subgroup analysis assessing the effect of pre‐selected moderators on the prevalence of weight loss attempts in general populations
| Moderators | N analyses | Prevalence (%) [95% CI] | Q 1 | p 1 | I 2 (%) |
|---|---|---|---|---|---|
| Decade of survey | 138.454 | <0.001 | |||
| 1970–1979 | 1 | 18.6 [17.7, 19.5] | 0.0 | ||
| 0 | — | — | |||
| 1980–1989 | 4 | 35.8 [35.6, 35.9] | 99.7 | ||
| 3 | 35.9 [35.8, 36.1] | 99.7 | |||
| 1990–1999 | 18 | 34.4 [31.0, 37.9] | 99.6 | ||
| 13 | 35.5 [31.7, 39.4] | 99.6 | |||
| 2000–2009 | 24 | 47.7 [44.4, 50.9] | 99.8 | ||
| 14 | 48.2 [44.2, 52.2] | 99.9 | |||
| 2010–2015 | 29 | 24.1 [21.9, 26.4] | 98.8 | ||
| 4 | 39.7 [38.6, 40.9] | 99.4 | |||
| Geographic region | 108.335 | <0.001 | |||
| Africa | 6 | 16.6 [12.7, 21.4] | 79.5 | ||
| 0 | — | — | |||
| East Asia and Pacific | 15 | 33.1 [28.9, 37.6] | 98.3 | ||
| 2 | 31.7 [30.0, 33.4] | 99.2 | |||
| Europe and Central Asia | 10 | 31.5 [26.6, 36.8] | 99.8 | ||
| 3 | 61.3 [60.4, 62.3] | 99.7 | |||
| Latin America and the Caribbean | 6 | 20.6 [15.9, 26.1] | 98.5 | ||
| 1 | 26.6 [25.0, 28.3] | 0.0 | |||
| Middle East and North Africa | 3 | 26.8 [25.4, 28.2] | 93.1 | ||
| 0 | — | — | |||
| North America | 37 | 44.0 [41.0, 47.1] | 99.9 | ||
| 29 | 42.6 [39.6, 45.7] | 99.9 | |||
| South Asia | 3 | 25.6 [23.8, 27.5] | 96.1 | ||
| 0 | — | — | |||
| Meta‐regressions | N analyses | Slope, SE [95% CI] | Z | p | |
| % Overweight and obesity | 70 | 0.018, 0.001 [0.016, 0.020] | 14.869 | <0.001 | |
| 26 | 0.015, 0.002 [0.011, 0.018] | 8.727 | <0.001 | ||
| % Women | 58 | 0.011, 0.003 [0.004, 0.017] | 3.260 | 0.001 | |
| 30 | 0.012, 0.004 [0.003, 0.020] | 2.625 | 0.009 | ||
| Mean age | 48 | 0.038, 0.007 [0.024, 0.051] | 5.490 | <0.001 | |
| 11 | 0.001, 0.034 [−0.067, 0.068] | 0.020 | 0.984 |
Cochran's Q statistic and p‐values correspond to subgroup differences in effects. Results from sensitivity analyses are represented in bold.
There were significant differences in the prevalence of weight loss attempts between geographic regions (Q = 108.335, p < 0.001), in which the highest overall prevalence was found in North America (44%, 95% CI [41%, 47.1%]) and the lowest in Africa (16.6%, 95% CI [12.7%, 21.4%]) (Table 2). All subgroups presented significant heterogeneity and large proportion of dispersion in the prevalence rates (I 2 varied between 93.1% and 99.9%). Sensitivity analysis showed that the prevalence of weight loss attempts in Europe and Central Asia and in Latin America and the Caribbean, excluding studies with any methodological limitation, was much higher: from 31.5% to 61.3% and from 20.6% to 26.6%, respectively. Slight changes were observed in East Asia and Pacific and in North America (−1.4%).
Combined prevalence of weight loss attempts increased significantly with the prevalence of overweight and obesity (b = 0.018; p < 0.001), with the percentage of women in the samples (b = 0.011; p = 0.001) and with mean age (b = 0.038; p < 0.001). Sensitivity analysis showed that when excluding all the studies with methodological limitations, only the association between weight loss attempts and mean age became non significant.
Ethnic‐minority population studies
Overall results of the meta‐analysis for the prevalence of weight loss attempts in ethnic minorities showed a pooled estimate of 39.6% (95% CI [29.7%, 50.4%]; Q = 867.199, p < 0.001; I 2 = 98.7%). Combined prevalence of weight maintenance attempts was 21.1% (95% CI [19.2%, 23.2%]; Q = 147,583, p < 0.001; I 2 = 98.6%). Sensitivity analysis showed that excluding all studies with methodological limitations led to an increase in the overall prevalence of weight loss attempts of 4.5% (44.1%; k = 3). All of the studies reporting maintenance attempts presented methodological limitations.
Subgroup analyses by decade of survey showed a prevalence of weight loss attempts of 40% between 1980 and 1989, 48.5% between 1990 and 1999 and 44.9% between 2000 and 2009 (Table 3). Subgroup analyses by geographic region revealed a prevalence of weight loss attempts of 35.6% in Europe and Central Asia and 41% in North America (Table 3). For both analyses, there were no significant differences between groups (Q = 0.415, p = 0.813 and Q = 0.305, p = 0.581, respectively). Meta‐regressions by mean age and percentage of women in the samples were also not significant (b = 0.042; p = 0.118 and b = −0.009; p = 0.440, respectively). Because only three studies did not present methodological limitations, we did not conduct sensitivity analyses for this set of moderation analyses.
Table 3.
Subgroup analysis assessing the effect of pre‐selected moderators on the prevalence of weight loss attempts in ethnic‐minority populations
| Moderators | N analyses | Prevalence (%) [95% CI] | Q 1 | p 1 | I 2 (%) |
|---|---|---|---|---|---|
| Decade of survey | 0.415 | 0.813 | |||
| 1980–1989 | 1 | 40.0 [35.8, 44.4] | 99.7 | ||
| 1990–1999 | 3 | 48.5 [46.3, 50.7] | 99.6 | ||
| 2000–2009 | 6 | 44.9 [28.1, 62.8] | 99.8 | ||
| Geographic region | 0.305 | 0.581 | |||
| Europe and Central Asia | 2 | 35.6 [33.5, 37.7] | 95.9 | ||
| North America | 10 | 41.0 [29.5, 53.5] | 98.8 | ||
| Meta‐regressions | N analyses | Slope, SE [95% CI] | Z | p | |
| % Women | 12 | −0.009, 0.011 [−0.030, 0.013] | −0.771 | 0.440 | |
| Mean age | 11 | 0.042, 0.027 [−0.011, 0.095] | 1.561 | 0.118 |
Cochran's Q statistic and p‐values correspond to subgroup differences in effects.
Personal weight control strategies
Twenty‐seven studies (25 general population studies and 2 ethnic‐minority population studies) reported strategies used by those trying to control their weight (Table 4). Thirty‐seven strategies were identified across studies, which were grouped in 10 domains of the OxFAB Taxonomy. Doing or increasing physical activity – the only strategy that fell in the energy compensation domain – was the most frequently assessed strategy (k = 27 for trying to lose and k = 7 for trying to maintain weight), and results show that this strategy was used by the majority of participants across studies. Dieting – within the restraint domain – was the second most assessed strategy for trying to lose weight (k = 20) and was even more frequently reported: more than two‐thirds of participants attempted to lose weight using this strategy. All other strategies were assessed by 1 to 14 studies. The domain that combined more strategies was the regulation – restrictions (k ranged between 1 and 9): from 12% to 66% of participants and from 2% to 64% of participants reported avoiding or restricting specific foods or behaviours for trying to lose and maintain weight, respectively. Dietary choices (k = 1–4) and weight management aids (k = 1–14) were the other domains were more strategies fell on: from 39% to 85% of participants reported choosing specific dietary behaviours and from 1% to 25% of participants reported using some aid to try to lose weight; from 36% to 87% of participants reported choosing specific dietary behaviours and from 1% to 6% of participants reported using some aid to try to maintain weight.
Table 4.
Personal weight control strategies
| Weight loss attempts | Weight maintenance attempts | |||||||
|---|---|---|---|---|---|---|---|---|
|
Domains Strategies |
Number of studies | n | Prevalence (%)* | References | Number of studies | n | Prevalence (%)* | References |
| Dietary choices | ||||||||
| Eat/drink low‐calorie foods/beverages1 | 4 | 4,285 | 39.2 | 46, 58, 59, 86 | 1 | 396 | 35.9 | 58 |
| Drink water | 3 | 4,445 | 38.7 | 38, 58, 59 | 2 | 609 | 40.2 | 38, 58 |
| Eat more/regularly fruits and vegetables2 | 3 | 374 | 85.3 | 38, 52, 86 | 2 | 213 | 86.9 | 38, 52 |
| Eat breakfast | 1 | 267 | 63.7 | 38 | 1 | 213 | 69.0 | 38 |
| Eat soup | 1 | 267 | 70.8 | 38 | 1 | 213 | 73.2 | 38 |
| Energy compensation ** | ||||||||
| Increased/regular PA/Exercise2, 3, 4, 5 | 27 | 122,314 | 65.2 | 15, 16, 19, 20, 23, 24, 32, 34, 35, 38, 40, 46, 47, 49, 50, 52, 53, 55, 56, 58, 59, 63, 65, 70, 74, 77, 86 | 7 | 36,000 | 50.2 | 15, 16, 38, 49, 52, 58, 65 |
| Information seeking | ||||||||
| Select foods consciously | 3 | 692 | 82.2 | 15, 16, 38 | 3 | 679 | 83.7 | 15, 16, 38 |
| Seek information on food/nutrition/PA5 | 2 | 267 | 57.7 | 35, 38 | 1 | 213 | 57.7 | 38 |
| Regulation: Restrictions | ||||||||
| Skip meals2, 4, 6 | 9 | 15,135 | 13.8 | 15, 16, 24, 46, 52, 53, 58, 59, 86 | 4 | 396 | 8.90 | 15, 16, 52, 58 |
| Eat less fat/fatty foods2 | 6 | 13,895 | 51.0 | 16, 52, 53, 58, 59, 86 | 3 | 615 | 57.9 | 16, 52, 58 |
| Eat less sugar/sugary foods2, 3 | 4 | 298 | 66.1 | 16, 20, 52, 86 | 2 | 219 | 63.5 | 16, 52 |
| Follow a special/fad diet | 4 | 5,876 | 11.9 | 38, 46, 58, 59 | 2 | 609 | 1.64 | 38, 58 |
| Drink less alcoholic beverages | 2 | 425 | 44.9 | 15, 16 | 2 | 466 | 42.5 | 15, 16 |
| Eat less fried/junk foods2 | 1 | — | — | 52 | 1 | — | — | 52 |
| Eat less high‐carbohydrate foods | 1 | 107 | 60.7 | 86 | 0 | |||
| Eat less meat | 1 | 107 | 49.5 | 86 | 0 | |||
| Limit snacking | 1 | 107 | 59.8 | 86 | 0 | |||
| Regulation: Rule‐setting | ||||||||
| Eat more frequently (small meals) | 2 | 1,698 | 20.7 | 38, 46 | 1 | 213 | 69.0 | 38 |
| Eat slowly | 1 | 267 | 47.6 | 38 | 1 | 213 | 50.7 | 38 |
| Choose small portions | 1 | 267 | 67.6 | 38 | 1 | 213 | 67.6 | 38 |
| Restraint | ||||||||
| Dieting2, 3, 4, 5 | 20 | 117,337 | 68.9 | 19, 20, 23, 24, 32, 34, 35, 40, 46, 47, 49, 50, 53, 55, 56, 63, 65, 70, 74, 77 | 2 | 34,925 | 65.9 | 49, 65 |
| Reduce amount of food eaten2, 3 | 7 | 4,710 | 66.9 | 15, 16, 20, 52, 58, 59, 86 | 4 | 862 | 63.3 | 15, 16, 52, 58 |
| Self‐monitoring | ||||||||
| Count calories3 | 5 | 2,123 | 20.4 | 15, 16, 20, 38, 46 | 3 | 679 | 6.92 | 15, 16, 38 |
| Record dietary intake and PA | 2 | 1,698 | 12.4 | 38, 46 | 1 | 213 | 7.04 | 38 |
| Self‐weighing | 1 | 1,431 | 70.7 | 46 | 0 | |||
| Support: Professional | ||||||||
| Attend a weight control programme or group4 | 9 | 16,585 | 6.28 | 15, 19, 24, 34, 38, 46, 53, 58, 59 | 3 | 856 | 1.87 | 15, 38, 58 |
| Receive advice from a healthcare professional5 | 3 | 934 | 13.2 | 19, 35, 38 | 1 | 213 | 16.4 | 38 |
| Weight management aids | ||||||||
| Use weight loss pills or supplements2, 4 | 14 | 19,008 | 10.2 | 16, 19, 23, 24, 32, 34, 35, 38, 46, 52, 53, 58, 59, 86 | 4 | 828 | 1.21 | 16, 38, 52, 58 |
| Use laxatives or diuretics2, 7 | 10 | 13,067 | 2.92 | 15, 16, 34, 35, 38, 46, 52, 53, 58, 86 | 5 | 679 | 6.19 | 15, 16, 38, 52, 58 |
| Eat diet foods or products1, 5 | 7 | 5,528 | 15.9 | 15, 23, 34, 35, 46, 58, 59 | 2 | 643 | 3.42 | 15, 58 |
| Use meal replacements (food/drinks) | 5 | 6,189 | 9.73 | 16, 34, 46, 58, 59 | 2 | 615 | 1.30 | 16, 58 |
| Vitamins | 3 | 2,547 | 25.2 | 23, 34, 46 | 0 | |||
| Traditional medicine5 | 2 | 389 | 10.0 | 34, 35 | 0 | |||
| Devices | 1 | 1,431 | 0.98 | 46 | 0 | |||
| Surgery | 1 | 1,431 | 0.56 | 46 | 0 | |||
| Extreme strategies | ||||||||
| Fasting or vomiting2, 6, 7 | 10 | 12,856 | 4.74 | 15, 16, 32, 35, 38, 46, 52, 53, 58, 86 | 5 | 213 | 0.90 | 15, 16, 38, 52, 58 |
| Smoking | 3 | 532 | 6.95 | 15, 16, 86 | 2 | 466 | 5.15 | 15, 16 |
Prevalence indicates the number of respondents out of n study sample that reported using strategies for trying to lose or maintain weight.
Study 46 was not accounted for sample size or prevalence rate in this strategy because of assessment differences (several low‐calorie foods were assessed separately).
Studies 52, 65 were not accounted for sample size or prevalence rates because they did not report separate values for trying to lose and maintain weight.
Studies 20, 40, 70, 77 were not accounted for sample size or prevalence rates because of assessment differences (only the key method was assessed).
Studies 24, 55, 63, 74 were not accounted for sample size or prevalence rates because they did not have sufficient data available.
Study 35 was not accounted for sample size or prevalence rates in this strategy because of assessment differences (only the key method was assessed).
Studies 15, 16 were not accounted for sample size or prevalence rates in this strategy because of assessment differences (fasting was assessed together with skipping meals).
Study 58 was not accounted for sample size or prevalence rate in this strategy because of assessment differences (vomiting was assessed together with the use of laxatives).
Exercise/physical activity was considered in the Energy Compensation domain because this strategy is commonly used to compensate energy intake as a way to control weight.
Weight control motives
Of the 72 included studies, only seven from general populations reported motives for trying to lose and/or maintain weight (Table 5). To improve appearance and to improve health and prevent future diseases were the most frequently assessed motives for trying to lose weight (k = 5), although to improve wellbeing was the most frequently reported motive (95%), followed by to improve fitness condition or staying fit (85%) and to improve self‐esteem (74%). The most frequently reported motive for trying to maintain weight was to improve health and prevent future diseases (98%), followed by to improve wellbeing (91%), to improve fitness condition or staying fit (87%), to improve appearance (80%) and to improve self‐esteem (71%). All other motives (e.g. to please or by insistence of spouse/partner, because of health professional advice) were listed by less than 50% of participants.
Table 5.
Weight control motives
| Weight loss attempts | Weight maintenance attempts | |||||||
|---|---|---|---|---|---|---|---|---|
| Motives | Number of studies | n | Prevalence (%)* | References | Number of studies | n | Prevalence (%)* | References |
| Improve appearance | 5 | 1,104 | 71.4 | 15, 24, 32, 35, 38 | 2 | 460 | 79.8 | 15, 38 |
| Improve health/prevent diseases | 5 | 1,104 | 35.3 | 15, 24, 32, 35, 38 | 2 | 460 | 97.6 | 15, 38 |
| Improve wellbeing | 3 | 501 | 95.0 | 15, 22, 38 | 3 | 460 | 90.8 | 15, 22, 38 |
| Improve fitness condition/stay fit | 3 | 501 | 84.6 | 15, 32, 38 | 2 | 460 | 86.9 | 15, 38 |
| Improve self‐esteem | 3 | 501 | 73.9 | 15, 32, 38 | 2 | 460 | 71.0 | 15, 38 |
| Health professional advice | 3 | 501 | 40.0 | 15, 22, 38 | 3 | 460 | 38.6 | 15, 22, 38 |
| Please/insistence of spouse or partner | 2 | 234 | 46.2 | 15, 22 | 2 | 247 | 32.0 | 15, 22 |
| Improve social life/avoid discrimination | 2 | 267 | 37.8 | 22, 38 | 2 | 213 | 44.6 | 22, 38 |
| Improve professional life/fulfil specific professional requirements | 2 | 267 | 32.2 | 22, 38 | 2 | 213 | 42.7 | 22, 38 |
| Please/insistence of family | 2 | 234 | 27.8 | 15, 22 | 2 | 247 | 24.9 | 15, 22 |
| Decrease disease risk (e.g. heart attack) | 1 | — | — | 24 | 0 | — | — | |
| Special event/season (e.g. holiday, summer) | 1 | — | — | 22 | 1 | — | — | 22 |
Prevalence indicates the number of respondents out of n study sample that reported motives for trying to lose or maintain weight. Studies 22, 24, 35 were not accounted for sample size or prevalence rate because they did not have sufficient data available. Data from study 46 was not included because of methodological differences (only the most important motive was reported).
Discussion
This comprehensive systematic review and meta‐analysis sought to estimate the prevalence of weight control attempts among adults worldwide, and identify potential correlates, personal strategies used and the underlying motivations. Seventy‐two studies with more than a million participants were included, showing that weight is a matter of concern to a significant portion of the population. Results from high quality studies showed that about 42% of adults from general populations and 44% of adults from ethnic‐minority populations reported trying to lose weight, and about 23% of adults from general populations reported trying to maintain weight at some point in time. Significant differences were found between decades and geographic regions: higher prevalence rates of weight loss attempts among adults from general populations occurred in the decade of 2000–2009 and in Europe and Central Asia. In the last five years (2010–2015), about 40% of adults from general populations reported trying to lose weight. As expected, higher prevalence of weight loss attempts among adults was observed in overweight and obese persons and in women. Across populations, 37 different personal strategies were reported for managing weight, standing out physical activity participation and dieting, which were classified, respectively, within the energy compensation and restraint domains of the OxFAB Taxonomy. Finally, 12 different motives for trying to manage weight were cited, the most common being increasing wellbeing and achieving long‐term health.
To our knowledge, this is the first systematic review and meta‐analysis presenting comprehensive estimates of the prevalence of weight loss and maintenance attempts and describing the related factors among adults across the globe. This is of considerable relevance because accurate information in this area should assist in the evaluation of changes and trends worldwide, in setting priorities for public health initiatives and in planning management of weight control services.
Prevalence of weight control attempts
The overall summary of prevalence results in general populations mirrors the overweight and obesity trends worldwide: prevalence rates have increased in the last decades and are higher in Europe/Central Asia and in the US 87. The prevalence of weight loss attempts appears to have peaked in the beginning of the 2000s. Factors that explain the growing prevalence of weight loss attempts in the start of this millennium may include changes in social norms regarding obesity, an increase in the number of products and services targeting weight management or greater importance attributed by the population to weight or body shape and health. The significant differences observed between geographic regions may also be linked to the cultural context of each region, as well as to the physical environment and socioeconomic condition, as these factors may influence the development of health‐promoting behaviours. For example, individuals from higher socioeconomic groups and with higher levels of education are more likely to try to control their weight 88, 89, perhaps because they are exposed to social advantages such as access to weight loss services, higher affordability of healthy choices and knowledge, which collectively facilitate the adoption of energy‐balance related behaviours 90, 91. Our findings also highlight the role of gender on weight‐related aspects, with more women attempting to lose weight than men. One possible explanation for this is that social norms and cultural pressures to be thin especially affect women 92, or that women with normal weight often perceive themselves as being overweight 65 and consequently engage in more efforts to become or remain thin.
Although the prevalence of overweight and obesity is particularly high in some ethnic‐minority groups 93, the overall summary prevalence of weight loss attempts in this population was only slightly different than that observed in general populations (+2.6%), apparently presenting its peak also in the beginning of the 2000s. One possible justification is a difference in attitudes and cultural norms regarding weight: for example, previous studies have shown that non‐Hispanic black and Hispanic women are more satisfied with their body size than Caucasian women, and individuals who are satisfied with their body size are less likely to try to lose weight 94. However, it should be noted that the limited number of studies without methodological limitations (k = 3, n = 3,217) reduces the confidence in the results, compared with the analyses with general populations (k = 34, n = 1,062,133). Also, the limited number of studies with ethnic‐minority populations limits the conclusions that can be drawn from the moderator analyses because we could not test whether the prevalence of weight loss attempts varied with the prevalence of overweight and obesity, and the non‐significant effects found may be due to low statistical power 10.
Personal weight control strategies
The most consistently assessed strategies, which were used by the majority of individuals trying to lose and maintain weight, were related with increasing energy expenditure and reducing energy intake, in line with evidence‐based guidelines for weight management 1. Other strategies related with improving the quality of the diet – by increasing the consumption of healthy foods (e.g. eating more fruits and vegetables) or restricting the consumption of unhealthy foods (e.g. eating less sugary foods) – were moderately assessed across studies, and also frequently reported, although they may or may not have an impact on body weight (e.g. 95). Importantly, several weight management aids – weight loss pills or supplements, laxatives or diuretics, diet products and meal replacements – and also more extreme strategies – fasting or vomiting – were reported by a low percentage of individuals, mostly for trying to lose weight. This is encouraging in suggesting that in the adult population worldwide, weight control appears to be more associated with health‐promoting rather than potentially harmful strategies. With the exception of a few of these strategies (e.g. some weight loss pills 96), there is no scientific evidence suggesting their effectiveness (e.g. 59, 97, 98), and they may be associated with weight cycling and regain over time 99, and with eating disorders 100.
Weight control motives
Based on the present findings, the public health message on managing weight for long‐term health, preventing disease, general wellbeing or improving fitness seem to have been endorsed across populations. However, reasons such as enhancing appearance, conforming to external request/demands (spouse or doctor), and avoiding discrimination were also relatively common. Considering the positive role that more internal motives (e.g. health and wellbeing) appear to have on long‐term weight control and related behaviours 101, 102, the large endorsement of relatively external motives (e.g. social pressure, even protecting one's self‐esteem from prejudice) may be a cause for concern. Research has now clearly shown that having a more positive body image, not feeling pressured or discriminated against, and losing weight mostly for autonomous (i.e. more internal) reasons pay off in increased adherence to weight‐healthy behaviours and higher success rates 103, 104, 105.
Strengths and limitations
The present review has a number of strengths but also some limitations. First, while it includes a large number of epidemiological studies, which make the findings robust, they are not all nationally representative and response rates varied considerably among studies, leading to inexact overall prevalence rates. Although nationally representative samples are preferable, not including the regional representative and the non‐representative samples would limit our results in terms of time points and geographical regions for which nationally representative data is not available. We performed sensitivity analyses, repeating the analyses without the studies with methodological limitations, in an attempt to partially overcome this limitation.
Second, although surveys have several advantages – they are the standard way of gathering prevalence data, are relatively cheap to administer, information is uniform across the years and privacy can be maintained – they also have disadvantages. These include being subject to social desirability and selection bias towards more motivated individuals; they are also sensitive to the target groups' literacy level 106. Also, surveys were administered in different ways across studies – electronically, via mail, telephone or in person – which could impact final results. Third, although important potential moderators of weight control attempts were tested – percentage of women in the samples, percentage of overweight individuals in the samples, age, geographic region and decade of survey – other variables with potential moderator effect were not assessed, such as socioeconomic status or education level. The main reason for not including these variables was the different methodologies to assess these constructs used across studies, which makes it difficult to standardize results. Fourth, a great variety of personal strategies for attempting to control weight were assessed in a relatively small number of studies, which makes it difficult to determine the exact prevalence of usage of each method. This makes results for weight loss strategies less robust that what is desirable, which should be seen as an important limitation. A systematic standardized approach in this regard must be taken in future studies (for example, using validated instruments like the OxFAB taxonomy 13, which we have used to synthesize results). Finally, weight control motives, which are particularly susceptible to social desirability/undesirability, were assessed in only a small number of studies and without a standardized instrument, probably leading to over‐/underestimated results.
Conclusions and implications
In summary, this study indicates that in the general population about four in 10 adults have tried to lose weight at some point in time and also in the last five years. Key strategies and motives associated with weight control were identified, presenting a clearer picture of weight management from the perspective of those actively seeking it. Although the majority of individuals used strategies in line with recommendations (social desirability notwithstanding), we could not estimate the psychological, economical or social impacts that these attempts may involve. Losing weight often involves substantial investments of time, energy and expectations, sometimes lasting years or decades, something which cannot be ignored. Finally, there seems to be a mismatch between prevalent motives to lose weight and those which research indicates as more conducive to long‐term success.
We believe that this detailed picture of weight control attempts among adults worldwide provides valuable information for healthcare professionals and policy makers towards better planning and resource allocation directly targeting obesity prevention and treatment. From a societal perspective, and considering the high demand for weight management solutions, it is imperative to rigorously evaluate the quality of community, public, and especially commercial weight management services and products, which are increasingly available, and to respond to this demand by funding research for, and promoting evidence‐based and safe services and products targeting long‐term weight control. Additionally, in order to better capture prevalence shifts, surveillance systems should be scheduled, with internationally widespread screening instruments developed and validated for that purpose that will guarantee accuracy and comparability of results.
Acknowledgements
This study was funded by the Portuguese Science and Technology Foundation (grant number SFRH/BD/80739/2011 attributed to the first author). The second author is funded by Fuse, the UK Clinical Research Collaboration Centre of Excellence for Translational Research in Public Health; based on funding from the British Heart Foundation, Cancer Research UK, Economic and Social Research Council, Medical Research Council, the National Institute for Health Research, and the Wellcome Trust. The authors are grateful to Jolanda Luime for her collaboration involving the quality assessment of the studies.
Santos, I. , Sniehotta, F. F. , Marques, M. M. , Carraça, E. V. , and Teixeira, P. J. (2017) Prevalence of personal weight control attempts in adults: a systematic review and meta‐analysis. Obesity Reviews, 18: 32–50. doi: 10.1111/obr.12466.
Footnotes
Maintenance does not necessarily imply previous weight loss.
References
- 1. Jensen MD, Ryan DH, Apovian CM et al. 2013 AHA/ACC/TOS guideline for the management of overweight and obesity in adults: a report of the American College of Cardiology/American Heart Association Task Force on Practice Guidelines and The Obesity Society. Circulation 2014; 129: S102–S138. [DOI] [PMC free article] [PubMed] [Google Scholar]
- 2. Butland B, Webb S, Kopelman P, et al. Tackling obesities: future choices – project report, Government Office for Science 2007. [DOI] [PubMed]
- 3. Centers for Disease Control and Prevention . Best practices for comprehensive tobacco control programs – 2014. Atlanta: U.S. Department of Health and Human Services, Centers for Disease Control and Prevention, National Center for Chronic Disease Prevention and Health Promotion, Of ce on Smoking and Health, 2014.
- 4. Raynor HA, Champagne CM. Position of the Academy of Nutrition and Dietetics: interventions for the treatment of overweight and obesity in adults. J Acad Nutr Diet 2016; 116: 129–147. [DOI] [PubMed] [Google Scholar]
- 5. Teixeira PJ, Going SB, Sardinha LB, Lohman TG. A review of psychosocial pre‐treatment predictors of weight control. Obes Rev 2005; 6: 43–65. [DOI] [PubMed] [Google Scholar]
- 6. Carmody TP, Brunner RL, St Jeor ST. Dietary helplessness and disinhibition in weight cyclers and maintainers. Int J Eat Disord 1995; 18: 247–256. [DOI] [PubMed] [Google Scholar]
- 7. Friedman MA, Brownell KD. Psychological correlates of obesity: moving to the next research generation. Psychol Bull 1995; 117: 3–20. [DOI] [PubMed] [Google Scholar]
- 8. The Joanna Brigs Institute . Joanna Briggs Institute Reviewers' Manual: 2014 edition/Supplement. The Joanna Brigs Institute: Adelaide, 2014. [Google Scholar]
- 9. Borenstein M, Hedges L, Higgins J, Rothstein H. Comprehensive Meta‐Analysis Version 2. Engelwood, NJ: Biostat, 2005. [Google Scholar]
- 10. Borenstein M, Hedges L, Higgins J, Rothstein HR. Introduction to Meta‐analysis. Wiley & Sons, Lda.: Chichester, United Kingdom, 2009. [Google Scholar]
- 11. Cochran WG. The combination of estimates from different experiments. Biometrics 1954; 10: 101–129. [Google Scholar]
- 12. Higgins JP, Thompson SG, Deeks JJ, Altman DG. Measuring inconsistency in meta‐analyses. British Med J 2003; 327: 557–560. [DOI] [PMC free article] [PubMed] [Google Scholar]
- 13. Hartmann‐Boyce J, Aveyard P, Koshiaris C, Jebb SA. Development of tools to study personal weight control strategies: OxFAB taxonomy. Obes (Silver Spring) 2016; 24: 314–320. [DOI] [PMC free article] [PubMed] [Google Scholar]
- 14. Sterne JA, Egger M. Funnel plots for detecting bias in meta‐analysis: guidelines on choice of axis. J Clin Epidemiol 2001; 54: 1046–1055. [DOI] [PubMed] [Google Scholar]
- 15. Crawford D, Owen N, Broom D, Worcester M, Oliver G. Weight‐control practices of adults in a rural community. Aust N Z J Public Health 1998; 22: 73–79. [DOI] [PubMed] [Google Scholar]
- 16. Timperio A, Cameron‐Smith D, Burns C, Crawford D. The public's response to the obesity epidemic in Australia: weight concerns and weight control practices of men and women. Public Health Nutr 2000; 3: 417–424. [DOI] [PubMed] [Google Scholar]
- 17. Charles J, Britt H, Knox S. Patient perception of their weight, attempts to lose weight and their diabetes status. Aust Fam Physician 2006; 35: 925–928. [PubMed] [Google Scholar]
- 18. Jeffery RW, Abbott G, Ball K, Crawford D. Behavior and weight correlates of weight‐control efforts in Australian women living in disadvantage: the READI study. Int J Behav Nutr Phys Act 2013; 10: 52. [DOI] [PMC free article] [PubMed] [Google Scholar]
- 19. Yoong SL, Carey ML, Sanson‐Fisher RW, D'Este C. A cross‐sectional study assessing the self‐reported weight loss strategies used by adult Australian general practice patients. BMC Fam Pract 2012; 13: 48. [DOI] [PMC free article] [PubMed] [Google Scholar]
- 20. Paxton SJ, Sculthorpe A, Gibbons K. Weight‐loss strategies and beliefs in high and low socioeconomic areas of Melbourne. Australian J Public Health 1994; 18: 412–417. [DOI] [PubMed] [Google Scholar]
- 21. Peltzer K, Pengpid S. Trying to lose weight among non‐overweight university students from 22 low, middle and emerging economy countries. Asia Pac J Clin Nutr 2015; 24: 177–183. [DOI] [PubMed] [Google Scholar]
- 22. Santos O, Sermeus G, Carmo I, Anelli M, Kupers P, Martin E. In search of weight loss – a four‐country survey on what people were doing for losing weight at the turn of the century. Endocrinol, Diabetes & Obes 2010; 4: 21–31. [Google Scholar]
- 23. Machado EC, Silveira MF, Silveira VM. Prevalence of weight‐loss strategies and use of substances for weight‐loss among adults: a population study. Cad Saude Publica 2012; 28: 1439–1449. [DOI] [PubMed] [Google Scholar]
- 24. Green KL, Cameron R, Polivy J et al. Weight dissatisfaction and weight loss attempts among Canadian adults. Canad Med Assoc J 1997; 157(Suppl 1): S17–S25. [PMC free article] [PubMed] [Google Scholar]
- 25. Gallant AR, Perusse‐Lachance E, Provencher V, Begin C, Drapeau V. Characteristics of individuals who report present and past weight loss behaviours: results from a Canadian university community. Eat Weight Disord 2013; 18: 395–401. [DOI] [PubMed] [Google Scholar]
- 26. Johnston DW, Lordan G. Weight perceptions, weight control and income: an analysis using British data. Econ Hum Biol 2014; 12: 132–139. [DOI] [PubMed] [Google Scholar]
- 27. Korkeila M, Rissanen A, Kaprio J, Sorensen TI, Koskenvuo M. Weight‐loss attempts and risk of major weight gain: a prospective study in Finnish adults. Am J Clin Nutr 1999; 70: 965–975. [DOI] [PubMed] [Google Scholar]
- 28. Monneuse MO, Bellisle F, Koppert G. Eating habits, food and health related attitudes and beliefs reported by French students. Eur J Clin Nutr 1997; 51: 46–53. [DOI] [PubMed] [Google Scholar]
- 29. Wardle J, Griffith J, Johnson F, Rapoport L. Intentional weight control and food choice habits in a national representative sample of adults in the UK. Int J Obes Relat Metab Disord 2000; 24: 534–540. [DOI] [PubMed] [Google Scholar]
- 30. Jackson SE, Wardle J, Johnson F, Finer N, Beeken RJ. The impact of a health professional recommendation on weight loss attempts in overweight and obese British adults: a cross‐sectional analysis. BMJ Open 2013; 3: e003693. [DOI] [PMC free article] [PubMed] [Google Scholar]
- 31. Wakui S, Odagiri Y, Takamiya T et al. Relation between self‐reported weight cycling history, dieting and bio‐behavioral health in Japanese adult males. Environm Health Prev Med 2002; 6: 248–255. [DOI] [PMC free article] [PubMed] [Google Scholar]
- 32. Tamim H, Dumit N, Terro A et al. Weight control measures among university students in a developing country: a cultural association or a risk behavior. J Am Coll Nutr 2004; 23: 391–396. [DOI] [PubMed] [Google Scholar]
- 33. Mardiah BA, Hazizi AS, Nasir MTM, Zaitun Y, Jan JMH. Gender differences in the attitude and strategy towards weight control among government employees in Penang, Malaysia. Iranian J Public Health 2012; 41: 28–36. [PMC free article] [PubMed] [Google Scholar]
- 34. Kong W‐T, Bhua S‐S, Alwi S. Weight loss among Malaysian adults. Asia‐Pacific J Public Health 2002; 14: 99–104. [DOI] [PubMed] [Google Scholar]
- 35. Mendez‐Hernandez P, Dosamantes‐Carrasco D, Lamure M et al. Weight‐loss practices among university students in Mexico. Int J Public Health 2010; 55: 221–225. [DOI] [PMC free article] [PubMed] [Google Scholar]
- 36. Leong SL, Madden C, Gray AR, Horwath CC. A nationwide survey of weight control practices among middle‐aged New Zealand women. New Zealand Med J 2013; 126: 12–20. [PubMed] [Google Scholar]
- 37. Hjartaker A, Laake P, Lund E. Body mass index and weight change attempts among adult women – The Norwegian Women and Cancer Study. Eur J Public Health 2001; 11: 141–146. [DOI] [PubMed] [Google Scholar]
- 38. Santos I, Andrade AM, Teixeira PJ. [Weight control attempts among Portuguese adults: prevalence, motives and behavioral strategies]. Acta Med Port 2015; 28: 77–86. [PubMed] [Google Scholar]
- 39. Pengpid S, Peltzer K. Prevalence of overweight and underweight and its associated factors among male and female university students in Thailand. Homo 2015; 66: 176–186. [DOI] [PubMed] [Google Scholar]
- 40. Stephenson MG, Levy AS, Sass NL, McGarvey WE. 1985 NHIS findings: nutrition knowledge and baseline data for the weight‐loss objectives. Public Health Rep 1987; 102: 61–67. [PMC free article] [PubMed] [Google Scholar]
- 41. Serdula MK, Mokdad AH, Pamuk ER, Williamson DF, Byers T. Effects of question order on estimates of the prevalence of attempted weight‐loss. Am J Epidemiol 1995; 142: 64–67. [DOI] [PubMed] [Google Scholar]
- 42. Jeffery RW, Adlis SA, Forster JL. Prevalence of dieting among working men and women: the healthy worker project. Health Psychol 1991; 10: 274–281. [DOI] [PubMed] [Google Scholar]
- 43. Kant AK. Weight‐loss attempts and reporting of foods and nutrients, and biomarkers in a national cohort. Int J Obes Relat Metab Disord 2002; 26: 1194–1204. [DOI] [PubMed] [Google Scholar]
- 44. Williamson DF, Serdula MK, Anda RF, Levy A, Byers T. Weight loss attempts in adults: goals, duration, and rate of weight loss. Am J Public Health 1992; 82: 1251–1257. [DOI] [PMC free article] [PubMed] [Google Scholar]
- 45. Horm J, Anderson K. Who in America is trying to lose weight? Ann Intern Med 1993; 119(7 Pt 2): 672–676. [DOI] [PubMed] [Google Scholar]
- 46. Levy AS, Heaton AW. Weight control practices of U.S. adults trying to lose weight. Ann Intern Med 1993; 119(7 Pt 2): 661–666. [DOI] [PubMed] [Google Scholar]
- 47. Barrett DH, Anda RF, Croft JB, Serdula MK, Lane MJ. The association between alcohol‐use and health behaviors related to the risk of cardiovascular‐disease – The South Carolina Cardiovascular‐Disease Prevention Project. J Studies Alcohol 1995; 56: 9–15. [DOI] [PubMed] [Google Scholar]
- 48. Nothwehr F, Peterson NA. Healthy eating and exercise: strategies for weight management in the rural midwest. Health Educ Behav 2005; 32: 253–263. [DOI] [PubMed] [Google Scholar]
- 49. Serdula MK, Mokdad AH, Williamson DF, Galuska DA, Mendlein JM, Heath GW. Prevalence of attempting weight loss and strategies for controlling weight. JAMA 1999; 282: 1353–1358. [DOI] [PubMed] [Google Scholar]
- 50. Kabeer NH, Simoes EJ, Murayi T, Brownson RC. Correlates of overweight and weight‐loss practices in Missouri. Am J Health Behav 2001; 25: 125–139. [DOI] [PubMed] [Google Scholar]
- 51. Anderson LA, Eyler AA, Galuska DA, Brown DR, Brownson RC. Relationship of satisfaction with body size and trying to lose weight in a national survey of overweight and obese women aged 40 and older. United States Prev Med 2002; 35: 390–396. [DOI] [PubMed] [Google Scholar]
- 52. Neumark‐Sztainer D, Rock CL, Thornquist MD, Cheskin LJ, Neuhouser ML, Barnett MJ. Weight‐control behaviors among adults and adolescents: associations with dietary intake. Prev Med 2000; 30: 381–391. [DOI] [PubMed] [Google Scholar]
- 53. Kruger J, Galuska DA, Serdula MK, Jones DA. Attempting to lose weight: specific practices among U.S. adults. Am J Prev Med 2004; 26: 402–406. [DOI] [PubMed] [Google Scholar]
- 54. Thomas RJ, Kottke TE, Brekke M et al. Attempts at changing dietary and exercise habits to reduce risk of cardiovascular disease: who's doing what in the community? Prev Cardiol 2002; 5: 102–108. [DOI] [PubMed] [Google Scholar]
- 55. Bish CL, Blanck HM, Maynard LM, Serdula MK, Thompson NJ, Khan LK. Activity/participation limitation and weight loss among overweight and obese US adults: 1999 to 2002 NHANES. MedGenMed 2007; 9: 63. [PMC free article] [PubMed] [Google Scholar]
- 56. Bish CL, Blanck HM, Serdula MK, Marcus M, Kohl HW, Khan LK. Diet and physical activity behaviors among Americans trying to lose weight: 2000 Behavioral Risk Factor Surveillance System. Obes Res 2005; 13: 596–607. [DOI] [PubMed] [Google Scholar]
- 57. Wee CC, Rigotti NA, Davis RB, Phillips RS. Relationship between smoking and weight control efforts among adults in the United States. Arch Intern Med 2001; 161: 546–550. [DOI] [PubMed] [Google Scholar]
- 58. Weiss EC, Galuska DA, Khan LK, Serdula MK. Weight‐control practices among U.S. adults, 2001–2002. Am J Prev Med 2006; 31: 18–24. [DOI] [PubMed] [Google Scholar]
- 59. Nicklas JM, Huskey KW, Davis RB, Wee CC. Successful weight loss among obese U.S. adults. Am J Prev Med 2012; 42: 481–485. [DOI] [PMC free article] [PubMed] [Google Scholar]
- 60. Kennen EM, Davis TC, Huang J et al. Tipping the scales: the effect of literacy on obese patients' knowledge and readiness to lose weight. Southern Med J 2005; 98: 15–18. [DOI] [PubMed] [Google Scholar]
- 61. Wharton CM, Adams T, Hampl JS. Weight loss practices and body weight perceptions among US college students. J Am Coll Health 2008; 56: 579–584. [DOI] [PubMed] [Google Scholar]
- 62. Kimmons JE, Blanck HM, Tohill BC, Zhang J, Khan LK. Multivitamin use in relation to self‐reported body mass index and weight loss attempts. MedGenMed 2006; 8: 3. [PMC free article] [PubMed] [Google Scholar]
- 63. Bish CL, Blanck HM, Maynard LM, Serdula MK, Thompson NJ, Khan LK. Health‐related quality of life and weight loss practices among overweight and obese US adults, 2003 behavioral risk factor surveillance system. MedGenMed 2007; 9: 35. [PMC free article] [PubMed] [Google Scholar]
- 64. Duncan DT, Wolin KY, Scharoun‐Lee M, Ding EL, Warner ET, Bennett GG. Does perception equal reality? Weight misperception in relation to weight‐related attitudes and behaviors among overweight and obese US adults. Int J Behav Nutr Phys Act 2011; 8: 20. [DOI] [PMC free article] [PubMed] [Google Scholar]
- 65. Yaemsiri S, Slining MM, Agarwal SK. Perceived weight status, overweight diagnosis, and weight control among US adults: the NHANES 2003–2008 study. Int J Obes 2011; 35: 1063–1070. [DOI] [PubMed] [Google Scholar]
- 66. Zapka J, Lemon SC, Estabrook B, Rosal MC. Factors related to weight loss behavior in a multiracial/ethnic workforce. Ethn Dis 2009; 19: 154–160. [PMC free article] [PubMed] [Google Scholar]
- 67. Post RE, Mainous AG III, Gregorie SH, Knoll ME, Diaz VA, Saxena SK. The influence of physician acknowledgment of patients' weight status on patient perceptions of overweight and obesity in the United States. Arch Intern Med 2011; 171: 316–321. [DOI] [PubMed] [Google Scholar]
- 68. Wolfson JA, Bleich SN. Is cooking at home associated with better diet quality or weight‐loss intention? Public Health Nutr 2015; 18: 1397–1406. [DOI] [PMC free article] [PubMed] [Google Scholar]
- 69. Moten A, Jeffers K, Larbi D et al. Obesity and weight loss attempts among subjects with a personal history of cancer. Sultan Qaboos Univ Med J 2014; 14: e330–e336. [PMC free article] [PubMed] [Google Scholar]
- 70. Lebrun LA, Chowdhury J, Sripipatana A, Nair S, Tomoyasu N, Ngo‐Metzger Q. Overweight/obesity and weight‐related treatment among patients in U.S. federally supported health centers. Obes Res Clin Pract 2013; 7: e377–e390. [DOI] [PubMed] [Google Scholar]
- 71. Rose SA, Gokun Y, Talbert J, Conigliaro J. Screening and management of obesity and perception of weight status in Medicaid recipients. J Health Care Poor Underserved 2013; 24: 34–46. [DOI] [PubMed] [Google Scholar]
- 72. Nguyen AB, Oh A, Moser RP, Patrick H. Perceptions of the roles of behaviour and genetics in disease risk: are they associated with behaviour change attempts. Psychol Health 2015; 30: 336–353. [DOI] [PMC free article] [PubMed] [Google Scholar]
- 73. Reba‐Harrelson L, Von Holle A, Hamer RM, Swann R, Reyes ML, Bulik CM. Patterns and prevalence of disordered eating and weight control behaviors in women ages 25–45. Eat Weight Disord 2009; 14: e190–e198. [DOI] [PMC free article] [PubMed] [Google Scholar]
- 74. Lee RE, Greiner A, Hall S et al. Ecologic correlates of obesity in rural obese adults. J Am Coll Nutr 2007; 26: 424–433. [DOI] [PubMed] [Google Scholar]
- 75. Nicolaou M, van Valkengoed IG, Doak CM, van Dam RM, Stronks K, Seidell JC. Ethnic differences in self‐rated overweight and association with reporting weight loss action: the SUNSET study. Eur J Public Health 2012; 22: 859–863. [DOI] [PubMed] [Google Scholar]
- 76. Raberg M, Kumar B, Holmboe‐Ottesen G, Wandel M. Overweight and weight dissatisfaction related to socio‐economic position, integration and dietary indicators among south Asian immigrants in Oslo. Public Health Nutr 2010; 13: 695–703. [DOI] [PubMed] [Google Scholar]
- 77. Arfken CL, Houston CA. Obesity in inner‐city African Americans. Ethn Health 1996; 1: 317–326. [DOI] [PubMed] [Google Scholar]
- 78. Riley NM, Bild DE, Cooper L et al. Relation of self‐image to body size and weight loss attempts in black women: the CARDIA study. Coronary Artery Risk Development in Young Adults. Am J Epidemiol 1998; 148: 1062–1068. [DOI] [PubMed] [Google Scholar]
- 79. Nelson DE, Moon RW, Holtzman D, Smith P, Siegel PZ. Patterns of health risk behaviors for chronic disease: a comparison between adolescent and adult American Indians living on or near reservations in Montana. J Adolesc Health 1997; 21: 25–32. [DOI] [PubMed] [Google Scholar]
- 80. Kumanyika S, Wilson JF, Guilforddavenport M. Weight‐related attitudes and behaviors of black‐women. J Am Diet Assoc 1993; 93: 416–422. [DOI] [PubMed] [Google Scholar]
- 81. Bopp M, Wilcox S, Laken M et al. Factors associated with physical activity among African–American men and women. Am J Prev Med 2006; 30: 340–346. [DOI] [PubMed] [Google Scholar]
- 82. Gary TL, Gross SM, Browne DC, LaVeist TA. The College Health and Wellness Study: baseline correlates of overweight among African Americans. J Urban Health 2006; 83: 253–265. [DOI] [PMC free article] [PubMed] [Google Scholar]
- 83. Getaneh A, Giardina E‐GV, Findley SE. Factors related to weight loss attempt among Dominican immigrants. J Immigr Minor Health 2013; 15: 591–597. [DOI] [PubMed] [Google Scholar]
- 84. James DC. Weight loss strategies used by African American women: possible implications for tailored messages. J Hum Nutr Diet 2013; 26: 71–77. [DOI] [PubMed] [Google Scholar]
- 85. Sherwood NE, Harnack L, Story M. Weight‐loss practices, nutrition beliefs, and weight‐loss program preferences of urban American Indian women. J Am Diet Assoc 2000; 100: 442–446. [DOI] [PubMed] [Google Scholar]
- 86. Harnack L, Bonnie MS, Rock H, Neumark‐Sztainer D, Jeffery R, French S. Nutrition beliefs and weight loss practices of Lakota Indian adults. J Nutr Educ 1999; 31: 10–15. [Google Scholar]
- 87. World Health Organization . Global status report on noncommunicable diseases. World Health Organization, 2010.
- 88. Wardle J, Griffith J. Socioeconomic status and weight control practices in British adults. J Epidemiol Community Health 2001; 55: 185–190. [DOI] [PMC free article] [PubMed] [Google Scholar]
- 89. French SA, Jeffery RW, Forster JL, McGovern PG, Kelder SH, Baxter JE. Predictors of weight change over two years among a population of working adults: the Healthy Worker Project. Int J Obes Relat Metab Disord 1994; 18: 145–154. [PubMed] [Google Scholar]
- 90. Morland K, Wing S, Diez Roux A, Poole C. Neighborhood characteristics associated with the location of food stores and food service places. Am J Prev Med 2002; 22: 23–29. [DOI] [PubMed] [Google Scholar]
- 91. Blane D. The life course, the social gradient and health In: Marmot M, Wilkinson RG. (eds). Social Determinants of Health. Oxford University Press: Oxford, UK, 2001, pp. 64–80. [Google Scholar]
- 92. Carraça EV, Silva MN, Teixeira PJ. Body image investment and self‐regulation of weight control behaviors In: Sams LB, Keels JA. (eds). Handbook on Body Image: Gender Differences, Sociocultural Influences and Health Implications. Nova Publishers: New York, 2013. [Google Scholar]
- 93. Centers for Disease Control and Prevention . Differences in the prevalence of obesity among black, white, and Hispanic adults – United States, 2006–2008. Centers for Disease Control and Prevention, 2009.
- 94. Millstein RA, Carlson SA, Fulton JE et al. Relationships between body satisfaction and weight control practices among US adults. Medscape J Med 2008; 10: 119. [PMC free article] [PubMed] [Google Scholar]
- 95. Field AE, Gillman MW, Rosner B, Rockett HR, Colditz GA. Association between fruit and vegetable intake and change in body mass index among a large sample of children and adolescents in the United States. Int J Obes Relat Metab Disord 2003; 27: 821–826. [DOI] [PubMed] [Google Scholar]
- 96. Drew BS, Dixon AF, Dixon JB. Obesity management: update on orlistat. Vasc Health Risk Manag 2007; 3: 817–821. [PMC free article] [PubMed] [Google Scholar]
- 97. Klesges RC, Ward KD, Ray JW, Cutter G, Jacobs DR Jr, Wagenknecht LE. The prospective relationships between smoking and weight in a young, biracial cohort: the Coronary Artery Risk Development in Young Adults Study. J Consult Clin Psychol 1998; 66: 987–993. [PubMed] [Google Scholar]
- 98. Dombrowski SU, Knittle K, Avenell A, Araujo‐Soares V, Sniehotta FF. Long term maintenance of weight loss with non‐surgical interventions in obese adults: systematic review and meta‐analyses of randomised controlled trials. British Med J 2014; 348: g2646. [DOI] [PMC free article] [PubMed] [Google Scholar]
- 99. Neumark‐Sztainer D, Wall M, Story M, Standish AR. Dieting and unhealthy weight control behaviors during adolescence: associations with 10‐year changes in body mass index. J Adolesc Health 2012; 50: 80–86. [DOI] [PMC free article] [PubMed] [Google Scholar]
- 100. Neumark‐Sztainer DR, Wall MM, Haines JI, Story MT, Sherwood NE, van den Berg PA. Shared risk and protective factors for overweight and disordered eating in adolescents. Am J Prev Med 2007; 33: 359–369. [DOI] [PubMed] [Google Scholar]
- 101. Silva MN, Markland D, Carraca EV et al. Exercise autonomous motivation predicts 3‐yr weight loss in women. Med Scie Sports Exerc 2011; 43: 728–737. [DOI] [PubMed] [Google Scholar]
- 102. Gorin AA, Powers TA, Koestner R, Wing RR, Raynor HA. Autonomy support, self‐regulation, and weight loss. Health Psychol 2014; 33: 332–339. [DOI] [PMC free article] [PubMed] [Google Scholar]
- 103. Puhl RM, Heuer CA. The stigma of obesity: a review and update. Obes (Silver Spring) 2009; 17: 941–964. [DOI] [PubMed] [Google Scholar]
- 104. Teixeira PJ, Carraca EV, Marques MM et al. Successful behavior change in obesity interventions in adults: a systematic review of self‐regulation mediators. BMC Med 2015; 13: 84. [DOI] [PMC free article] [PubMed] [Google Scholar]
- 105. Schvey NA, Puhl RM, Brownell KD. The impact of weight stigma on caloric consumption. Obes (Silver Spring) 2011; 19: 1957–1962. [DOI] [PubMed] [Google Scholar]
- 106. Hawe P, Degeling D, Hall J. Evaluating Health Promotion: A Health worker's Guide. Sydney: MacLennan & Petty, 1990. [Google Scholar]