

Abstract
The original Coffee Taster's Flavor Wheel was developed by the Specialty Coffee Assn. of America over 20 y ago, and needed an innovative revision. This study used a novel application of traditional sensory and statistical methods in order to reorganize the new coffee Sensory Lexicon developed by World Coffee Research and Kansas State Univ. into scientifically valid clusters and levels to prepare a new, updated flavor wheel. Seventy‐two experts participated in a modified online rapid free sorting activity (no tasting) to sort flavor attributes of the lexicon. The data from all participants were compiled and agglomeration hierarchical clustering was used to determine the clusters and levels of the flavor attributes, while multidimensional scaling was used to determine the positioning of the clusters around the Coffee Taster's Flavor Wheel. This resulted in a new flavor wheel for the coffee industry.
Keywords: coffee, flavor wheel, sensory attributes, sorting, statistics
Practical Application
The new SCAA and WCR Coffee Taster's Flavor Wheel can be used as an important tool for communication in the coffee industry, to standardize the description of coffee flavors in a replicable way throughout the coffee value chain, and to educate coffee consumers. It brings industry and science closer together, unifying communication and enabling problem solving of issues critical to the specialty coffee industry. Both the lexicon and flavor wheel are living documents, so there is flexibility and space for additional coffee flavor descriptors as trained panels gain more experience with these tools.
Introduction
The original Specialty Coffee Asscn. of America (SCAA) Coffee Taster's Flavor Wheel was developed in 1995 by Ted Lingle, before many advances and methods in sensory science had been developed (Lingle 1986). To revise this longstanding industry tool, sensory science and statistical methods were applied as novel flavor wheel construction techniques. Even today, across food and beverage industries, very few flavor wheels exist that were created using a scientific approach and a sensory lexicon. A lexicon is a list of vocabulary developed using sensory descriptive analysis methods used to describe a product, along with descriptions of each attribute and reference preparation instructions (Lawless and Civille 2013). Some notable existing flavor wheels have been created using sensory lexicons, for products such as beer, wine, tea, spices, and even drinking water, but the flavor wheel construction methods differed from those used in the current study (Meilgaard and others 1979; Noble and others 1987; (Mel) Suffet and others 1999; Gawel and others 2000; Koch and others 2012; Lawless and others 2012). Lawless and others (2012) used similar statistical techniques (principal component analysis and hierarchical clustering) to those used in this study to develop the McCormick Spice Flavor Wheel; however, the data used were simply a subset of descriptive analysis data gathered from lexicon development, with no sorting task. In the development of a tea flavor wheel, Koch and others (2012) used all descriptive analysis data to perform principal component analysis to determine the positioning in the flavor wheel, but no clustering techniques or sorting exercises were utilized. Gawel and others (2000) did use a sorting task, as in this study, for mouthfeel attributes in wine, but slightly different clustering statistical techniques were used, and only 9 experts participated in the sorting exercise.
Prior to this project, SCAA and World Coffee Research (WCR) worked with sensory scientists, industry representatives, and trained panels of judges at the Sensory Analysis Center at Kansas State Univ. and Texas A&M Univ. to develop a lexicon of about 110 attributes to describe flavor (taste and aroma), texture/mouthfeel, and amplitude (reflecting overall impressions and interaction among other attributes) (Sanchez Alan 2015; World Coffee Research 2016). The WCR Sensory Lexicon was then sent to UC Davis to be sorted into categories and levels to be converted into an updated Coffee Taster's Flavor Wheel. The words (attributes) in a flavor wheel serve to standardize training and aid in education and discussion. The original Coffee Taster's Flavor Wheel has served as a communication tool about coffee products among all components of the industry, including tasters, plants, retailers, exporters and importers, producers, baristas, and consumers. The new Coffee Taster's Flavor Wheel will serve as an improved communication tool, as it is an organized visualization of the WCR Sensory Lexicon (World Coffee Research 2016). This tool is the 1st step toward enabling the coffee industry to identify and characterize specific flavor changes and relate these changes to specific variables in the coffee process, which brings us one step closer to understanding which factors drive coffee flavor.
Materials and Methods
Although this type of scientific conversion from lexicon to flavor wheel was unprecedented, existing sensory and statistical methods were also applied for the purposes of this study. A rapid sensory profiling method sans tasting, called single free sorting, was utilized to determine the similarities and dissimilarities among the 99 coffee flavor attributes. Once the data from the individual sorting tasks were collected and summarized, 2 multivariate statistical techniques were applied. First, to determine the major categories, subcategories, and levels, agglomerative hierarchical clustering (AHC) was used. Conjointly, to determine the arrangement of these categories and subcategories in the wheel structure, multidimensional scaling (MDS) was used. AHC and MDS are both techniques used in sensory science to observe and visualize the similarities between different products, consumers, or attributes (Bertino and Lawless 1993; Lawless and others 1995; Lawless and Heymann 2010; Lawless and others 2012; Lê and Worch 2015). In this way, existing sensory and statistical methods were adapted to create a novel method for constructing a flavor wheel from a defined lexicon.
Panelist recruitment
Twenty‐nine trained descriptive analysis panelists were contacted and recruited from other descriptive studies already in progress at UC Davis. These panelists were not required to be trained specifically on coffee, but they were required to be regular coffee drinkers, had all participated in descriptive analysis on products with complex flavors, and had worked with and been exposed to most of the flavor attributes in the WCR Sensory Lexicon. Panelists were not further trained for this experiment, because group discussions may have allowed the more opinionated panelists to influence the decisions of the quieter panelists. For this experiment, it was decided to simply allow panelists to draw on their individual experiences and subsequently compile and average all the data, rather than holding group discussions and coming to a group consensus. Recruitment, screening, and scheduling were done via email. Once accepted into the study, participants were sent written instructions to perform the sorting task on the web app remotely from their personal computers. The entire process was online and remote.
In order to accurately reflect the coffee industry needs, create an additional set of data, and add more statistical power, 43 coffee industry experts recruited by SCAA performed the same online procedure as the UC Davis panelists. The industry panelists came from all areas of the coffee industry and they all had experience as coffee tasters, but not all of them had experience in sensory descriptive tests.
Sorting exercise
Before the sorting task began, the WCR Sensory Lexicon was reduced to 99 flavor attributes, removing all attributes not exclusively referring to flavors. Specifically, the attribute “astringent” and all attributes in the Texture/Mouthfeel and Amplitude sections were removed. The sensory free sorting method was adapted to fit the goals of this experiment. The word sort procedure was originally done in a Steinberg study (Steinberg 1967), to be used as a tool for semantic analysis, particularly regarding connotations. This sorting method has since been adapted to food samples for sensory analysis (Lawless and others 1995; Varela and Ares 2012). Traditionally, panelists are asked to sort food products or other samples into as many clusters or groups as they choose, in a way that makes sense to them (Lawless and others 1995; Dehlholm and others 2012; Varela and Ares 2012). In free multiple sorting, a rapid sensory descriptive method, panelists repeat this procedure until they feel they have exhausted the sorting possibilities, and then they are asked to provide descriptions for each group of samples (Dehlholm and others 2012; Varela and Ares 2012). In a study comparing single sorting to multiple sorting, Rosenberg and Kim (1975) found that multiple sorting was superior in representing all possible dimensions of categorization of the data. Additionally, one drawback to using single sorting is that the individual data need to be summed together in order to analyze it, so individual data are lost (Lawless and others 1995).
In this experiment, instead of sorting food samples themselves, panelists were asked to sort the attributes into categories and subcategories without tasting samples and therefore based on their experience and expectations of these flavor descriptors. Thus, this sorting exercise was similar to the original word sort procedure performed by Steinberg in 1967. Sorting the words themselves was appropriate in this case, due to the ultimate goal of using the Coffee Taster's Flavor Wheel as a tool for coffee industry professionals. Since there was no tasting, fatigue, adaptation, and carryover effects did not bias the data (Lawless and others 1995). Additionally, as there were 99 attributes, to avoid fatigue, instead of repeating the procedure multiple times, the panelists each only sorted the lexicon once.
A user‐friendly web interface (Figure 1) was created using AngularJS (a modern and popular Javascript framework) to allow for simple, efficient sorting of the 99 flavor attributes. This helped to minimize the clutter of index cards and catalyze the data collection process, because data could be stored immediately in Firebase (https://www.firebase.com), a free database and web application hosting service. The website had a welcome page and the participants would log in (to begin tracking their sorting) and be greeted with brief instructions and a “begin” button. The users would then see further instructions and the list of attributes, each with a question mark to the far right with a scroll‐over pop‐up with the WCR definition of that attribute. If a user was unclear about the meaning of one of the words of the lexicon, he/she could scroll over the information bubble to access the definition. The participant was able to click and drag the attributes into categories and subcategories, for as many hierarchical levels as they deemed necessary. Once the user felt the attributes were adequately sorted into categories and subcategories, they would press “submit” and the results were immediately stored in the Firebase database.
Figure 1.
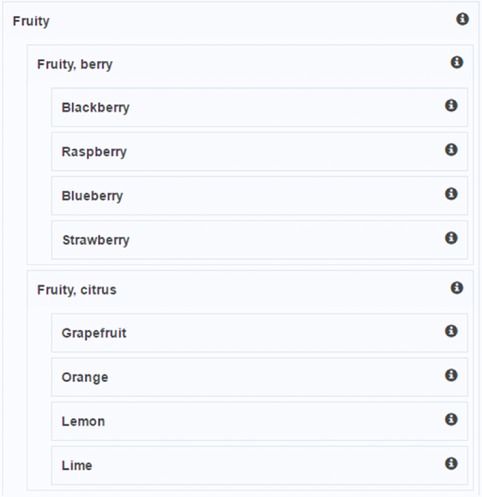
An example user interface for a completed sorting task (11 of 99 possible attributes).
Statistical analysis
The methods of AHC and MDS were used to represent attribute–attribute relations instead of product–attribute relations, because there were no coffee samples, only attributes. To organize the raw data, a program was written in Ruby to translate the sorting data into matrices that could be used for analysis. For both of these methods, 1st, 2 binary matrices were created for each participant (one if the relationship existed and zero if the relationship did not exist), one for “sibling–sibling” relationships, in which the attributes appeared in the same subcategory, and one for “parent–child” relationships, in which one attribute appeared in a subcategory under another attribute. A theoretical example of one of these binary matrices is depicted in Table 1. From the individual sorting data collected, a symmetrical proximity (similarity) matrix with sums of counts of how many times the attributes appear together in “sibling” relationships or “parent–child” relationships was compiled, similar to that in Table 2 but on a larger scale (from 0 to 72).
Table 1.
Theoretical example of a binary matrix of attribute–attribute relationships (individual)
| # of times paired | Fruity | Raspberry | Orange | Lemon | Strawberry | Fruity, berry | Lime | Blackberry | Grapefruit | Fruity, citrus | Blueberry |
|---|---|---|---|---|---|---|---|---|---|---|---|
| Fruity | 1 | 0 | 0 | 0 | 0 | 1 | 0 | 0 | 0 | 1 | 0 |
| Raspberry | 0 | 1 | 0 | 0 | 1 | 1 | 0 | 1 | 0 | 0 | 1 |
| Orange | 0 | 0 | 1 | 1 | 0 | 0 | 1 | 0 | 1 | 1 | 0 |
| Lemon | 0 | 0 | 1 | 1 | 0 | 0 | 1 | 0 | 1 | 1 | 0 |
| Strawberry | 0 | 1 | 0 | 0 | 1 | 1 | 0 | 1 | 0 | 0 | 1 |
| Fruity, berry | 1 | 1 | 0 | 0 | 1 | 1 | 0 | 1 | 0 | 0 | 1 |
| Lime | 0 | 0 | 1 | 1 | 0 | 0 | 1 | 0 | 1 | 1 | 0 |
| Blackberry | 0 | 1 | 0 | 0 | 1 | 1 | 0 | 1 | 0 | 0 | 1 |
| Grapefruit | 0 | 0 | 1 | 1 | 0 | 0 | 1 | 0 | 1 | 1 | 0 |
| Fruity, citrus | 1 | 0 | 1 | 1 | 0 | 0 | 1 | 0 | 1 | 1 | 0 |
| Blueberry | 0 | 1 | 0 | 0 | 1 | 1 | 0 | 1 | 0 | 0 | 1 |
Table 2.
Theoretical example of a similarity matrix (sum of all individuals)
| # of times paired | Fruity | Raspberry | Orange | Lemon | Strawberry | Fruity, berry | Lime | Blackberry | Grapefruit | Fruity, citrus | Blueberry |
|---|---|---|---|---|---|---|---|---|---|---|---|
| Fruity | 20 | 4 | 5 | 3 | 6 | 20 | 6 | 4 | 5 | 19 | 2 |
| Raspberry | 4 | 20 | 1 | 3 | 15 | 17 | 0 | 18 | 0 | 2 | 14 |
| Orange | 5 | 1 | 20 | 1 | 0 | 0 | 1 | 0 | 1 | 1 | 0 |
| Lemon | 3 | 3 | 1 | 20 | 4 | 1 | 19 | 0 | 16 | 20 | 0 |
| Strawberry | 6 | 15 | 0 | 4 | 20 | 20 | 0 | 14 | 1 | 2 | 17 |
| Fruity, berry | 20 | 17 | 0 | 1 | 20 | 20 | 0 | 19 | 2 | 16 | 18 |
| Lime | 6 | 0 | 1 | 19 | 0 | 0 | 20 | 1 | 15 | 19 | 2 |
| Blackberry | 4 | 18 | 0 | 0 | 14 | 19 | 1 | 20 | 0 | 0 | 18 |
| Grapefruit | 5 | 0 | 1 | 16 | 1 | 2 | 15 | 0 | 20 | 19 | 0 |
| Fruity, citrus | 19 | 2 | 1 | 20 | 2 | 16 | 19 | 0 | 19 | 20 | 0 |
| Blueberry | 2 | 14 | 0 | 0 | 17 | 18 | 2 | 18 | 0 | 0 | 20 |
To ensure that all data could be used to create the flavor wheel, 1st, the 2 groups were compared (UC Davis experts compared with coffee industry experts). Two separate similarity matrices were created, one for UC Davis participants and one for industry participants. The scaled matrices were used to run 2 separate 5‐dimensional multidimensional scaling (5D‐MDS) analyses (XLSTAT® 2015 Addinsoft, New York, NY). The results of the 5D‐MDS analyses were used to run a multiple factor analysis (MFA), a technique to compare multiple datasets and in sensory science is typically applied to compare sensory profiles, also on XLSTAT 2015 (Pagès and Husson 2001; Le Dien and Pagès 2003). No significant difference was found between the 2 groups, so the data for all 72 participants were used for further analysis.
To determine the clusters and levels of the flavor wheel, AHC was conducted on the similarity proximity matrix with co‐occurrence values using the unweighted pair group average linkage agglomeration method (XLSTAT 2015). Hierarchical clustering is a statistical technique that can be applied to sorting data to group the attributes into different categories and subcategories on different levels in the form of a dendrogram (Lê and Worch 2015). At the beginning of analysis, every individual object starts as a single “cluster,” and then the unweighted pair group average linkage links the attributes together, one pair at a time, from the bottom (most similar) to the top (least similar). In each successive linkage, it merges the most similar pair of items (can be an individual or the average value of a group). Upon observation of the dendrogram, truncation was set to specify 9 main categories.
In addition to the analysis in XLStat, other methods of similarity were tested in R, such as Euclidean, maximum, and Manhattan. Other agglomeration (linkage) techniques were tested in R as well, such as Ward's, complete, single, and average (unweighted pair group average). In R, the Euclidean distance method with the unweighted average linkage method was determined to be the combination with the most distinct clusters without being biased by outliers or the size of clusters, but even this still split the Fruity group into 2. Otherwise, this combination was very similar to the XLStat result, confirming the hierarchical structure in 2 different software programs. Thus, the XLStat dendrogram with unweighted pair group average linkage, which kept the Fruity group intact, was selected.
Finally, MDS analysis (XLSTAT 2015) was performed to represent all 99 attributes in a 2‐dimensional space, a visual aid to see where the attributes fell in proximity to one another. MDS is a common analytical technique for data from sorting tasks (Rosenberg and Kim 1975; Lawless and others 1995;Lawless and Heymann 2010; Dehlholm and others 2012; Varela and Ares 2012; Lê and Worch 2015). Nonmetric (ordinal) MDS was performed on the proximity (similarity) matrix of Euclidean distance values, meaning the order of the “distance,” using Kruskal's stress values, in the resemblance matrix matched the ranking of the distances for the representation space (the plot). MDS was performed to supplement the AHC data and to guide the positioning of the main classes (clusters) around the new Coffee Taster's Flavor Wheel.
Since the similarity values were obtained from frequency counts for every pair of attributes, the data were considered nonmetric; that is to say, the differences or ratios between the values held no meaning. Higher values were considered more similar and lower values were considered less similar. Kruskal's stress values, commonly used in nonmetric MDS, were used to obtain the 2‐dimensional coordinates that most closely adhere to the ranking of those similarity values (Lawless and Heymann 2010). Other methods of MDS were tested in R, both metric and nonmetric, testing both Minkowski's distance values and Euclidean distances in the stress function. In those results, the 9 main categories were positioned in the 2‐dimensional space in a similar order, but the plots were more sensitive to outliers, meaning some points were far from the origin of the MDS plot and the majority of points were clustered near the origin. As the purpose of this analysis was to obtain the positioning of the main categories around the flavor wheel, the nonmetric MDS in XLStat was ultimately selected as the option that was less sensitive to outliers and most clearly separated the data points.
Results and Discussion
The MFA comparison of the similarity matrices from the UC Davis panelist group and the coffee industry panelist group revealed that there was no significant difference between the 2 groups. The RV‐coefficients were much greater than 0.70, meaning the 2 groups were related and came from the same population (Table 3). An attribute‐by‐attribute comparison (Figure 2) was also plotted from the MFA, showing the degree of similarity in sorting between the 2 groups for each attribute (longer arms indicate that the UC Davis group and the industry group sorted the attribute less similarly and short arms indicate that they sorted them more similarly).
Table 3.
RV‐coefficients from multiple factor analysis (MFA) comparing UC Davis and coffee industry participants
| Industry | UCD | MFA | |
|---|---|---|---|
| Industry | 1 | 0.414 | 0.832 |
| UCD | 0.414 | 1 | 0.850 |
| MFA | 0.832 | 0.850 | 1 |
Figure 2.
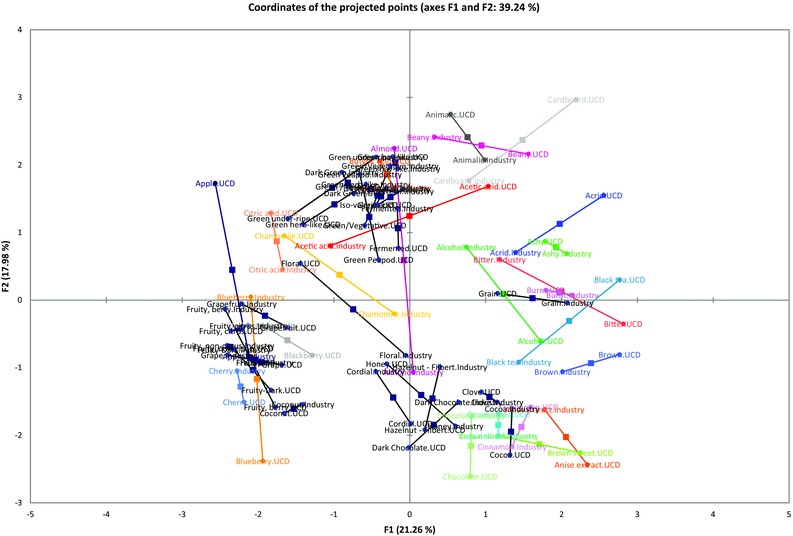
Comparison between UC Davis sorting and industry sorting (the shorter the arm, the more similarly the groups sorted that attribute).
For all participants together, AHC was truncated at 9 main classes, shown in 9 different colors (Figure 3). The MDS plot for the scaled data of all 72 participants is depicted in Figure 4. Using the dendrogram (Figure 3), the 9 main classes were named. Due to the fact that the lexicon was used to provide the attributes to be sorted, some main categories that were found did not have an “umbrella” term that existed in the lexicon, or a general word that encompasses and describes the category (for example, “sweet” or “fruity”). In order to fit the AHC and MDS results onto a flavor wheel, a few modifications had to be made by SCAA and the researchers. Unfortunately, due to the nature of this project (the organization of the attributes was unknown prior), it was impossible to know which of these “umbrella” terms would be needed exactly or how many, so a few of the terms were moved or added to the lexicon to create the final organization (these modifications were executively decided upon by the experts at SCAA, WCR, and the researchers and scientists at Kansas State Univ. in order to create a comprehensive tool). This issue is further elaborated on in the Suggestions section. These 9 main categories are labeled in Figure 3 and 4. The attributes that are similar are found in the same categories and subcategories in the dendrogram (Figure 3). The attributes that are similar are found close to one another on the MDS plot (Figure 4) and those that are less similar are further away from one another.
Figure 3.
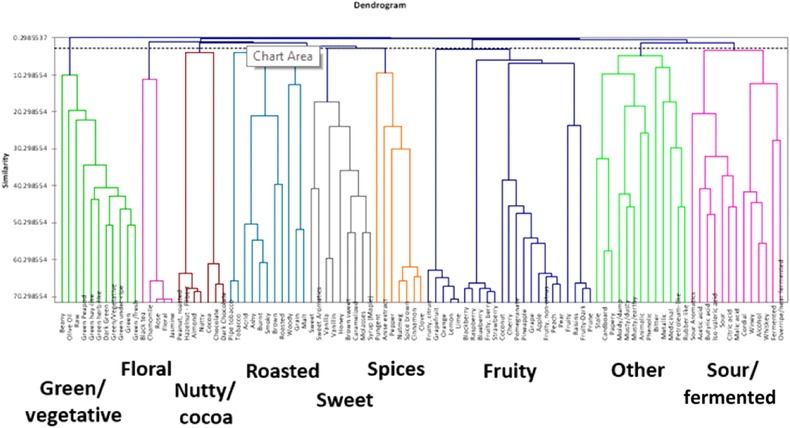
AHC dendrogram with labels for the 9 main classes, used to determine categories and levels for the flavor wheel.
Figure 4.
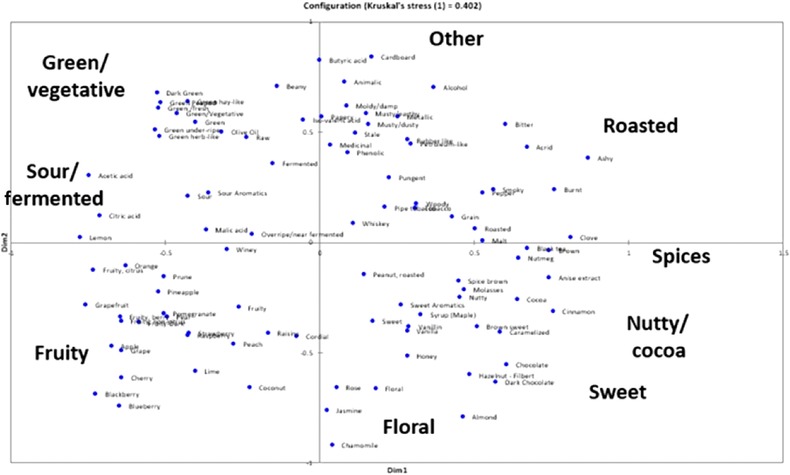
MDS plot with labels for the 9 main classes, used to determine positioning around the flavor wheel.
Additionally, as mentioned earlier, the WCR Sensory Lexicon is a living document, so a few terms were added to the living WCR Sensory Lexicon document after the sorting exercise was complete, and as the lexicon was being finalized, based on the expert opinion of the scientists and panelists at Kansas State Univ. Finally, with the unweighted pair group average linkage, there is a different similarity level for every single pair, and only 3 levels were needed for this flavor wheel. Thus, the dendrogram (Figure 3) was interpreted by SCAA and the researchers to create a 2nd and 3rd tier of subcategories for each of the 9 main categories.
To determine the positioning around the wheel, the MDS plot with category labels was used (Figure 4). Therefore, not only are the more similar attributes placed together in the same categories and subcategories, but the 9 main classes are placed around the flavor wheel based on similarity (the classes that are more similar are closer to each other on the wheel). The hierarchy used for the flavor wheel (Table 4) is the interpretation of the 9‐class dendrogram in Figure 3 with these modifications incorporated. The final wheel, translated from Table 4, is depicted in Figure 5.
Table 4.
Hierarchy used to create the flavor wheel (truncated at 9 main classes)
| Floral | Black tea | |
| Floral | Chamomile | |
| Rose | ||
| Jasmine | ||
| Fruity | Berry | Blackberry |
| Raspberry | ||
| Blueberry | ||
| Strawberry | ||
| Dried fruit** | Raisin | |
| Prune | ||
| Other fruit** | Coconut | |
| Cherry | ||
| Pomegranate | ||
| Pineapple | ||
| Grape | ||
| Apple | ||
| Peach | ||
| Pear | ||
| Citrus fruit | Grapefruit | |
| Orange | ||
| Lemon | ||
| Lime | ||
| Sour/fermented* | Sour | Sour aromatics |
| Acetic acid | ||
| Butyric acid | ||
| Iso‐valeric acid | ||
| Citric acid | ||
| Malic acid | ||
| Alcohol/fermented* | Winey | |
| Whiskey | ||
| Fermented | ||
| Overripe**** | ||
| Green/vegetative* | Olive oil | |
| Raw | ||
| Green/vegetative* | Under‐ripe | |
| Peapod | ||
| Fresh | ||
| Dark green | ||
| Vegetative*** | ||
| Hay‐like | ||
| Herb‐like | ||
| Beany | ||
| Other** | Papery/musty* | Stale |
| Cardboard | ||
| Papery | ||
| Woody | ||
| Moldy/damp | ||
| Musty/dusty | ||
| Musty/earthy | ||
| Animalic | ||
| Meaty brothy** | ||
| Phenolic | ||
| Chemical | Bitter | |
| Salty** | ||
| Medicinal | ||
| Petroleum | ||
| Skunky** | ||
| Rubber | ||
| Roasted | Pipe tobacco | |
| Tobacco | ||
| Burnt | Acrid | |
| Ashy | ||
| Smoky | ||
| Brown, roast** | ||
| Cereal** | Grain | |
| Malt | ||
| Spices** | Pungent | |
| Pepper | ||
| Brown spice** | Anise**** | |
| Nutmeg | ||
| Cinnamon | ||
| Clove | ||
| Nutty/cocoa* | Nutty | Peanuts |
| Hazelnut**** | ||
| Almond | ||
| Cocoa | Chocolate | |
| Dark chocolate | ||
| Sweet | Brown sugar** | Molasses |
| Maple syrup | ||
| Caramelized | ||
| Honey | ||
| Vanilla | ||
| Vanillin | ||
| Overall sweet* | ||
| Sweet aromatics |
*Combined lexicon term created for the final version of the wheel and lexicon, not originally in sorting exercise.
**Term created or modified after the sorting exercise for the final version of the wheel and lexicon.
***Lexicon term added later and placed into wheel later, not originally in sorting exercise.
****Term shortened for the final version of the wheel and lexicon.
Figure 5.
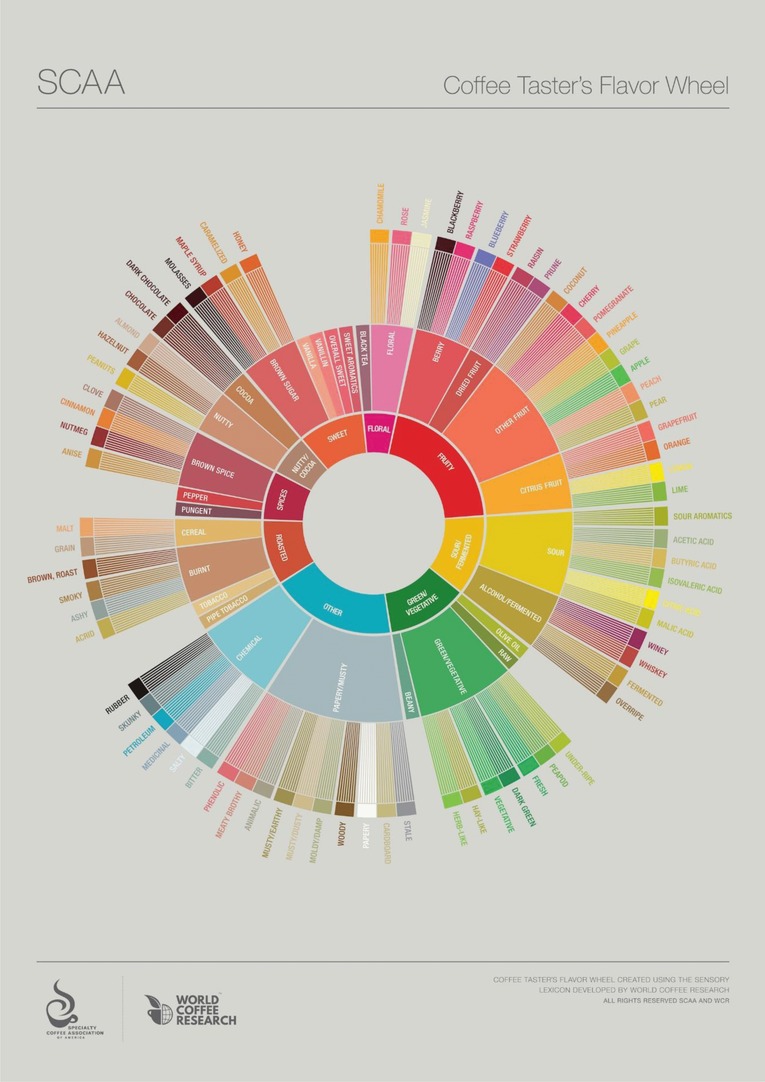
The 2016 SCAA and WCR Coffee Taster's Flavor Wheel.
Suggestions for future flavor wheel techniques
The flavor wheel construction techniques used in this method created a suitable, intuitive flavor wheel to complement the Sensory Lexicon for the specialty coffee industry. However, there are ways to improve the process from the beginning if these methods are to be adopted for the construction of flavor wheels for other products. If the researchers know that a product lexicon will be used to develop a wheel or other visual containing multiple categories and tiers, then these projects could be coordinated to improve the process. To begin with, the initial lexicon should contain only vocabulary from the most specific attributes (those descriptors that will be placed on the outermost tier of the flavor wheel). The study subjects would then be able to use a free sorting exercise similar to that performed in the study, but the exercise would not involve multiple levels. The subjects would simply sort the words into as many groups or clusters as they deem necessary. Also, when the descriptors are presented to the subject to be sorted, it would be best to randomize them for each individual, rather than presenting the same unorganized lexicon to each subject. In this way, both research projects would inform each other as they progressed.
After the initial sorting exercise, a cluster analysis and MDS analysis could be performed (as in this study) to determine the number of groups for the 2nd tier and the positioning of the words around the wheel, respectively. These 2nd‐tier clusters would then be appropriately named by the subjects or descriptive panel in a consensus exercise. Next, the sorting exercise would be repeated with only the 2nd‐tier vocabulary, to sort those descriptors into clusters. Finally, the 1st‐tier (most general) groups would be named, with input from the descriptive panel. To summarize, to use this improved flavor wheel construction technique, researchers would develop the lexicon and wheel simultaneously. Only the most specific vocabulary words should be present in the initial lexicon, and then the more general descriptors, or so‐called “umbrella” terms, would be added in later, with help from the descriptive panelists for as many iterations or levels deemed necessary.
Conclusion
The goal of this project was to organize given coffee flavor descriptors in such a way that simplifies and standardizes the process of describing coffee for industry, whether it is in general or more detailed terms. The categories and subcategories developed using these sorting methods were used to create a new Coffee Taster's Flavor Wheel. AHC analysis provided a suggested hierarchy (categories and levels) to be used for the flavor wheel. Then, MDS analysis provided a visual representation of how the main classes (categories) should be arranged around the flavor wheel. The new Coffee Taster's Flavor Wheel can be used as an effective tool for communication and product characterization in the coffee industry, and to describe coffee flavors in a descriptive and replicable way. This is a pioneering example of a unified visual language tool that can assist in characterizing and solving issues for an entire industry throughout the supply chain. Both the WCR Sensory Lexicon and SCAA and WCR Coffee Taster's Flavor Wheel are living documents, allowing flexibility and space for additional coffee flavor descriptors as new attributes are added over time. In this way, the coffee industry will have a new wheel that is easy to update and is backed by a solid foundation in sensory science and statistical methods. These methods, combined with the suggestions given in this paper, can be used to create flavor wheels for other products in the future.
Author Contributions
Molly Spencer designed the study, recruited and communicated with the study participants, collected the sorting data, analyzed the sorting data, and helped develop the structure of the SCAA and WCR Coffee Taster's Flavor Wheel. Emma Sage, M.S., assisted in participant recruitment, helped develop the flavor wheel structure, and tied this study with other parts of the flavor wheel project, including the WCR Sensory Lexicon. Martin Velez designed the web application for the online sorting exercise (using Firebase) and developed the coding for data collection and storage. Jean‐Xavier Guinard, Ph.D. advised Molly Spencer and supervised the study.
Acknowledgment
This research was supported by the Specialty Coffee Asscn. of America (SCAA) and the study was performed using the World Coffee Research (WCR) Sensory Lexicon, developed by WCR, its industry membership, and the sensory scientists at the Sensory Analysis Center at Kansas State Univ. and validated with Texas A&M Univ.
References
- Bertino M, Lawless HT. 1993. Understanding Mouthfeel Attributes: A Multidimensional Scaling Approach. J Sens Stud 8(2):101–14. [Google Scholar]
- Dehlholm C, Brockhoff PB, Meinert L, Aaslyng MD, Bredie WLP. 2012. Rapid descriptive sensory methods—comparison of free multiple sorting, partial napping, napping, flash profiling and conventional profiling. Food Qual Prefer 26(2):267–77. [Google Scholar]
- Gawel R, Oberholster A, Francis IL. 2000. A “Mouth‐feel Wheel”: terminology for communicating the mouth‐feel characteristics of red wine. Aust J Grape Wine Res 6(3):203–7. [Google Scholar]
- Koch IS, Muller M, Joubert E, Rijst M van der, Næs T. 2012. Sensory characterization of rooibos tea and the development of a rooibos sensory wheel and lexicon. Food Res Intl 46(1):217–28. [Google Scholar]
- Lawless HT, Heymann H. 2010. Sensory evaluation of food: principles and practices. New York, N.Y: Springer; p 458–9. Print. [Google Scholar]
- Lawless HT, Sheng N, Knoops SSCP. 1995. Multidimensional scaling of sorting data applied to cheese perception. Food Qual Prefer 6(2):91–8. [Google Scholar]
- Lawless LJR, Hottenstein A, Ellingsworth J. 2012. The Mccormick spice wheel: a systematic and visual approach to sensory lexicon development. J Sens Stud 27(1):37–47. [Google Scholar]
- Le Dien S, Pagès J. 2003. Hierarchical multiple factor analysis: application to the comparison of sensory profiles. Food Qual Prefer 14(5–6):397–403. [Google Scholar]
- Lê S, Worch T. 2015. Analyzing sensory data with R. Boca Raton, Fla: Taylor & Francis Group; p 52–100. Print. [Google Scholar]
- Lingle TR. 1986. The coffee cupper's handbook: a systematic guide to the sensory evaluation of coffee's flavor. Wash., D.C: Coffee Development Group. Print. [Google Scholar]
- Meilgaard MC, Dalgliesh CE, Clapperton JF. 1979. Beer flavour terminology. J Inst Brewing 85:38–42. [Google Scholar]
- (Mel) Suffet IH, Khiari D, Bruchet A. 1999. The drinking water taste and odor wheel for the millennium: beyond geosmin and 2‐methylisoborneol. Water Sci Technol 40(6):1–13. [Google Scholar]
- Noble AC, Arnold RA, Buechsenstein J, Leach EJ, Schmidt JO, Stern PM. 1987. Modification of a standardized system of wine aroma terminology. Am J Enol Vitic 38(2):143–6. [Google Scholar]
- Pagès J, Husson F. 2001. Inter‐laboratory comparison of sensory profiles: methodology and results. Food Qual Prefer 12(5–7):297–309. [Google Scholar]
- Rosenberg S, Kim MP. 1975. The method of sorting as a data‐gathering procedure in multivariate research. Multivariate Behav Res 10(4):489–502. [DOI] [PubMed] [Google Scholar]
- Sanchez Alan C. 2015. Development of a coffee lexicon and determination of differences among brewing methods [Master's thesis]. Kansas State Univ. Libraries. [Google Scholar]
- Steinberg DD. 1967. The word sort: an instrument for semantic analysis. Psychon Sci 8(12):541–2. [Google Scholar]
- Varela P, Ares G. 2012. Sensory profiling, the blurred line between sensory and consumer science. A review of novel methods for product characterization. Food Res Intl 48(2):893–908. [Google Scholar]
- World Coffee Research . 2016. World coffee research sensory lexicon: unabridged definitions and references. 1st ed College Station, Tex: World Coffee Research; in press. Available from: www.worldcoffeeresearch.org. Accessed 2016 June 7. [Google Scholar]