Abstract
Background
We designed and carried out this study to examine the role of miR-155 and the Rheb/mTOR pathway in ischemic stroke. We also investigated how these two elements interact with each other and contribute to injuries resulting from ischemic stroke.
Material/Methods
We used both a middle cerebral artery occlusion rat model in vivo and an oxygen-glucose deprivation cell model in vitro to simulate the onset of ischemic stroke. miR-155 mimics, miR-155 inhibitors, and Rheb siRNA were transfected to alter the expression of miR-155 and Rheb. Infarct sizes were measured using magnetic resonance imaging (MRI) and triphenyltetrazolium chloride (TTC) staining; cell apoptosis rates were calculated using Annexin V-FITC/PI staining and flow cytometry. Levels of miR-155, Rheb, mTOR, and S6K were examined by RT-PCR, immunofluorescence, and western blot. We performed a luciferase activity assay so that the association between miR-155 and Rheb could be fully assessed.
Results
We demonstrated that miR-155 bound the 3′-UTR of Rheb and suppressed Rheb expression. As suggested by animal models, significant cerebral infarct volumes and cell apoptosis were induced by increased expression of miR-155 and decreased expression of Rheb, mTOR, and p-S6K (P<0.05). miR-155 inhibitors exhibited protective effects on ischemic stroke, including down-regulation of infarction size in cerebral tissues in vivo and reduced apoptosis of BV2 cells in vitro with increased expression of Rheb, mTOR and p-S6K (P<0.05). These protective effects could be substantially antagonized by the transfection of Rheb siRNA (P<0.05).
Conclusions
Inhibition of miR-155 may play protective roles in ischemic stroke by phosphorylating S6K through the Rheb/mTOR pathway.
MeSH Keywords: Apoptosis; Infarction, Middle Cerebral Artery; MicroRNAs; Stroke; TOR Serine-Threonine Kinases
Background
Ischemic stroke (IS) is generally defined as part of a disease process that results in brain damage. It can be further classified as focal ischemia or global ischemia. Global ischemia is usually more severe than focal ischemia since it affects an extensive area of the brain [1]. Ischemic stroke which is accompanied by sudden cardiac arrest, cerebral arterial occlusion, or serious vasospasm, ranks as the third cause of deaths other than heart attack and cancer in the world [2,3]. Sudden blockage of a blood vessel by a thrombus is the most common reason for stroke, and it may lead to both immediate oxygen loss and glucose deficiency which are key to cerebral tissues [4]. In brief, ischemic stroke is triggered under conditions where the bloodstream is insufficient for metabolism [1]. Systemic thrombolysis using recombinants, for instance tissue profibrinolysin activating agents, remain the only proven treatment that is effective for managing IS patients[5]. Nevertheless, about 1–2% of IS patients could benefit from recombinants due to the increased risk of hematencephalon a few hours after stroke occurs [6]. Therefore, medical researchers are motivated to find new therapeutic targets for IS so that neural damage resulting from IS can be discovered at early stages or prevented.
Molecular and cellular mediators of neuroinflammatory reactions play important roles in the pathophysiology of IS since they exert either positive or negative roles during the recovery and repair process [7]. As a kind of small non-coding RNAs, microRNAs (miRNAs) are highly conserved in various eukaryotes and they regulate gene expression in a critical manner [8]. Evidence has suggested that miRNAs participate in regulating several inflammation phases as well as responses to cerebral ischemia [9–11]. MiRNA-155 (miR-155) is a key inflammation-related miRNA which is essential for regulating the host immune response since it represses the expression of target genes [12]. Given the significant influence of miR-155 in post-ischemic brain inflammation, understanding the role of miR-155 and its mechanisms in ischemic cerebral injury will provide us with an informative approach to tackle this disease. Recently, Kun Yang et al. has proven that Ras homolog enriched in brain (Rheb) is a novel functional target of miR-155 which attenuates both macrophage-mediated bacterial phagocytosis and intracellular killing [13]. Briefly, Rheb is a small GTP-binding protein which has been shown to mediate cell growth and control cell size in mammalian cells [14].
Mammalian target of rapamycin (mTOR), a serine/threonine kinase, regulates various biological activities such as cell growth and immunoreaction [15]. MTOR is also implicated in several neurological diseases including cerebral trauma, stroke, and neurodegenerative diseases [16]. Several studies have demonstrated that brain injuries caused by IS were related to the mTOR cell signaling pathway in which both mTOR complex 1 and mTOR complex 2 protein synthesis may be involved [17–20]. Furthermore, the mTOR pathway integrates with various environmental signals in order to regulate several biological processes including autophagy, ribosome biogenesis, transcription, and translation [21]. Variation in mTOR activity have also been found in cancer and neural diseases including epilepsy, cerebral trauma, Parkinson’s disease, and Alzheimer’s disease [22–26]. The activation of mTOR is regulated by Rheb [27]. Long et al. have found that Rheb-regulates mTOR signaling through the direct binding of Rheb-GTP with mTOR [28]. Furthermore, Wang et al. have reported that miR-155 was linked with Rheb in infectious diseases [12]. However, the lack of evidence with respect to the potential association between miR-155/Rheb/mTOR and stroke has inspired us to carry out this study.
Reduced blood flow volume during ischemia stimulates the synthesis of multiple proteins which regulate the ischemic process and participate in cellular reactions [4]. In this study, we explored how miR-155 affects Rheb/mTOR signaling pathways and their corresponding roles in IS.
Material and Methods
Animals
Sprague-Dawley (SD) rats (Laboratory Animal Center of Southern Medical University) with an average age of 2-3 months and average weight of 225–350 grams were used in this study. All rats were maintained under special pathogen-free conditions and they were supplied with free choice water and pelleted food. Animals were maintained under standard conditions with a 12 hour light-dark cycle, 60±5% humidity and 22±3°C ambient temperature. All rat experiments were adapted from the guidelines of the National Institute of Animal Use and Care Committee. Experiments were implemented strictly under the Guidance for Usage and Care of Laboratory Animals.
Middle cerebral artery occlusion (MCAO)
The MCAO model was established on SD rats according to instructions specified by previous reports [29]. In brief, rats were anesthetized using intraperitoneally injected 4% chloral hydrate. The common carotid artery (CCA) was exposed and isolated from rats and the MCAO model established using an intraluminal thread. Afterwards, a surgical midline incision was performed to expose the internal carotid artery (ICA), external carotid artery (ECA), and right CCA. A nylon suture (heparin-dampened monofilament, 0.26 mm diameter) was inserted into the right CCA lumen and then gently injected into the ICA for approximately 18 mm. Once the injection had been in place for 90 minutes, nylon sutures were gently removed from the ICA and reperfusion was performed. Once the above steps were successfully implemented, the neck incision was closed. An automatic homeothermic blanket control unit was used to constantly monitor and maintain the body temperature of rats at 37°C during the entire surgical procedure and post-surgery recovery. Rats in the control group with a sham operation received the same surgical procedures beside the insertion of the monofilament nylon suture.
Lentivirus transfection in animal models
Two groups of fragments separately containing miR-155 mimics and miR-155 inhibitors were cloned into the pCDH vector. The corresponding pCDH vectors were transfected into mice together with other essential packaging plasmids using a Lipofectamine LTX kit (Invitrogen, CA) and viral particles were collected 48 hours after transfection.
Lentivirus constructs (negative control (NC), miR-155 mimics, and miR-155 inhibitors) were injected into the lateral ventricle (LV) based on coordinates −2.0 to −2.5 mm dorsoventral, ±1.5 mm mediolateral and −0.5 mm anteroposterior from bregma 24 hours before MCAO surgery. Then all 48 rats were randomly allocated into 4 groups of equal size (n=12): control group (12 rats with sham operation and NC injected); model group (12 rats with MCAO and NC injected); miR-155 mimics group (12 rats with MCAO and miR-155 mimics injected); and miR-155 inhibitors group (12 rats with MCAO and miR-155 inhibitors injected).
Magnetic Resonance Imaging (MRI) examination in animal models
Rat brain was examined using a 3.0-Tesla MRI animal scanner (Siemens, Germany) which was implemented using a TIM system. For signal excitation and detection, the head of a rat was placed in a custom device with a 30 mm inner diameter. The parameters of the MRI were set as follows: 92 ms TE, 3620 ms TR, 8×8 cm FOV, 256×256 M, 2 NA, 2 mm thickness and 0 mm gap. The head of a rat was placed in a flat skull position and the rat brain was displayed in the center of the image slices. By calculating the “mean density value”, hemisphere intensity was examined using the Image-Pro Plus 5.0 software (Media Cybernetics, USA) after the optimal contrast adjustment. MRI examinations were carried out 24 hours after the MCAO surgery.
TTC staining for evaluating cerebral infarction in animal models
Rats were anesthetized by intraperitoneal injection of sodium pentobarbital (40 mg/kg), brains were removed and frozen at −20°C for 30 minutes. Tissues of frozen forebrains were dissected and coronally sliced into 2 mm slices from adult rat brain matrix (Kent Scientific Corporation, USA) using a rodent brain matrix slicer. These tissue slices were stained with 2% 2, 3, 7-triphenyltetrazolium chloride (TTC, Sigma, USA) at 37°C for 20 minutes under dark conditions, then slices were fixed in 4% paraformaldehyde phosphate buffer for 1 hour. The degree of cerebral infarction was represented by the ratio of infarct area to the area of the entire brain. The infarct brain area was represented by unstained (white) color whereas normal brain tissues were stained with red color. The Image J 1.46R software (NIH, USA) enabled us to determine the cerebral infarction status which was expressed as a ratio: infarct area (white)/total area (red).
Immunofluorescence in animal models
Before processing for histology assessment, brain tissues were treated with 30% sucrose solution and 4% paraformaldehyde for the purpose of perfusion. After tissues were frozen and sliced, they were treated with primary antibodies for Rheb (1:100, Zhongshan Biology Company, Beijing). The corresponding samples were incubated with the secondary antibody horseradish peroxidase-conjugated (HRP-conjugated) goat anti-rabbit IgG (1:800, Zhongshan Biology Company, Beijing). Samples were hydrated, washed, and analyzed by microscopy after they were visualized using diaminobenzidine (DAB, Sigma, USA).
Cell culture
The murine microglial cell line BV2 was purchased from the Institute of Biochemistry and Cell Biology (Shanghai). Cells were incubated in Dulbecco modified Eagle medium (DMEM, Gibco, CA) with supplemental glutamine (2 mmol/L, Invitrogen), penicillin (200 U/mL, Hyclone, USA), streptomycin (100 μg/mL, Hyclone) and 10% fetal bovine serum. Incubation was conducted at 37°C with 5% CO2.
Oxygen-glucose deprivation (OGD)
For the control group, BV2 cells were grown in complete DMEM media supplemented with 4.5 g/mL glucose under normoxic conditions (21% O2 and 5% CO2) for 18 hours. For the OGD group, BV2 cells were incubated in DMEM medium without the addition of glucose or serum under hypoxic conditions (5% CO2 and 95% N2) for 4 hours.
Cell transfection
The indicated plasmids were transfected into BV2 cells using Lipofectamine 2000 (Invitrogen). Once the transfection had been carried out for 24 hours, cells were cultured for 4 hours under conditions that were specified by the control or OGD group. Then cells were separately transfected with different vectors including miR-155 mimics, miR-155 inhibitors, and Rheb siRNA using Lipofectamine 2000 (Invitrogen). Finally, cells were grown under conditions specified by the control or OGD group.
BV2 cells were sub-grouped into 5 groups: control group (cells cultured under control conditions and transfection of indicated plasmids); OGD group (cells cultured under OGD conditions and transfection of indicated plasmids); miR-155 mimics group (cells cultured under OGD conditions and transfection of miR-155 mimics); miR-155 inhibitors group (cells cultured under OGD conditions and transfection of miR-155 inhibitors); and miR-155 inhibitors + Rheb siRNA group (cells cultured under OGD condition and transfection of miR-155 inhibitors + Rheb siRNA).
Cell apoptosis assay
Cell apoptosis was calculated after cells were stained by Annexin V-FITC/PI using an Apoptosis Detection Kit (BD Biosciences) and flow cytometry. Necrosis was represented by cells that were Annexin V positive and PI positive. Apoptosis was represented by cells that were Annexin V positive and PI negative. Normal cells were represented by cells that were Annexin V negative and PI negative.
Luciferase activity assay
The 3′ untranslated region (UTR) of Rheb which contains miR-155 binding sites was amplified using polymerase chain reaction (PCR). The PCR product was cloned into the psiCHECK-2 luciferase vector (Promega, USA) and the construct was named the Rheb 3′ UTR. The Gene Tailor Site-Directed Mutagenesis System (Invitrogen, USA) was implemented in order to mutate the corresponding binding sites, and the corresponding cloned mutant 3′ UTR was named the Rheb 3′ UTR mutation.
BV2 cells were stored in 48 well plates and then transfected with different vectors: one group was transfected with the combination of 200 ng pGL3-control luciferase reporter, 10 ng pRL-TK vector and miR-155 vector, while the miR-155 vector was replaced by the negative control vector in another group. Transfected cells were analyzed with the Dual-Luciferase Reporter Assay System (Promega, USA) once transfection had been carried out for 48 hours.
RNA isolation and RT-PCR
As suggested by the corresponding instructions, total RNA was isolated from tissues and cells using TRIzol reagent (Invitrogen, Germany). Total RNA was transcribed into cDNA using the ReverTra Ace qPCR RT Kit (Toyobo, Japan). Otherwise, RT-PCR was carried out using the THUNDERBIRD SYBR® qPCR Mix (Toyobo, Japan) with the CFX96 Touch Real-Time PCR Detection System (Bio-Rad, USA). Target gene expression was normalized to the expression of glyceraldehyde-3-phosphate dehydrogenase (GAPDH) and the 2−ΔΔCT method was used to quantify target gene expressions.
Western blot
Radio immunoprecipitation (RIPA) assay buffer enabled us to harvest and lyse tissues and cells. The Bradford method was used to separate and quantify total protein [30]. Once the separation by sodium dodecyl sulfate-polyacrylamide gel electrophoresis (SDS-PAGE) was completed, the bands were transferred onto Polyvinylidene Fluoride (PVDF) membranes. The membranes were blocked with 5% skim milk in Tris Buffered Saline Tween (TBST). After the transfer was carried out for one hour, primary antibodies against Rheb, mTOR, S6K and p-S6K were used to treat the membranes. Then, the bands were treated with secondary antibodies (horseradish peroxidase-conjugated goat anti-goat, 1:2000 dilutions, Zhongshan Biology Company, Beijing). Finally, the bands were visualized using enhanced chemiluminescence, and the results were analyzed by the Lab Works 4.5 software (Mitov Software).
Statistical analysis
Statistical analyses were conducted using SPSS 18.0 software (Chicago, Illinois, USA) and the data expressed as mean ± standard deviation (SD). Differences in continuous variables among groups were investigated by the two-tailed Student’s t-test or one-way analysis of variance (ANOVA) in which statistical significance was determined when the P-value of the corresponding statistical tests was less than 0.05.
Results
MRI examination outcomes
Since MRI is considered the most non-invasive and promising imaging modality, it was used to visualize and assess brain edema in rats once the MCAO models were established. As shown in Figure 1, the model and miR-155 mimics group exhibited obvious hyperintensity which was considered a type sign of brain edema. Although hyperintensity was detected in the miR-155 inhibitors group, the brain edema area in this group was less than the edema in the model and miR-155 mimics group.
Figure 1.
T2-weighted MRI images for rat brains in different groups: control (A), model (B), miR-155 mimics (C) and miR-155 inhibitors (D).
TTC staining outcomes
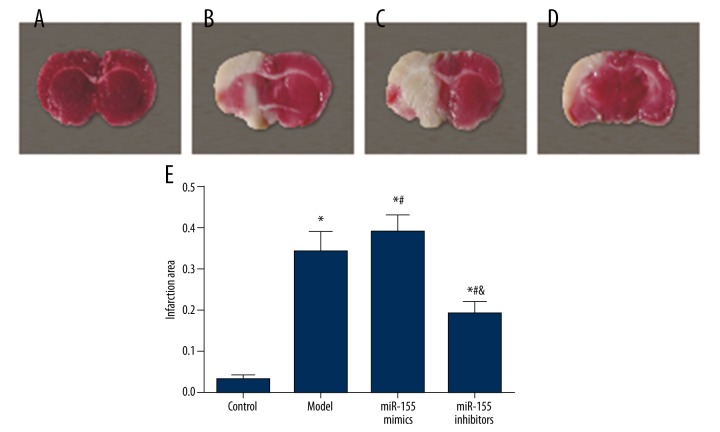
The infarction volume in the MCAO model rats was measured using TTC staining. As shown by Figure 2A–2D, normal brain tissues were stained in red whereas the infarction areas were stained in white. The model group exhibited a larger infarction area than the control group and this trend was significant in the miR-155 mimics group (P<0.05, Figure 2B). The infarction area in the miR-155 inhibitors group was significantly reduced (P<0.05, Figure 2B)
Figure 2.
TTC staining showed the area of ischemia-induced injury in cerebral tissues. (A–D) Representative photographs of TTC stained tissue samples of coronal brain in different groups, control (A), model (B), miR-155 mimics (C) and miR-155 inhibitors (D). (E) Summary of infarct size in cerebral brain tissues.Data were depicted as mean ± SD. * P<0.05 vs. the control group; # P<0.05 vs. the model group; & P<0.05 vs. themiR-155 mimics group.
Decreased Rheb expression after model establishment
As seen by immunofluorescence (Figure 3), Rheb was stained in brown. The percentage of positive area in the model and miR-155 mimics group was substantially lower than in the control group, whereas the opposite trend was reflected by the miR-155 inhibitors group which exhibited an increased positive area in comparison to the model and miR-155 mimics group.
Figure 3.
Immunohistochemistry staining with Rheb in brain tissues for different groups: control (A), model (B), miR-155 mimics (C), and miR-155 inhibitors (D).
Expression of miR-155, Rheb, and mTOR in rats
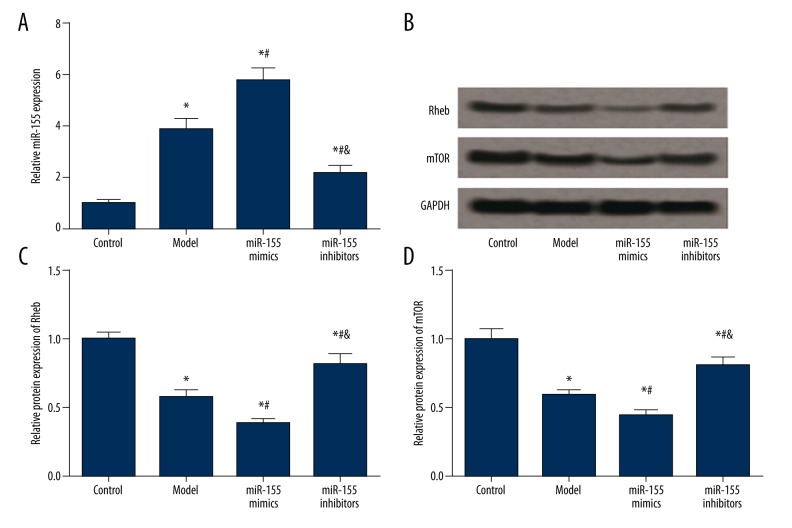
miR-155 expression in the model group was significantly higher than that in the control group, and the transfection of miR-155 mimics further up-regulated miR-155 expression (P<0.05, Figure 4A, Table 1).The miR-155 inhibitors group displayed remarkably decreased miR-155 expression compared with the model and miR-155 mimics group, while it has significantly higher level of miR-155 with respect to the control group (P<0.05, Figure 4A, Table 1).
Figure 4.
Expression of miR-155, Rheb and mTOR in brain tissues of model rats. (A) Quantified mRNA level of miR-155 in tissues for different groups (i.e. control, model, miR-155 mimics and miR-155 inhibitors). (B) Western blot analysis of Rheb and mTOR in tissues with GAPDH as the reference. (C, D) Quantified protein level of Rheb (C) and mTOR (D) in tissues. Data were displayed as mean ±SD. * P<0.05 vs. the control group; # P<0.05 vs. the model group; & P<0.05 vs. the miR-155 mimics group.
Table 1.
Expressions of miR-155, Rheb and mTOR in model rats.
| Group | Control | Model | miR-155 mimics | miR-155 inhibitors |
|---|---|---|---|---|
| miR-155 | 1.00±0.07 | 3.86±0.41* | 5.74±0.53*# | 2.16±0.28*#& |
| Rheb | 1.00±0.05 | 0.57±0.06* | 0.38±0.04*# | 0.82±0.08*#& |
| mTOR | 1.00±0.08 | 0.59±0.04* | 0.44±0.04*# | 0.81±0.06*#& |
P<0.05 versus control group;
P<0.05 versus model group;
P<0.05 versus miR-155 mimics group.
Model establishment and miR-155 transfection had similar effects on expression of Rheb and mTOR. The model group had significantly lower levels of Rheb and mTOR than the control group, and the miR-155 mimics group exhibited the lowest expressions of Rheb and mTOR among the four groups (P<0.05, Figure 4B–4D, Table 1). Transfection of miR-155 inhibitors dramatically up-regulated the expressions of Rheb and mTOR compared with the model and miR-155 mimics group, while the increased expressions of Rheb and mTOR were lower than those in the control group (P<0.05, Figure 4B–4D, Table 1).
Suppressed Rheb expression induced by the binding of miR-155 to 3′ UTR of Rheb
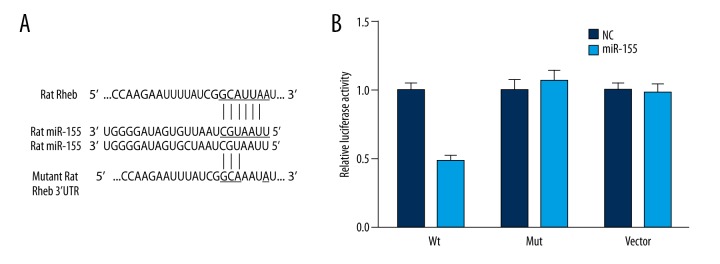
The online database (www.microrna.org) predicted a highly conserved miR-155 binding site located in the 3′-UTR of Rheb (Figure 5A). Binding of miR-155 to the endogenous 3′-UTR of Rheb in BV2 cells suppressed the relative luciferase activity (P<0.05). By contrast, no significant difference in the relative luciferase activity was observed between the miR-155 vector and NC group (P>0.05, Figure 5B, Table 2). Similarly, no significant difference was observed between the control and muation group.
Figure 5.
Prediction of binding sites and results from luciferase report betweenmiR-155 and Rheb. (A) Putative target sites predicted by online database (www.microrna.org). (B) Relative luciferase activity resulted from the corresponding binding of Rheb 3′ UTR reporter and miR-155 in BV2 cells after 48-hour transfection. * P<0.05 vs. the NC group. WT – wide type of Rheb-3′ UTR; Mut – Rheb mut-3′ UTR; NC – negative control.
Table 2.
Relative luciferase activity in wt HMGA2, Mut HMGA2 and vector groups.
| Relative luciferase activity | Wt | Mut | Vector |
|---|---|---|---|
| NC | 1.00±0.06 | 1.00±0.09 | 1.00±0.06 |
| miR-155 transfection | 0.48±0.05* | 1.07±0.08 | 0.98±0.07 |
Wt – wild type; Mut – mutation; NC – negative control.
P<0.05 vs. NC group.
Effects of miR-155 and Rheb on BV2 cell apoptosis
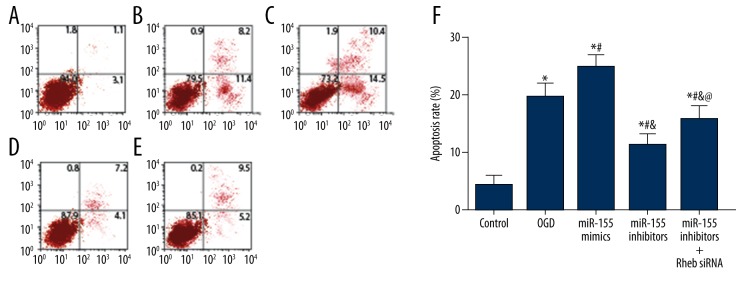
Results of annexin V-FITC/PI staining are shown in Figure 6 and the apoptosis status of BV2 cells was assessed. The control group had the lowest apoptosis rate whereas the miR-155 mimics group had the highest apoptosis rate (P<0.05). Moreover, cells induced by OGD exhibited a significantly increased apoptosis rate compared with the reference group (control) (P<0.05).Transfection of miR-155 inhibitors significantly decreased the apoptosis rate compared to the OGD and miR-155 mimics group, while this decrease in cell apoptosis rate was significantly antagonized by introducing Rheb siRNA into miR-155 inhibitors (P<0.05).
Figure 6.
Apoptosis rate of cells in each group estimated by flow cytometry. (A–E) Distribution of apoptotic cells in the control (A), OGD (B), miR-155 mimics (C), miR-155 inhibitors (D) and miR-155 inhibitors + Rheb siRNA (E) group. (F) Relative apoptosis rate of cells in each group. OGD – oxygen-glucose deprivation. Data were displayed in mean ±SD for three independent experiments. * P<0.05 vs. the control group; # P<0.05 vs. the OGD group; & P<0.05 vs. themiR-155 mimics group; @ P<0.05 vs. theiR-155 inhibitors group.
Expression of miR-155, Rheb, and mTOR in cells
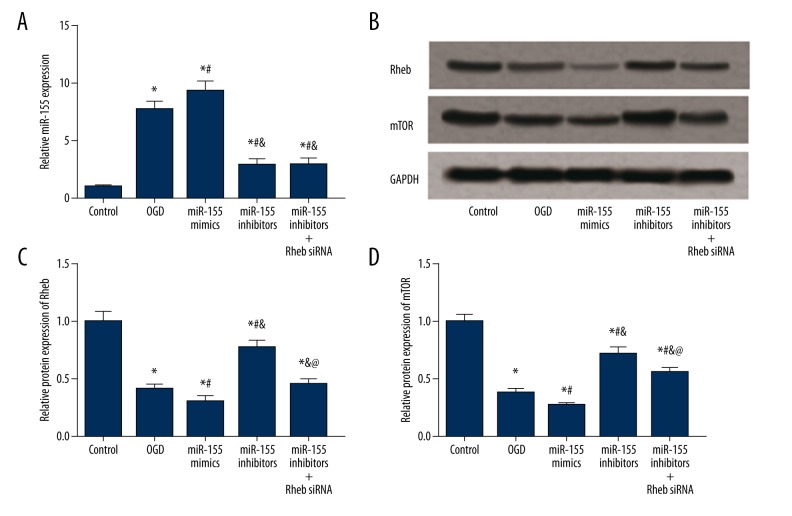
miR-155 expression in the model group was elevated in comparison to the control group, and this increase in the level of miR-155 appeared was significant in the miR-155 mimics group (P<0.05, Figure 7A, Table 3). Transfection of miR-155 inhibitors significantly down-regulated miR-155 expression (P<0.05) whereas introducing Rheb siRNA into miR-155 mimics had no significant effects on miR-155 expression (P>0.05, Figure 7A, Table 3). In the expression of Rheb and mTOR, the OGD group exhibited significantly lower levels of Rheb and mTOR compared to the control group, and the miR-155 mimics group had the lowest expressions of Rheb and mTOR among than the other four groups (P<0.05, Figure 7B–7D, Table 3). Transfection of miR-155 inhibitors up-regulated expressions of Rheb and mTOR compared with the model and miR-155 mimics group, while introducing Rheb siRNA into miR-155 inhibitors significantly suppressed the expression of Rheb and mTOR compared to those in the miR-155 inhibitors group (P<0.05, Figure 7B–7D, Table 3).
Figure 7.
Expression of miR-155, Rheb, and mTOR in BV2 cells after transfection. (A) Quantified mRNA level of miR-155 for different groups of cells (i.e. control, OGD, miR-155 mimics, miR-155 inhibitors and miR-155 inhibitors + Rheb siRNA). (B) Western blot analysis of Rheb and mTOR in tissues with GAPDH as the reference. (C, D) Quantified protein level of Rheb (C) and mTOR (D) in cells. Data were expressed in mean ±SD for three replicated experiments. * P<0.05 vs. the control group; # P<0.05 vs. the OGD group; & P<0.05 vs. the miR-155 mimics group; @ P<0.05 vs. theR-155 inhibitors group.
Table 3.
Expressions of miR-155, Rheb and mTOR in transfected BV2 cells.
| Group | Control | OGD | miR-155 mimics | miR-155 inhibitors | miR-155 inhibitors +Rheb siRNA |
|---|---|---|---|---|---|
| miR-155 | 1.00±0.13 | 7.69±0.74* | 9.32±0.83*# | 2.91±0.52*#& | 2.99±0.48*#& |
| Rheb | 1.00±0.09 | 0.42±0.04* | 0.31±0.04*# | 0.78±0.06*#& | 0.46±0.04*&@ |
| mTOR | 1.00±0.06 | 0.38±0.04* | 0.27±0.02*# | 0.72±0.06*#& | 0.56±0.04*#&@ |
OGD – oxygen-glucose deprivation.
P<0.05 vs. control group;
P<0.05 vs. OGD group;
P<0.05 vs. miR-155 mimics group;
P<0.05 versus miR-155 inhibitors group.
Effects of miR-155 and Rheb on expression of S6K and p-S6K
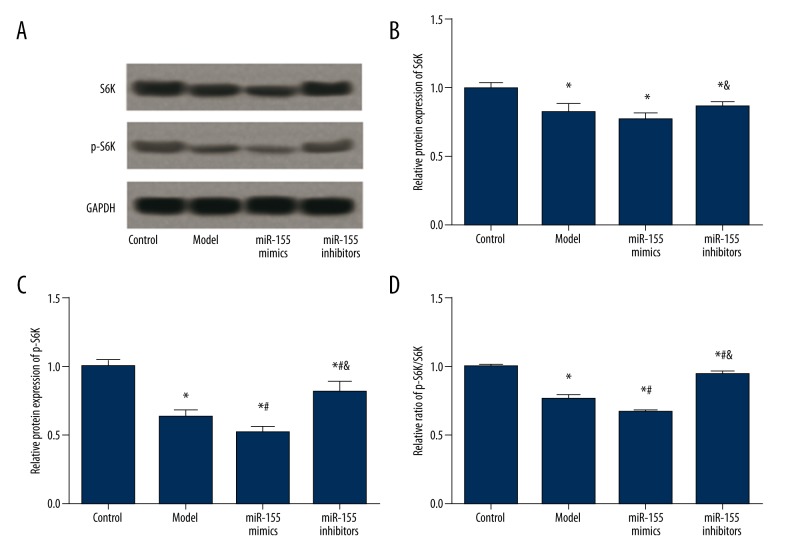
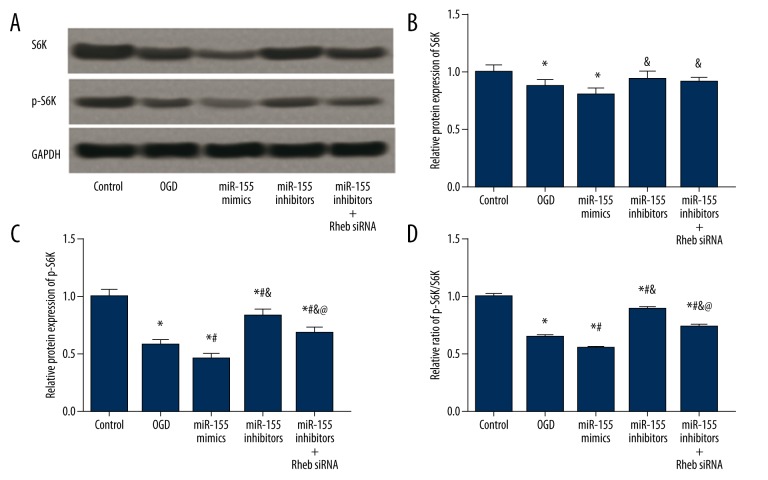
S6K and p-S6K expressions were examined in vivo and in vitro using western blot. Hypoxia and miR-155 transfection affected S6K expression. The model, miR-155 mimics, and the miR-155 inhibitors group had significantly lower S6K expression compared to the control group (P<0.05), while no significant difference in the S6K expression was identified among the above three groups (P>0.05, Figure 8A, 8B, Table 4). For BV2 cells, the OGD and miR-155 mimics group exhibited lower S6K levels than the control group, whereas the miR-155 inhibitors and miR-155 inhibitors + Rheb siRNA group exhibited higher S6K expression than the miR-155 mimics groups (P<0.05, Figure 9A, 9B, Table 5).
Figure 8.
Expressions of S6K and pS6K in brain tissues of model rats. (A) Western blot analysis of S6K and pS6K in tissues with GAPDH as the reference. (B, C) Quantified protein level of S6K (C) and p-S6K (D) in tissues. (D) Ratio of p-S6K/S6K in tissues. Data were displayed as mean ±SD. * P<0.05 vs. the control group; # P<0.05 vs. the model group; & P<0.05 vs. theR-155 mimics group.
Table 4.
Expressions of S6K and p-S6K in model rats.
| Group | Control | Model | miR-155 mimics | miR-155 inhibitors |
|---|---|---|---|---|
| S6K | 1.00±0.05 | 0.82±0.07* | 0.77±0.05* | 0.86±0.04*& |
| P-S6K | 1.00±0.06 | 0.63±0.05* | 0.52±0.04*# | 0.82±0.06*#& |
| P-S6K/S6K | 1.00±0.01 | 0.77±0.02* | 0.67±0.01*# | 0.95±0.01*#& |
P<0.05 vs. control group;
P<0.05 vs. model group;
P<0.05 vs. miR-155 mimics group.
Figure 9.
Expressions of S6K and pS6K in BV2 cells after transfection. (A) Western blot analysis of S6K and pS6K in cells with GAPDH as the reference. (B, C) Quantified protein level of S6K (C) and p-S6K (D) in cells. (D) Ratio of p-S6K/S6K in cells. Data were depicted as mean ±SD for three replicated experiments. * P<0.05 vs. the control group; # P<0.05 vs. the OGD group; & P<0.05 vs. the miR-155 mimics group; @ P<0.05 vs. the iR-155 inhibitors group.
Table 5.
Expressions of S6K and p-S6K in transfected BV2 cells.
| Group | Control | OGD | miR-155 mimics | miR-155 inhibitors | miR-155 inhibitors +Rheb siRNA |
|---|---|---|---|---|---|
| S6K | 1.00±0.07 | 0.88±0.06* | 0.81±0.05* | 0.94±0.06& | 0.92±0.04& |
| P-S6K | 1.00±0.06 | 0.58±0.04* | 0.46±0.04*# | 0.86±0.06*#& | 0.68±0.05*#&@ |
| P-S6K/S6K | 1.00±0.02 | 0.66±0.01* | 0.56±0.01*# | 0.91±0.01*#& | 0.74±0.02*#&@ |
P<0.05 vs. control group;
P<0.05 vs. OGD group;
P<0.05 vs. miR-155 mimics group;
P<0.05 versus miR-155 inhibitors group.
For p-S6K expressions, the model group had significantly lower p-S6K level and a lower ratio of p-S6K/S6K in comparison to the control group. Moreover, the miR-155 mimics group had further lowered p-S6K level than the model group, whereas transfection of miR-155 inhibitors significantly increased p-S6K expression as well as the p-S6K/S6K ratio (P<0.05, Figure 8C, 8D, Table 4). Expression of p-S6K in BV2 cells had a similar trend, except that p-S6K expression and the p-S6K/S6K ratio in the miR-155 inhibitors + Rheb siRNA group were lower than those in the control and miR-155 inhibitors group but higher than those in the OGD and miR-155 mimics group (P<0.05, Figure 9C, 9D, Table 5).
Discussion
Cerebral ischemia resulting from an acute blockage of arterial blood flow has been acknowledged as a major pathologicalgenesis of tissue damage in IS. Diminution of infarction area and generating new neuronal cells in damaged brain tissues are considered to be potential therapeutic approaches [31]. Identification of brain edema using MRI or CT has played a crucial role in improving the survival status of patients with IS [32]. It has been well established that inflammatory factors appear as major causes of neuronal apoptosis which is related to the pathophysiology of cerebral ischemia [2]. This study indicated that the miR-155-Rheb-mTOR pathway, another key cell apoptosis pathway, is involved in the pathological mechanisms of cerebral ischemia stroke.
Previous studies have indicated that miR-155 enforces different activities, such as SHIP1, SOCS1 and CCAAT/enhancer binding protein β under various pathological, physiological, and experimental conditions [33-35]. Moreover, miR-155 can modulate endothelium-dependent vasorelaxation and NO expressions in human umbilical vein endothelial cells by regulating the target gene of NOS [36]. Most miR-155 target genes have been established to be associated with the process of inflammatory regulation. For example, Wen et al. found that miR-155- mediated inflammatory responses in ischemic cerebral tissues by regulating TLR4/MyD88 and SOCS1 expression whereas ABL exerted its anti-inflammatory actions by suppressing miR-155 expression. Hence, the above evidence suggests that therapeutic approaches which target miR-155 are likely to be effective in IS [37]. As demonstrated by our study, miR-155 expression was up-regulated in both ischemic cerebral tissues extracted from MCAO rats and BV2 cells induced by OGD.In contrast, Rheb and mTOR expression were down-regulated. Transfection of miR-155 inhibitors suppressed miR-155 expression but enhanced Rheb and mTOR expression, playing a protective role in the lesion process of IS. These protective effects were characterized by reduced infarct size and apoptosis rate.
Rheb is a small GTPase that regulates cell survival, growth, and differentiation by up-regulating mammalian target of rapamycin complex 1 (mTORC1) signaling [38]. It is reported that Rheb expression was up-regulated in hepatocytes with hepatitis C virus infection, while Rheb expression was down-regulated in RAW264.7 cells treated with hydrogen peroxide [39,40]. A large number of studies confirmed the over-expression of Rheb in several cancer cell lines and oncogenic transformation can be triggered by Rheb mutants that are activated during the process of cell culture [41–44]. Furthermore, many researches reports indicated that TSC2GAP used Asn1643 to increase the hydrolysis of GTP by replacing Gln64 in an „Asn thumb”-type manner [45–47]. Moreover, studies have provided evidence that miR-155 binds up with the 3′ untranslated region of Rheb and then inhibits the expression of Rheb at a post-transcriptional level [48]. Our research provided consistent findings that miR-155 suppressed Rheb expression by binding with the 3′ UTR of Rhe, and Rheb siRNA transfection significantly antagonized the above effects both in vivo and in vitro.
Mechanistic target of mTOR signaling has emerged as a major signaling node that is abnormally activated in cancer, diabetes, and neurodegenerative diseases[49].MTOR, a non-typical serine/threonine protein kinase, consists of two distinct signaling complexes mTORC1 and mTORC2 which have different roles in regulating life activities. For instance, Schewe and Aguirre-Ghiso found that the ATF6-Rheb-mTOR pathway in dormant tumor cells may contribute to the elimination of residual disease during dormancy [50]. Shah et al. indicated that abnormal activation of the Rheb/mTOR/S6K pathway triggers a negative feedback program to inhibit IRS-dependent processes [51]. As suggested by Jiang et al., Rheb/mTORC1 signaling pathway enhanced the activation of kidney fibroblasts and had positive influences on the development of interstitial fibrosis [38]. Our study demonstrated that miR-155-Rheb-mTOR pathway was able to exert its protective effects on the lesions resulting from IS.
S6K is a major member of the AGC protein kinase family and it is a critical target of mTORC1 which consists of linker, kinase, C-terminal domains and acidic N-terminal [52,53]. Many researchers suggested that mTORC1 regulated mRNA translation by acting on its two targets: S6K and 4E-BP1 [53,54]. A large number of studies discovered that P-S6K stimulated mRNA translation by phosphorylating the subunit of ribosomal S6, while p-4E-BP1 in conjunction with other translational control proteins stimulated mRNA translation by releasing eIF4E to be linked with the 5′ end of mRNA [49,53,55]. Our study demonstrated that protective effects on the lesion process of IS triggered by the miR-155-Rheb-mTOR pathway might be related to the activation of its downstream signaling pathway through S6Kphosphorylation.
However, there were still some limitations in our research. Nevertheless, the downstream signaling pathways of the Rheb/mTOR pathway were not previously clearly understood.
Conclusions
In summary, miR-155 played a protective role in IS through the Rheb/mTOR pathway and this protective role may result from S6K phosphorylation which activates the downstream signaling pathway of Rheb/mTOR. Although we are unable to explain which part of the downstream signaling pathway is affected by S6K phosphorylation, this study still provided an informative explanation for the lesion process of IS and it may assist in developing early interventions for this disease.
Footnotes
Source of support: This study was funded by Shandong Province Excellent Young Scientist Research Award Fund [BS2012YY035]
References
- 1.Gusev EI, Skvortsova VI, Martynov M. [Cerebral stroke: problems and solutions]. Vestn Ross Akad Med Nauk. 2003;(11):44–48. [in Russian] [PubMed] [Google Scholar]
- 2.Macrez R, Ali C, Toutirais O, et al. Stroke and the immune system: from pathophysiology to new therapeutic strategies. Lancet Neurol. 2011;10:471–80. doi: 10.1016/S1474-4422(11)70066-7. [DOI] [PubMed] [Google Scholar]
- 3.Iadecola C, Anrather J. The immunology of stroke: From mechanisms to translation. Nat Med. 2011;17:796–808. doi: 10.1038/nm.2399. [DOI] [PMC free article] [PubMed] [Google Scholar]
- 4.Hori M, Nakamachi T, Rakwal R, et al. Unraveling the ischemic brain transcriptome in a permanent middle cerebral artery occlusion mouse model by DNA microarray analysis. Dis Model Mech. 2012;5:270–83. doi: 10.1242/dmm.008276. [DOI] [PMC free article] [PubMed] [Google Scholar]
- 5.Brott T, Bogousslavsky J. Treatment of acute ischemic stroke. N Engl J Med. 2000;343:710–22. doi: 10.1056/NEJM200009073431007. [DOI] [PubMed] [Google Scholar]
- 6.Wang Y, Zhang Z, Chow N, et al. An activated protein C analog with reduced anticoagulant activity extends the therapeutic window of tissue plasminogen activator for ischemic stroke in rodents. Stroke. 2012;43:2444–49. doi: 10.1161/STROKEAHA.112.658997. [DOI] [PMC free article] [PubMed] [Google Scholar]
- 7.Jin R, Yang G, Li G. Inflammatory mechanisms in ischemic stroke: Role of inflammatory cells. J Leukoc Biol. 2010;87:779–89. doi: 10.1189/jlb.1109766. [DOI] [PMC free article] [PubMed] [Google Scholar]
- 8.Taganov KD, Boldin MP, Baltimore D. MicroRNAs and immunity: Tiny players in a big field. Immunity. 2007;26:133–37. doi: 10.1016/j.immuni.2007.02.005. [DOI] [PubMed] [Google Scholar]
- 9.Xiao C, Rajewsky K. MicroRNA control in the immune system: Basic principles. Cell. 2009;136:26–36. doi: 10.1016/j.cell.2008.12.027. [DOI] [PubMed] [Google Scholar]
- 10.O’Connell RM, Rao DS, Chaudhuri AA, Baltimore D. Physiological and pathological roles for microRNAs in the immune system. Nat Rev Immunol. 2010;10:111–22. doi: 10.1038/nri2708. [DOI] [PubMed] [Google Scholar]
- 11.Zhu J, Yue H, Qiao C, Li Y. Association between single-nucleotide polymorphism (SNP) in miR-146a, miR-196a2, and miR-499 and risk of ischemic stroke: A meta-analysis. Med Sci Monit. 2015;21:3658–63. doi: 10.12659/MSM.895233. [DOI] [PMC free article] [PubMed] [Google Scholar]
- 12.Wang J, Yang K, Zhou L, et al. MicroRNA-155 promotes autophagy to eliminate intracellular mycobacteria by targeting Rheb. PLoS Pathog. 2013;9:e1003697. doi: 10.1371/journal.ppat.1003697. [DOI] [PMC free article] [PubMed] [Google Scholar]
- 13.Yang K, Wu M, Li M, et al. miR-155 suppresses bacterial clearance in Pseudomonas aeruginosa-induced keratitis by targeting Rheb. J Infect Dis. 2014;210:89–98. doi: 10.1093/infdis/jiu002. [DOI] [PubMed] [Google Scholar]
- 14.Tee AR, Manning BD, Roux PP, et al. Tuberous sclerosis complex gene products, Tuberin and Hamartin, control mTOR signaling by acting as a GTPase-activating protein complex toward Rheb. Curr Biol. 2003;13:1259–68. doi: 10.1016/s0960-9822(03)00506-2. [DOI] [PubMed] [Google Scholar]
- 15.Castilho RM, Squarize CH, Chodosh LA, et al. mTOR mediates Wnt-induced epidermal stem cell exhaustion and aging. Cell Stem Cell. 2009;5:279–89. doi: 10.1016/j.stem.2009.06.017. [DOI] [PMC free article] [PubMed] [Google Scholar]
- 16.Lu Q, Gao L, Huang L, et al. Inhibition of mammalian target of rapamycin improves neurobehavioral deficit and modulates immune response after intracerebral hemorrhage in rat. J Neuroinflammation. 2014;11:44. doi: 10.1186/1742-2094-11-44. [DOI] [PMC free article] [PubMed] [Google Scholar]
- 17.Prasad SS, Russell M, Nowakowska M. Neuroprotection induced in vitro by ischemic preconditioning and postconditioning: Modulation of apoptosis and PI3K-Akt pathways. J Mol Neurosci. 2011;43:428–42. doi: 10.1007/s12031-010-9461-7. [DOI] [PubMed] [Google Scholar]
- 18.Gao X, Ren C, Zhao H. Protective effects of ischemic postconditioning compared with gradual reperfusion or preconditioning. J Neurosci Res. 2008;86:2505–11. doi: 10.1002/jnr.21703. [DOI] [PubMed] [Google Scholar]
- 19.Gao X, Zhang H, Takahashi T, et al. The Akt signaling pathway contributes to postconditioning’s protection against stroke; The protection is associated with the MAPK and PKC pathways. J Neurochem. 2008;105:943–55. doi: 10.1111/j.1471-4159.2008.05218.x. [DOI] [PMC free article] [PubMed] [Google Scholar]
- 20.Ren C, Gao X, Niu G, et al. Delayed postconditioning protects against focal ischemic brain injury in rats. PLoS One. 2008;3:e3851. doi: 10.1371/journal.pone.0003851. [DOI] [PMC free article] [PubMed] [Google Scholar]
- 21.Harris TE, Lawrence JC., Jr TOR signaling. Sci STKE. 2003;2003:re15. doi: 10.1126/stke.2122003re15. [DOI] [PubMed] [Google Scholar]
- 22.Zeng LH, Rensing NR, Wong M. The mammalian target of rapamycin signaling pathway mediates epileptogenesis in a model of temporal lobe epilepsy. J Neurosci. 2009;29:6964–72. doi: 10.1523/JNEUROSCI.0066-09.2009. [DOI] [PMC free article] [PubMed] [Google Scholar]
- 23.Pan T, Kondo S, Zhu W, et al. Neuroprotection of rapamycin in lactacystin-induced neurodegeneration via autophagy enhancement. Neurobiol Dis. 2008;32:16–25. doi: 10.1016/j.nbd.2008.06.003. [DOI] [PubMed] [Google Scholar]
- 24.Malagelada C, Jin ZH, Jackson-Lewis V, et al. Rapamycin protects against neuron death in in vitro and in vivo models of Parkinson’s disease. J Neurosci. 2010;30:1166–75. doi: 10.1523/JNEUROSCI.3944-09.2010. [DOI] [PMC free article] [PubMed] [Google Scholar]
- 25.An WL, Cowburn RF, Li L, et al. Up-regulation of phosphorylated/activated p70 S6 kinase and its relationship to neurofibrillary pathology in Alzheimer’s disease. Am J Pathol. 2003;163:591–607. doi: 10.1016/S0002-9440(10)63687-5. [DOI] [PMC free article] [PubMed] [Google Scholar]
- 26.Chen S, Atkins CM, Liu CL, et al. Alterations in mammalian target of rapamycin signaling pathways after traumatic brain injury. J Cereb Blood Flow Metab. 2007;27:939–49. doi: 10.1038/sj.jcbfm.9600393. [DOI] [PubMed] [Google Scholar]
- 27.Bonneau A, Parmar N. Effects of RhebL1 silencing on the mTOR pathway. Mol Biol Rep. 2012;39:2129–37. doi: 10.1007/s11033-011-0960-6. [DOI] [PubMed] [Google Scholar]
- 28.Long X, Lin Y, Ortiz-Vega S, Yonezawa K, Avruch J. Rheb binds and regulates the mTOR kinase. Curr Biol. 2005;15:702–13. doi: 10.1016/j.cub.2005.02.053. [DOI] [PubMed] [Google Scholar]
- 29.Longa EZ, Weinstein PR, Carlson S, Cummins R. Reversible middle cerebral artery occlusion without craniectomy in rats. Stroke. 1989;20:84–91. doi: 10.1161/01.str.20.1.84. [DOI] [PubMed] [Google Scholar]
- 30.Qian X, Dong H, Hu X, et al. Analysis of the interferences in quantitation of a site-specifically PEGylated exendin-4 analog by the Bradford method. Anal Biochem. 2014;465:50–52. doi: 10.1016/j.ab.2014.06.009. [DOI] [PubMed] [Google Scholar]
- 31.Zhang P, Li W, Li L, et al. Treatment with edaravone attenuates ischemic brain injury and inhibits neurogenesis in the subventricular zone of adult rats after focal cerebral ischemia and reperfusion injury. Neuroscience. 2012;201:297–306. doi: 10.1016/j.neuroscience.2011.11.005. [DOI] [PubMed] [Google Scholar]
- 32.Dirnagl U, Iadecola C, Moskowitz MA. Pathobiology of ischaemic stroke: An integrated view. Trends Neurosci. 1999;22:391–97. doi: 10.1016/s0166-2236(99)01401-0. [DOI] [PubMed] [Google Scholar]
- 33.O’Connell RM, Chaudhuri AA, Rao DS, Baltimore D. Inositol phosphatase SHIP1 is a primary target of miR-155. Proc Natl Acad Sci USA. 2009;106:7113–18. doi: 10.1073/pnas.0902636106. [DOI] [PMC free article] [PubMed] [Google Scholar]
- 34.Wang P, Hou J, Lin L, et al. Inducible microRNA-155 feedback promotes type I IFN signaling in antiviral innate immunity by targeting suppressor of cytokine signaling 1. J Immunol. 2010;185:6226–33. doi: 10.4049/jimmunol.1000491. [DOI] [PubMed] [Google Scholar]
- 35.O’Connell RM, Rao DS, Chaudhuri AA, et al. Sustained expression of microRNA-155 in hematopoietic stem cells causes a myeloproliferative disorder. J Exp Med. 2008;205:585–94. doi: 10.1084/jem.20072108. [DOI] [PMC free article] [PubMed] [Google Scholar]
- 36.Sun HX, Zeng DY, Li RT, et al. Essential role of microRNA-155 in regulating endothelium-dependent vasorelaxation by targeting endothelial nitric oxide synthase. Hypertension. 2012;60:1407–14. doi: 10.1161/HYPERTENSIONAHA.112.197301. [DOI] [PubMed] [Google Scholar]
- 37.Wen Y, Zhang X, Dong L, et al. Acetylbritannilactone modulates microRNA-155-mediated inflammatory response in ischemic cerebral tissues. Mol Med. 2015;21:197–209. doi: 10.2119/molmed.2014.00199. [DOI] [PMC free article] [PubMed] [Google Scholar]
- 38.Jiang L, Xu L, Mao J, et al. Rheb/mTORC1 signaling promotes kidney fibroblast activation and fibrosis. J Am Soc Nephrol. 2013;24:1114–26. doi: 10.1681/ASN.2012050476. [DOI] [PMC free article] [PubMed] [Google Scholar]
- 39.Bose SK, Shrivastava S, Meyer K, et al. Hepatitis C virus activates the mTOR/S6K1 signaling pathway in inhibiting IRS-1 function for insulin resistance. J Virol. 2012;86:6315–22. doi: 10.1128/JVI.00050-12. [DOI] [PMC free article] [PubMed] [Google Scholar]
- 40.Seo G, Kim SK, Byun YJ, et al. Hydrogen peroxide induces Beclin 1-independent autophagic cell death by suppressing the mTOR pathway via promoting the ubiquitination and degradation of Rheb in GSH-depleted RAW 264.7 cells. Free Radic Res. 2011;45:389–99. doi: 10.3109/10715762.2010.535530. [DOI] [PubMed] [Google Scholar]
- 41.Eom M, Han A, Yi SY, et al. RHEB expression in fibroadenomas of the breast. Pathol Int. 2008;58:226–32. doi: 10.1111/j.1440-1827.2008.02215.x. [DOI] [PubMed] [Google Scholar]
- 42.Im E, von Lintig FC, Chen J, et al. Rheb is in a high activation state and inhibits B-Raf kinase in mammalian cells. Oncogene. 2002;21:6356–65. doi: 10.1038/sj.onc.1205792. [DOI] [PubMed] [Google Scholar]
- 43.Nardella C, Chen Z, Salmena L, et al. Aberrant Rheb-mediated mTORC1 activation and Pten haploinsufficiency are cooperative oncogenic events. Genes Dev. 2008;22:2172–77. doi: 10.1101/gad.1699608. [DOI] [PMC free article] [PubMed] [Google Scholar]
- 44.Jiang H, Vogt PK. Constitutively active Rheb induces oncogenic transformation. Oncogene. 2008;27:5729–40. doi: 10.1038/onc.2008.180. [DOI] [PMC free article] [PubMed] [Google Scholar]
- 45.Inoki K, Li Y, Xu T, Guan KL. Rheb GTPase is a direct target of TSC2 GAP activity and regulates mTOR signaling. Genes Dev. 2003;17:1829–34. doi: 10.1101/gad.1110003. [DOI] [PMC free article] [PubMed] [Google Scholar]
- 46.Marshall CB, Ho J, Buerger C, et al. Characterization of the intrinsic and TSC2-GAP-regulated GTPase activity of Rheb by real-time NMR. Sci Signal. 2009;2:ra3. doi: 10.1126/scisignal.2000029. [DOI] [PubMed] [Google Scholar]
- 47.Scrima A, Thomas C, Deaconescu D, Wittinghofer A. The Rap-RapGAP complex: GTP hydrolysis without catalytic glutamine and arginine residues. EMBO J. 2008;27:1145–53. doi: 10.1038/emboj.2008.30. [DOI] [PMC free article] [PubMed] [Google Scholar]
- 48.Zhou XJ, Dong ZG, Yang YM, et al. Limited diagnostic value of microRNAs for detecting colorectal cancer: A meta-analysis. Asian Pac J Cancer Prev. 2013;14:4699–704. doi: 10.7314/apjcp.2013.14.8.4699. [DOI] [PubMed] [Google Scholar]
- 49.Laplante M, Sabatini DM. mTOR signaling in growth control and disease. Cell. 2012;149:274–93. doi: 10.1016/j.cell.2012.03.017. [DOI] [PMC free article] [PubMed] [Google Scholar]
- 50.Schewe DM, Aguirre-Ghiso JA. ATF6alpha-Rheb-mTOR signaling promotes survival of dormant tumor cells in vivo. Proc Natl Acad Sci USA. 2008;105:10519–24. doi: 10.1073/pnas.0800939105. [DOI] [PMC free article] [PubMed] [Google Scholar]
- 51.Shah OJ, Wang Z, Hunter T. Inappropriate activation of the TSC/Rheb/mTOR/S6K cassette induces IRS1/2 depletion, insulin resistance, and cell survival deficiencies. Curr Biol. 2004;14:1650–56. doi: 10.1016/j.cub.2004.08.026. [DOI] [PubMed] [Google Scholar]
- 52.Fenton TR, Gout IT. Functions and regulation of the 70 kDa ribosomal S6 kinases. Int J Biochem Cell Biol. 2011;43:47–59. doi: 10.1016/j.biocel.2010.09.018. [DOI] [PubMed] [Google Scholar]
- 53.Magnuson B, Ekim B, Fingar DC. Regulation and function of ribosomal protein S6 kinase (S6K) within mTOR signalling networks. Biochem J. 2012;441:1–21. doi: 10.1042/BJ20110892. [DOI] [PubMed] [Google Scholar]
- 54.Teleman AA. Molecular mechanisms of metabolic regulation by insulin in Drosophila. Biochem J. 2010;425:13–26. doi: 10.1042/BJ20091181. [DOI] [PubMed] [Google Scholar]
- 55.Roux PP, Topisirovic I. Regulation of mRNA translation by signaling pathways. Cold Spring Harb Perspect Biol. 2012;4(11) doi: 10.1101/cshperspect.a012252. pii: a012252. [DOI] [PMC free article] [PubMed] [Google Scholar]


