Summary
Background
Lubiprostone (8 μg b.d.) received US Food and Drug Administration (FDA) approval in 2008 for the treatment of constipation‐predominant irritable bowel syndrome (IBS‐C) in women aged ≥18 years. In 2012, the FDA issued new guidance for IBS‐C clinical trials, recommending a composite endpoint incorporating both abdominal pain and stool frequency.
Aim
In a post hoc analysis, similar criteria were applied to data from two pivotal, phase 3, double‐blind, randomised trials of lubiprostone in patients with IBS‐C.
Methods
Included patients had a baseline spontaneous bowel movement (SBM) frequency <3/week and abdominal pain or bloating ratings ≥1.36 on a 5‐point scale [0 (absent) to 4 (very severe)]. Responders (composite endpoint) had a mean pain reduction ≥30% compared with baseline, and an increase from baseline of ≥1 SBM/week for ≥6 of the 12 treatment weeks. Lubiprostone effects on abdominal pain alone were also evaluated, as were bloating alone and in a composite endpoint with stool frequency.
Results
In pooled data, 325 patients received lubiprostone and 180 received placebo. Rates of response were higher with lubiprostone vs. placebo for the composite endpoint of improved pain and stool frequency (26.3% vs. 15.3%, respectively; P = 0.008) and the composite endpoint of improved bloating and stool frequency (23.8% vs. 12.6%, respectively; P = 0.012). Response rates were also higher with lubiprostone vs. placebo for abdominal pain alone (P = 0.005) and bloating alone (P = 0.012).
Conclusion
Lubiprostone was significantly more effective than placebo in improving abdominal pain or bloating, and also in composite endpoints that included stool frequency.
Introduction
Irritable bowel syndrome (IBS) is a functional bowel disorder that affects approximately 11% of individuals worldwide.1 The identifying symptoms of IBS are abdominal pain or discomfort associated with defecation or altered bowel habits, with supportive symptoms that may include bloating, straining, a feeling of incomplete bowel movements and urgency.2 IBS is categorised into three major subtypes based on stool consistency: IBS with predominant constipation (IBS‐C), IBS with predominant diarrhoea (IBS‐D) or mixed IBS (IBS‐M).2, 3
Pharmacological treatment options for patients with IBS‐C are limited,3 as only three agents, including lubiprostone, have received US Food and Drug Administration (FDA) approval, and one was subsequently withdrawn from US marketing.4, 5 Lubiprostone, an activator of the ClC‐2 chloride channel on the apical surface of enterocytes in the small intestine, was approved in 2008 for the treatment of IBS‐C (8 μg b.d.) in women ≥18 years of age.6 A combined analysis from two placebo‐controlled, 12‐week, phase 3 studies found that lubiprostone treatment was effective and well‐tolerated,7 and an open‐label extension study demonstrated a favourable safety and tolerability profile, and preliminary evidence of long‐term efficacy.3 The primary efficacy endpoint in these studies was calculated from weekly assessments of symptom relief based on a balanced scale ranging from significantly worse to significantly relieved.7 Monthly responders were defined as those who rated IBS symptoms as being at least moderately relieved for all weeks or significantly relieved for at least half of the weeks of the given month.7 In addition, responders could not rate symptoms as moderately or significantly worse.7 A patient was considered an overall responder if they were a monthly responder for at least two of the three study months.7 This endpoint has been considered relatively stringent.
In 2012, after the approval of lubiprostone for IBS‐C, the FDA issued a new guidance for industry for clinical studies in patients with IBS that recommended changes to study entry criteria and endpoints.8 Current guidance recommends that patients eligible for clinical studies of IBS‐C have a weekly average of worst daily abdominal pain (in past 24 h) score of ≥3.0 on a 0–10 scale and ≤3 complete spontaneous bowel movements (CSBMs) per week.8 Regarding study endpoints, prior studies used assessments such as the single‐item Subject's Global Assessment of Relief of IBS symptoms; these endpoints do not provide detailed symptom evaluations. Current guidance recommends the use of composite endpoints that measure the effect of treatment on abdominal pain and stool frequency, major defining features of IBS‐C.9 Treatment response is defined as achievement of a decrease ≥30% in weekly average score of worst abdominal pain in the past 24 h compared with baseline and an increase of ≥1 CSBM per week compared with baseline for ≥50% of treatment days or weeks.8
In consideration of the updated FDA guidance, we retrospectively analysed data from the two pivotal, placebo‐controlled, phase 3 studies of lubiprostone in patients with IBS‐C. The efficacy of lubiprostone for abdominal pain was assessed in patients with a baseline level of abdominal pain as specified in current guidance. The efficacy of lubiprostone for patients with abdominal bloating at baseline was similarly assessed. Finally, we evaluated the efficacy of lubiprostone using a composite endpoint of abdominal pain and stool frequency, reflecting current FDA recommendations for treatment response. A composite endpoint of bloating and stool frequency was also evaluated.
Methods
This post hoc analysis included data from two similarly designed phase 3, double‐blind, randomised, placebo‐controlled studies of lubiprostone in patients with IBS‐C (NCT00380250, NCT00399542). Study designs have been described in detail previously.7 Briefly, the studies consisted of a 4‐week baseline/screening period and a 12‐week treatment period in which patients were randomised to receive either lubiprostone (8 μg b.d.) or placebo.7 Patients in these pooled studies included men and women (nonpregnant and nonlactating) ≥18 years of age meeting the Rome II Modular Questionnaire criteria for IBS‐C.7 Patients who were excluded had previous gastrointestinal or abdominal surgery (except for common causes unrelated to IBS); organic disorders of the small or large intestine (e.g. ulcerative colitis, Crohn's disease); mechanical obstruction; or any medical condition associated with constipation other than IBS.7
Efficacy analyses
Each study was analysed separately and as a pooled analysis. All included patients had a spontaneous bowel movement (SBM) frequency <3/week at baseline. Improvement in abdominal pain by baseline abdominal pain score and improvement in bloating by baseline bloating score were evaluated in patients with baseline pain scores or baseline bloating scores, respectively, of ≥1.36 on a 5‐point scale [0 (absent) to 4 (very severe)]. A score of ≥1.36 on a 5‐point scale corresponds to the current FDA‐recommended trial entry criteria of baseline pain score of ≥3 on an 11‐point scale (0–10).8 In order to determine whether there were differential effects of lubiprostone related to different baseline pain or baseline bloating severity scores, subgroups of patients with respective baseline scores of ≥1.5, ≥2.0, ≥2.5 and ≥3.0 were also evaluated. Responders were defined as patients with ≥30% improvement (mean reduction in pain or bloating compared with baseline) for ≥6 weeks of the 12‐week treatment period.
Changes in abdominal pain and stool frequency were analysed as composite endpoints to match the treatment responder definition recommended by the FDA. A composite endpoint of bloating and stool frequency was also evaluated. Composite endpoints were analysed in a similar manner as individual endpoints (i.e. patients included in this analysis also had baseline pain or baseline bloating scores of ≥1.36 on a 5‐point scale and subgroups of patients with respective baseline scores of ≥1.5, ≥2.0, ≥2.5 and ≥3.0 were evaluated). Responders were defined as those having a mean pain or bloating score reduction ≥30% compared with baseline and an increase from baseline of ≥1 SBM/week for ≥6 of the 12 treatment weeks. Complete SBMs were not analysed because completeness of evacuation was not included as one of the assessments at the time these studies were conducted, which was prior to the issuance of FDA guidance.
Safety assessments
Treatment‐emergent adverse events (AEs) were recorded and evaluated for severity and relationship with treatment.
Statistical analyses
Efficacy analyses were performed in the intent‐to‐treat (ITT) population, defined as patients who were randomised to double‐blind treatment and received ≥1 dose of study medication. The Cochran–Mantel–Haenszel test stratified by pooled site was used to determine differences in response rates between patients treated with lubiprostone and those who received placebo. The last observation carried forward method was used to impute missing efficacy data. Safety analysis was performed in the safety population, defined as patients who received ≥1 dose of study medication; the analysis is based on the actual treatment received.
Results
Patients
The pooled ITT population with SBM frequency <3/week at baseline included 505 patients who were randomised to double‐blind lubiprostone treatment (8 μg b.d.; n = 325) or placebo (n = 180; Figure 1). Study 1 consisted of 170 and 88 patients randomised to lubiprostone treatment or placebo, respectively, and Study 2 consisted of 155 and 92 patients randomised to lubiprostone treatment or placebo respectively. In placebo and lubiprostone‐treatment patients combined, 68 (26.4%) and 54 (21.9%) patients discontinued therapy in Study 1 and Study 2 respectively. Demographic and baseline disease characteristics of patients in the ITT population were generally well balanced between the placebo and lubiprostone groups, as well as across the individual studies and the pooled analysis (Table 1). However, there was a significant difference in Study 2 for mean (s.d.) SBM frequency/week between patients who received lubiprostone [1.55 (0.87)] vs. placebo [1.32 (0.94)], P < 0.05.
Figure 1.
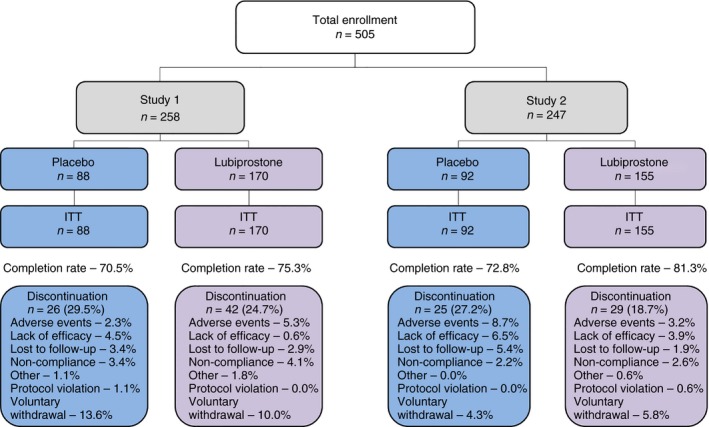
Patient disposition. ITT, intent‐to‐treat population.
Table 1.
Baseline demographic and clinical characteristics in two randomised, controlled studies of lubiprostone in patients with baseline SBM frequency <3/week (intent‐to‐treat populations)
| Study 1 | Study 2 | Pooled Studies | ||||
|---|---|---|---|---|---|---|
| Placebo (n = 88) | Lubiprostone (n = 170) | Placebo (n = 92) | Lubiprostone (n = 155) | Placebo (n = 180) | Lubiprostone (n = 325) | |
| Sex, n (%) | ||||||
| Female | 85 (96.6) | 161 (94.7) | 89 (96.7) | 143 (92.3) | 174 (96.7) | 304 (93.5) |
| Male | 3 (3.4) | 9 (5.3) | 3 (3.3) | 12 (7.7) | 6 (3.3) | 21 (6.5) |
| Mean (s.d.) age, years | 47.6 (12.4) | 45.8 (12.9) | 45.3 (12.0) | 44.8 (11.8) | 46.4 (12.2) | 45.4 (12.4) |
| Race/ethnicity, n (%) | ||||||
| White | 64 (72.7) | 117 (68.8) | 68 (73.9) | 112 (72.3) | 132 (73.3) | 229 (70.5) |
| Black/African American | 16 (18.2) | 28 (16.5) | 17 (18.5) | 33 (21.3) | 33 (18.3) | 61 (18.8) |
| Hispanic/Latino | 7 (8.0) | 25 (14.7) | 7 (7.6) | 10 (6.5) | 14 (7.8) | 35 (10.8) |
| Other | 1 (1.1) | 0 | 0 | 0 | 1 (0.6) | 0 |
| Mean (s.d.) abdominal discomfort/paina | 2.18 (0.69) | 2.27 (0.67) | 2.25 (0.63) | 2.14 (0.70) | 2.21 (0.66) | 2.21 (0.69) |
| Mean (s.d.) bloatinga | 2.37 (0.69) | 2.48 (0.69) | 2.40 (0.62) | 2.30 (0.74) | 2.39 (0.65) | 2.39 (0.72) |
| Mean (s.d.) SBM frequency/week | 1.49 (0.85) | 1.56 (0.91) | 1.32 (0.94) | 1.55 (0.87)b | 1.40 (0.90) | 1.56 (0.89) |
SBM, spontaneous bowel movement.
P values were calculated using a 2‐sample t‐test for continuous variables and a chi‐square test for categorical variables.
Scale from 0 (absent) to 4 (very severe).
P < 0.05 vs. placebo.
Abdominal pain and the response to lubiprostone
Response rates in the pooled population with a baseline pain score ≥1.36 were significantly higher for patients who received lubiprostone vs. placebo [36.7% (106/289) vs. 25.2% (41/163); P = 0.005; Figure 2]. Response rates with lubiprostone were also higher vs. placebo in patients with baseline abdominal pain scores ≥1.5, ≥2.0, ≥2.5, and ≥3.0, but possibly because of the small number of patients with a baseline pain score of ≥3.0, the response rate was not significant at the highest baseline pain level. In the individual studies, treatment response rates between patients with a baseline pain score ≥1.36 who received lubiprostone vs. placebo were not significantly different; Study 1: 35.3% (54/153) vs. 24.7% (19/77) respectively; Study 2: 38.2% (52/136) vs. 25.6% (22/86) respectively (Table S1). Although not statistically significant, the treatment response rates of the individual studies were similar to the response rates observed in the pooled study population.
Figure 2.
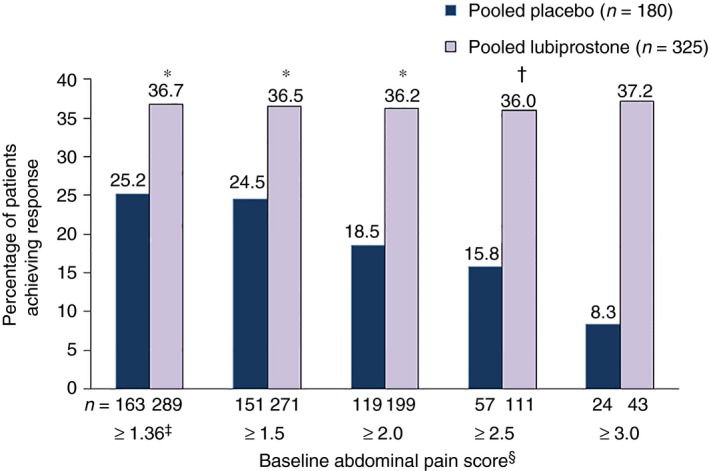
Treatment response rates in patients with baseline abdominal pain scores ≥1.36. Treatment response defined as ≥30% improvement in abdominal pain vs. baseline for ≥6 of 12 treatment weeks by baseline abdominal pain score (pooled data). *P < 0.01. † P < 0.05. ‡Equivalent to 3 on a scale of 0–10. §Scale from 0 (absent) to 4 (very severe). P values compare placebo vs. lubiprostone, based on the Cochran–Mantel–Haenszel test stratified by pooled site.
Bloating and the response to lubiprostone
Response rates in the pooled population with a baseline bloating score ≥1.36 were significantly higher in patients receiving lubiprostone compared with placebo [32.0% (97/303) vs. 20.4% (42/167); P = 0.012; Figure 3). In patients with higher baseline bloating scores (≥1.5, ≥2.0, ≥2.5 and ≥3.0), response rates with lubiprostone remained significantly higher than with placebo, except in patients in the ≥2.5 and ≥3.0 subgroups where a numerical difference was observed. In Study 2, treatment response rates between patients with a baseline bloating score ≥1.36 who received lubiprostone vs. placebo were significantly different [34.5% (48/139) vs. 17.2% (15/87) respectively; P = 0.019]; however, the difference in Study 1 was not significant [29.9% (49/164) vs. 23.8% (19/80) respectively (Table S2)].
Figure 3.
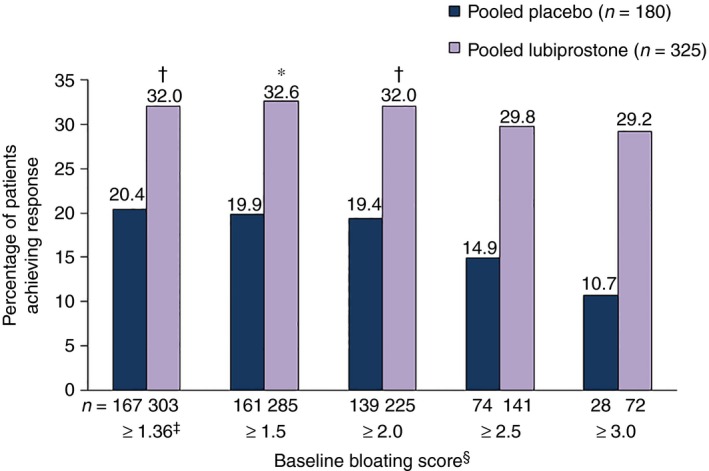
Treatment response rates in patients with baseline bloating scores ≥1.36. Treatment response defined as ≥30% improvement in bloating vs. baseline for ≥6 of 12 treatment weeks by baseline bloating score (pooled data). *P < 0.05. † P < 0.01. ‡Equivalent to 3 on a scale of 0–10. §Scale from 0 (absent) to 4 (very severe). P values compare placebo vs. lubiprostone, based on the Cochran–Mantel–Haenszel test stratified by pooled site.
Composite endpoints
Abdominal pain and stool frequency
Composite response rates were significantly higher in the pooled population with a baseline pain score ≥1.36 who received lubiprostone vs. placebo [26.3% (76/289) vs. 15.3% (25/163); P = 0.008; Figure 4]. Response rates with lubiprostone remained significantly higher vs. placebo in patients in baseline abdominal pain subgroups ≥1.5 and ≥2.0, but not in the ≥2.5 and ≥3.0 subgroups, where a numerical difference was observed. In Study 1, composite response rates between patients with a baseline pain score ≥1.36 who received lubiprostone vs. placebo were significantly different [25.5% (39/153) vs. 13.0% (10/77) respectively; P = 0.034]; however, the difference in Study 2 was not significant [27.2% (37/136) vs. 17.4% (15/86) respectively], although absolute differences between lubiprostone and placebo response rates were similar in the two studies (Table S3).
Figure 4.
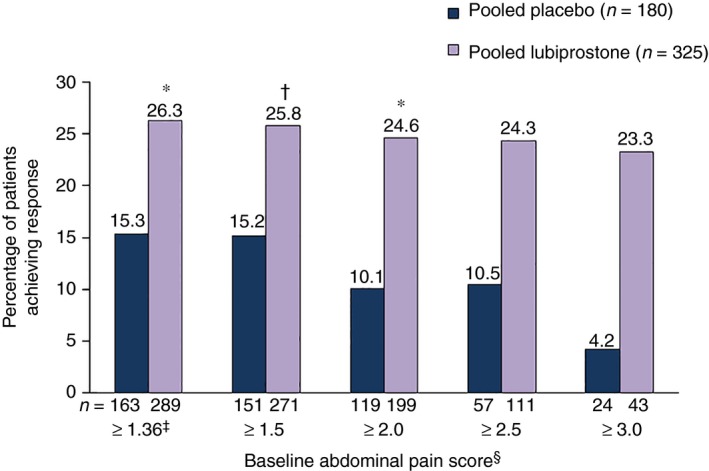
Treatment response rates in patients with baseline abdominal pain scores ≥1.36 using a composite endpoint. Composite treatment response defined as ≥30% improvement in abdominal pain and ≥1 increase in spontaneous bowel movements per week vs. baseline for ≥6 of 12 treatment weeks by baseline abdominal pain score (pooled data). *P < 0.01. † P < 0.05. ‡Equivalent to 3 on a scale of 0–10. §Scale from 0 (absent) to 4 (very severe). P values compare placebo vs. lubiprostone, based on the Cochran–Mantel–Haenszel test stratified by pooled site.
Bloating and stool frequency
Composite response rates in the pooled population with baseline bloating score ≥1.36 were significantly higher for patients who received lubiprostone vs. placebo [23.8% (72/303) vs. 12.6% (21/167); P = 0.012; Figure 5]. Response rates with lubiprostone remained higher vs. placebo for patients in baseline bloating score subgroups ≥1.5 and ≥2.0, but not in the ≥2.5 and ≥3.0 subgroups, where a numerical difference was observed. Composite response rates for patients with a baseline bloating score ≥1.36 were not significantly different between patients who received lubiprostone vs. placebo in Study 1 [23.2% (38/164) vs. 13.8% (11/80) respectively] or Study 2 [24.5% (34/139) vs. 11.5% (10/87) respectively (Table S4)].
Figure 5.
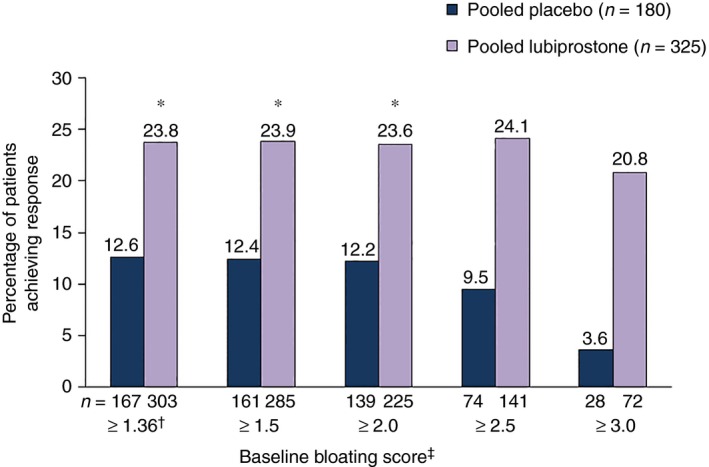
Treatment response rates in patients with baseline bloating scores ≥1.36, using a composite endpoint. Composite treatment response defined as ≥30% improvement in bloating and ≥1 increase in spontaneous bowel movements per week vs. baseline for ≥6 of 12 treatment weeks by baseline abdominal pain score (pooled data). *P < 0.05. †Equivalent to 3 on a scale of 0–10. ‡Scale from 0 (absent) to 4 (very severe). P values compare placebo vs. lubiprostone, based on the Cochran–Mantel–Haenszel test stratified by pooled site.
Pooled safety evaluation
At least one treatment‐emergent AE was reported by 49.4% of patients who received lubiprostone and 45.3% who received placebo. The most frequently reported treatment‐emergent AEs in the overall pooled population were gastrointestinal in nature and included nausea (7.9%), diarrhoea (4.4%) and abdominal pain (4.4%). The frequency of these AEs in patients receiving lubiprostone treatment vs. placebo, respectively, were nausea, 9.3% vs. 5.5%; diarrhoea, 4.9% vs. 3.3%; and abdominal pain, 3.7% vs. 5.5%. Of note, one patient in the pooled population, a patient who received lubiprostone, experienced an AE of severe diarrhoea. Study discontinuation due to diarrhoea occurred in two patients overall, one who received placebo and one who was treated with lubiprostone.
Discussion
In this analysis, treatment with lubiprostone significantly improved abdominal pain compared with placebo in patients with a baseline abdominal pain level corresponding to the current FDA‐recommended trial entry criteria for baseline abdominal pain. Furthermore, lubiprostone significantly improved bloating vs. placebo in patients with a baseline bloating score of ≥1.36 on a 5‐point scale, a baseline bloating level that corresponds to that recommended by the FDA for baseline abdominal pain. Response rates for the composite endpoint recommended by current guidance, improvement in abdominal pain and stool frequency, were significantly higher in patients who received lubiprostone compared with those who received placebo. Response rates for the composite endpoint of bloating and stool frequency also were higher with lubiprostone treatment vs. placebo.
The effects of lubiprostone vs. placebo were explored in subgroups of patients with higher intensity pain or bloating scores at baseline (≥1.5, ≥2.0, ≥2.5 and ≥3.0 on a 5‐point scale) than those corresponding to the FDA entry criteria (≥1.36 on a 5‐point scale). In the pooled analyses, significant differences favouring lubiprostone treatment vs. placebo were seen in patient subgroups with higher baseline pain or bloating scores (e.g. those with scores ≥2.0 at baseline), and absolute differences in response rates with lubiprostone vs. placebo were larger in subgroups with higher baseline pain or bloating scores. Lack of statistical significance in subgroups with baseline scores of ≥2.5 or ≥3.0 may be related to small sample sizes (the number of patients in each subgroup decreased with increased baseline score) as the difference in effect size between the study arms was preserved in these subgroups.
Safety findings from the two pivotal studies have been described elsewhere.7 In this pooled analysis, as has been reported, the most common AEs were gastrointestinal, and lubiprostone was generally well‐tolerated. Severe diarrhoea and study discontinuation due to diarrhoea were seldom seen; each occurred in one patient who had received lubiprostone. In a randomised, 26‐week study of linaclotide, diarrhoea was the most common treatment‐emergent AE, occurring significantly more often with linaclotide (19.7%; 79/402) compared with placebo (2.5%; 10/403). A total of eight patients (2%) experienced severe diarrhoea with linaclotide vs. none with placebo, and linaclotide was associated with study drug discontinuation in 18 patients (4.5%) who received linaclotide and one patient (0.2%) who received placebo.10 Lubiprostone and linaclotide have not been compared directly in the same population; however, the available evidence suggests that diarrhoea is not a concern with lubiprostone treatment.
We faced a number of challenges in retrospectively applying current FDA guidance to our lubiprostone data set. Among the most important was that SBMs, not CSBMs (current guidance), were collected as an endpoint in lubiprostone studies. In studies which evaluated linaclotide in patients with IBS‐C, the relative difference between SBM vs. CSBM frequency at baseline was approximately 1:9.10, 11 Regarding change in SBM compared with CSBM frequency with treatment, however, the percentage of patients who experienced ≥1 increase in SBMs per week with linaclotide was approximately 1.5–2 times higher than the percentage who experienced ≥1 increase in CSBM.10, 11 These results suggest that a composite measure using SBMs would lead to a higher responder rate than if CSBMs were used. However, it should be noted that entry criteria for the lubiprostone studies compared with more recent studies were quite different even in the selected population analysed here (patients had to have an SBM frequency <3/week at baseline), and the baseline weekly SBM frequency was 1.5, which is lower than in patients who participated in studies of linaclotide (1.8).11 Therefore, a ≥1 increase in SBMs per week in lubiprostone studies could be a clinically relevant finding.
Finally, the dose of lubiprostone (8 μg b.d.) used in pivotal phase 3 studies and approved for the treatment of IBS‐C is lower than the 24 μg b.d. dose of lubiprostone that is approved for the treatment of patients with chronic idiopathic constipation or opioid‐induced constipation.6 The lower dose of lubiprostone used in these IBS‐C studies compared with the dose approved for patients with chronic idiopathic constipation or opioid‐induced constipation may play a role in the 10–14% lower response rate observed using the composite endpoint compared with using the abdominal pain only responder definition. In a phase 2 dose‐ranging trial evaluating the efficacy of lubiprostone in IBS‐C, the 24 μg, but not 8 μg, b.d. dosage was associated with significantly greater improvement in abdominal pain/discomfort scores vs. placebo at month 1, although both doses showed similar improvement in months 2–3.12 However, the higher dose of lubiprostone was also associated with a higher incidence of adverse events and as such the 8 μg b.d. dose is considered optimal for providing the benefit of efficacy with limited (low incidence and intensity) adverse events in IBS‐C. It should be noted that the lubiprostone IBS‐C studies were designed in accordance with Rome II criteria, which defined the hallmark symptom of IBS as abdominal pain, with reduced stool frequency as one of a number of criteria that a patient may report in order to qualify for an IBS diagnosis.13
In conclusion, lubiprostone was significantly more effective than placebo in improving abdominal pain based on baseline abdominal pain scores, and bloating based on baseline bloating scores. Despite the challenges involved in applying new criteria to historical data, treatment with lubiprostone significantly improved the composite endpoint of improvements in abdominal pain (by baseline pain scores) and stool frequency in patients with IBS‐C. A composite endpoint evaluating improvement in bloating (by baseline bloating score) and stool frequency also found lubiprostone to be significantly more effective than placebo. These results were achieved despite the trials having been designed to apply a dose (8 μg b.d.) more suitable for treatment of pain; this dose was lower than one that would have been administered with the intention of showing a more profound effect on bowel movement frequency.
Authorship
Guarantor of the article: Lin Chang.
Author contributions: Lin Chang made substantial contributions to the analysis and interpretation of the data, provided critical revision of the paper and approved the final and submitted versions of the paper. William D. Chey contributed to the analysis and interpretation of the data, provided critical review of the manuscript and approved the final submitted manuscript. Douglas Drossman contributed to the study designs, reviewed the data, made revisions to the manuscript and approved the final submitted version. Taryn Losch‐Beridon contributed to the study designs and to the analysis and interpretation of the data, provided critical review of the manuscript and approved the final submitted version. Martin Wang generated the data analyses, reviewed the submitted version, and approved the final submitted version. Peter Lichtlen contributed to the analysis and interpretation of the data, provided critical review of the manuscript and approved the final submitted manuscript. Shadreck Mareya participated in the planning of the manuscript, analysis and interpretation of data, review of manuscript drafts, and approval of the final submitted manuscript.
Supporting information
Table S1. Treatment response rate (percentage of patients with ≥30% improvement in abdominal pain vs. baseline for ≥6 of 12 treatment weeks by baseline abdominal pain score) in Studies 1 and 2 in patients with baseline abdominal pain scores ≥1.36.
Table S2. Treatment response rate (percentage of patients with ≥30% improvement in bloating vs. baseline for ≥6 of 12 treatment weeks by baseline bloating score) in Studies 1 and 2 in patients with baseline bloating scores ≥1.36.
Table S3. Treatment response rate in Studies 1 and 2 in patients with baseline abdominal pain scores ≥1.36 using a composite endpoint defined as ≥30% improvement in abdominal pain and ≥1 increase in spontaneous bowel movements per week vs. baseline for ≥6 of 12 treatment weeks by baseline abdominal pain score.
Table S4. Treatment response rate in patients with baseline bloating scores ≥1.36, using a composite endpoint in Studies 1 and 2 defined as ≥30% improvement in bloating and ≥1 increase in spontaneous bowel movements per week vs. baseline for ≥6 of 12 treatment weeks by baseline abdominal pain score.
Acknowledgements
This study and the additional analyses were sponsored by Sucampo Pharma Americas, LLC, Bethesda, MD, and Takeda Pharmaceuticals International, Deerfield, IL. Writing and editorial support was provided by Patrick Little, PhD, and Mariana Ovnic, PhD, of Complete Publication Solutions, LLC (North Wales, PA, USA) and was funded by Takeda Pharmaceuticals International, Inc.
Declaration of personal interests: LC was an advisory board member for Allergan, Ardelyx, AstraZeneca, Commonwealth Laboratories, Ironwood Pharmaceuticals, QOL Medical, Salix, Synergy and Takeda Pharmaceuticals. WDC has served as a consultant to Allergen, Ardelyx, AstraZeneca, Forest Laboratories, Inc., Ironwood Pharmaceuticals, Inc., Nestle, Prometheus Laboratories, Inc., SK biopharmaceuticals, Sucampo and Takeda Pharmaceuticals, and has received research grant support from Ironwood Pharmaceuticals, Inc., Nestle, Prometheus, and Perrigo. DD has served on advisory boards for AstraZeneca, QOL Medical LLC, Salix Pharmaceuticals and Takeda Pharmaceuticals. TLB, MW, SM and PL are employees and stock option holders of Sucampo Pharmaceuticals, Inc.
Declaration of funding interests: This study and the additional analyses were sponsored by Sucampo Pharma Americas, LLC, Bethesda, MD, and Takeda Pharmaceuticals International, Deerfield, IL.
The Handling Editor for this article was Professor Alexander Ford, and it was accepted for publication after full peer‐review.
References
- 1. Lovell RM, Ford AC. Global prevalence of and risk factors for irritable bowel syndrome: a meta‐analysis. Clin Gastroenterol Hepatol 2012; 10: 712–21; e4. [DOI] [PubMed] [Google Scholar]
- 2. Longstreth GF, Thompson WG, Chey WD, Houghton LA, Mearin F, Spiller RC. Functional bowel disorders. Gastroenterology 2006; 130: 1480–91. [DOI] [PubMed] [Google Scholar]
- 3. Chey WD, Drossman DA, Johanson JF, Scott C, Panas RM, Ueno R. Safety and patient outcomes with lubiprostone for up to 52 weeks in patients with irritable bowel syndrome with constipation. Aliment Pharmacol Ther 2012; 35: 587–99. [DOI] [PubMed] [Google Scholar]
- 4. Jadallah KA, Kullab SM, Sanders DS. Constipation‐predominant irritable bowel syndrome: a review of current and emerging drug therapies. World J Gastroenterol 2014; 20: 8898–909. [DOI] [PMC free article] [PubMed] [Google Scholar]
- 5. Bielefeldt K, Levinthal DJ, Nusrat S. Effective constipation treatment changes more than bowel frequency: a systematic review and meta‐analysis. J Neurogastroenterol Motil 2016; 22: 31–45. [DOI] [PMC free article] [PubMed] [Google Scholar]
- 6. Amitiza® (Lubiprostone). Full Prescribing Information, Sucampo Pharma Americas, LLC and Takeda Pharmaceuticals America, Inc., Bethesda, MD, and Deerfield, IL, 2013.
- 7. Drossman DA, Chey WD, Johanson JF, et al Clinical trial: lubiprostone in patients with constipation‐associated irritable bowel syndrome–results of two randomized, placebo‐controlled studies. Aliment Pharmacol Ther 2009; 29: 329–41. [DOI] [PubMed] [Google Scholar]
- 8. US Food and Drug Administration . Guidance for Industry Irritable Bowel Syndrome‐Clinical Evaluation of Drugs for Treatment. Rockville, MD: US Department of Health and Human Services; 2012. [Google Scholar]
- 9. Trentacosti AM, He R, Burke LB, Griebel D, Kennedy DL. Evolution of clinical trials for irritable bowel syndrome: issues in end points and study design. Am J Gastroenterol 2010; 105: 731–5. [DOI] [PubMed] [Google Scholar]
- 10. Chey WD, Lembo AJ, Lavins BJ, et al Linaclotide for irritable bowel syndrome with constipation: a 26‐week, randomized, double‐blind, placebo‐controlled trial to evaluate efficacy and safety. Am J Gastroenterol 2012; 107: 1702–12. [DOI] [PubMed] [Google Scholar]
- 11. Lacy BE, Lembo AJ, Macdougall JE, et al Responders vs clinical response: a critical analysis of data from linaclotide phase 3 clinical trials in IBS‐C. Neurogastroenterol Motil 2014; 26: 326–33. [DOI] [PMC free article] [PubMed] [Google Scholar]
- 12. Johanson JF, Drossman DA, Panas R, Wahle A, Ueno R. Clinical trial: phase 2 study of lubiprostone for irritable bowel syndrome with constipation. Aliment Pharmacol Ther 2008; 27: 685–96. [DOI] [PubMed] [Google Scholar]
- 13. The Rome Foundation . Appendix B: Comparison Table of Rome II & Rome III Adult Diagnostic Criteria. The Rome Foundation; 2006: 899‐915. Available at http://www.romecriteria.org/assets/pdf/20_RomeIII_apB_899-916.pdf (accessed 2/4/2016).
Associated Data
This section collects any data citations, data availability statements, or supplementary materials included in this article.
Supplementary Materials
Table S1. Treatment response rate (percentage of patients with ≥30% improvement in abdominal pain vs. baseline for ≥6 of 12 treatment weeks by baseline abdominal pain score) in Studies 1 and 2 in patients with baseline abdominal pain scores ≥1.36.
Table S2. Treatment response rate (percentage of patients with ≥30% improvement in bloating vs. baseline for ≥6 of 12 treatment weeks by baseline bloating score) in Studies 1 and 2 in patients with baseline bloating scores ≥1.36.
Table S3. Treatment response rate in Studies 1 and 2 in patients with baseline abdominal pain scores ≥1.36 using a composite endpoint defined as ≥30% improvement in abdominal pain and ≥1 increase in spontaneous bowel movements per week vs. baseline for ≥6 of 12 treatment weeks by baseline abdominal pain score.
Table S4. Treatment response rate in patients with baseline bloating scores ≥1.36, using a composite endpoint in Studies 1 and 2 defined as ≥30% improvement in bloating and ≥1 increase in spontaneous bowel movements per week vs. baseline for ≥6 of 12 treatment weeks by baseline abdominal pain score.


