Abstract
Background
Different extents and locations of acetabular cartilage defect have been supposed to be a major cause of undesirable outcomes of periacetabular osteotomy (PAO) in patients with developmental dysplasia of the hip (DDH). This study aimed to verify whether different locations of cartilage deficiency affect the biomechanical environment in a three-dimensional model utilizing finite element analysis (FEA).
Material/Methods
We developed 3 DDH models – DDH-1 (normal shape), DDH-2 (superior defect), and DDH-3 (anterosuperior defect) – by deforming from a normal hip model. We also developed 3 PAO models – PAO-1, PAO-2, and PAO-3 – through rotating osteotomized fragments.
Results
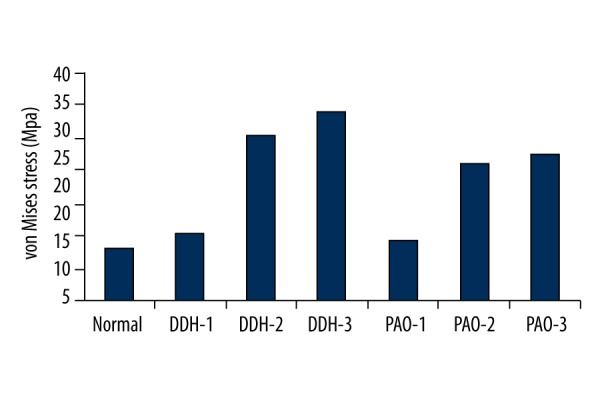
The maximum von Mises stress in the normal hip was 13.06 MPa. In the DDH-1 model, the maximum value on the load-bearing area decreased from 15.49 MPa pre-PAO to 14.28 MPa post-PAO, while stresses in the DDH-2 and DDH-3 models were higher than in the DDH-1 model, both pre-PAO and post-PAO (30.46 MPa to 26.04 MPa for DDH-2; 33.89 MPa to 27.48 MPa for DDH-3).
Conclusions
This study shows that, both pre- and post-PAO, different types of cartilage deficiency affect the biomechanical environment. Furthermore, in dysplastic hips, obtaining accurate three-dimensional information about the acetabular cartilage can contribute substantially to PAO decision making.
MeSH Keywords: Bone Diseases, Developmental; Cartilage, Articular; Finite Element Analysis; Osteotomy
Background
Developmental dysplasia of the hip (DDH) is a major cause of osteoarthrosis in adolescent and adult patients [1,2]. Currently, periacetabular osteotomy (PAO), a widely employed surgical treatment for DDH, is performed to provide ideal acetabular coverage of the femoral head [3]. However, it is estimated that the 10-year success rate of PAO is 87%, and the 20-year rate is 61% [4], which are suboptimal results, considering the young age at which many patients undergo the PAO procedure. Current thinking holds that several factors may potentially result in undesirable outcomes of PAO [4,5], such as patient age, grade of osteoarthritis, and skill and experience of the surgeon.
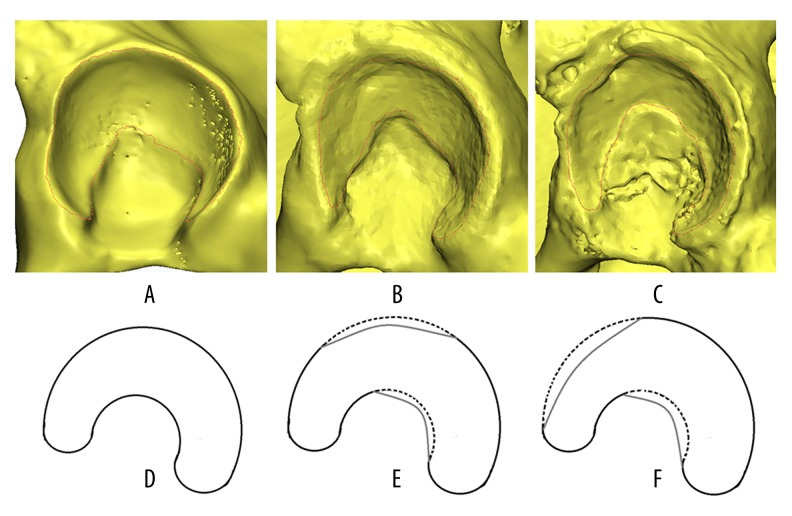
Recently, variability in the extent of acetabular cartilage development has received increasing research interest and has been investigated as a major cause [6]. Steppacher et al. [7] found that patients with acetabular dysplasia had a clearly decreased lunate surface size, decreased outer acetabular rim, and increased acetabular fossa. Van Bosse et al. [8] concluded that dysplastic cartilages were related to global deficiency, not deficiency in just a single dimension. Moreover, Hiroshi Ito et al. [9] categorized acetabular morphologic deficiencies as anterior deficiency, posterior deficiency, and lateral deficiency through three-dimensional (3D) computed tomography (CT). Based on these views, we retrospectively analyzed the imaging data of patients with poor post-PAO outcomes. Interestingly, we found obviously irregular defects on the outer edge of the acetabular lunate in these patients, especially in the superior and anterosuperior regions (Figure 1). With decreased size of the lunate surface, it is understandable that the weight-bearing area of the femoral head could not be completely covered by the articular cartilage, even though the PAO can provide sufficient acetabular coverage.
Figure 1.
Normal shape and different defect regions of the acetabular cartilage. Steppacher et al. [7] found that acetabular dysplasia was associated with a clearly decreased size of the lunate surface, decreased outer acetabular rim, and increased acetabular fossa. (A, B) Show a normally shaped acetabular cartilage (lunate surface) of a 24-year-old male, which we used as the normal FEA model [11]; (C, D) Show a superior defect of the lunate surface of a 16-year-old female DDH patient; (E, F) show an anterosuperior defect of the lunate surface of a 21-year-old female DDH patient. At about 1 year after PAO, both patients evidenced poor clinical outcomes.
Recently, FEA has been employed in the study of hip joint mechanical behavior and pre-clinical testing of DDH [6,10–13]. Zhao et al. [11] generated a series of FEA models of dysplastic hips created through deforming the acetabular rim of a normal hip to investigate the effects of PAO. Zou et al. [6] developed a 3D FEA of PAO generated from CT scans of 5 DDH hips to analyze contact area, pressure, and von Mises stress in the femoral and acetabular cartilages. However, there is no published research related to the variability of the abnormal shape among real dysplastic acetabula. Therefore, we developed FE simulation of DDH models with theoretical anterosuperior defect (ASD) and superior defect (SD) of the acetabular lunate surface generated from imaging of normal hips, based on our previous work [11], to verify whether different configurations of cartilage deficiency affect the biomechanical environment pre- and post-PAO. This work may enable surgeons to provide patients with personalized preoperative planning of PAO.
Material and Methods
Three DDH models (ASD, SD, and normal shape) were developed from the model created in previous work [11]. The 3 models had the same CE angles, but differently shaped acetabular cartilage defects. Based on those DDH models, 3 PAO models were developed individually. Mimics 14.1 (Materialise, Leuven, Belgium) and MSC.Marc/Mentat2005r3 (MSC Software, Santa Ana, CA, USA) were used for the development and analysis of these models. The patients involved in this study all provided informed consent and this study was approved by our institutional review board.
Normal and DDH FE models
Briefly, the normal model (Figure 2) was generated from a 24-year-old male (with informed consent) without clinical or radiological abnormalities. The presupposed target center-edge (CE) angle and anterior center-edge (ACE) angle in this model were both 25 degrees. The average thickness of the cartilage layer was determined to be 2 mm [14]. The articular surface was considered as a nonlinear, frictionless, 3D contact problem. The area of acetabular cartilage, excluding the fossa, was 2070.1 mm2. The main linear elastic and isotropic material properties of cortical bone, trabecular bone, cartilage, and acetabular labrum are shown in Table 1 [11,15,16]. Approximately, 600 000 tetrahedral elements and 120 000 nodes were used.
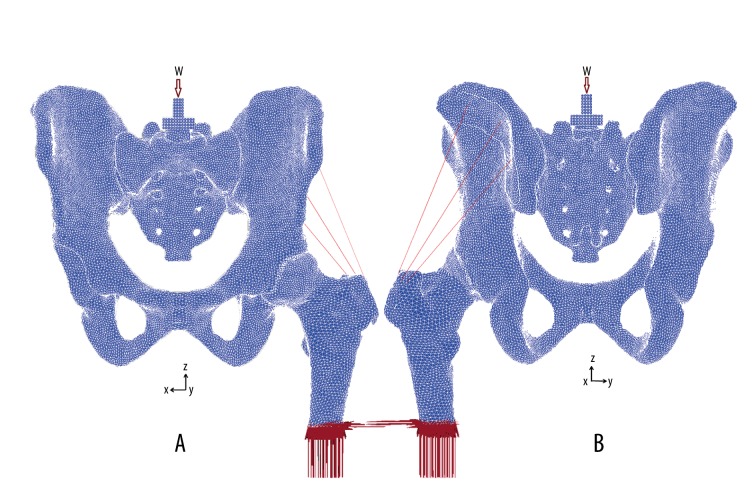
Figure 2.
FEA model of a normal hip. A 2-mm average thickness was assumed for the articular cartilage layer of the femoral head and acetabulum. CE angle and VCA angle are both 25 degrees. (A) Frontal view: the load was applied on the center of the sacral mount. W – body weight. Shaded areas were fixed in all directions. (B) Back view: mounts were placed over the attachment of the middle gluteal muscle.
Table 1.
Element types and material properties of the normal model.
| Materials | Element type | Number of element | Young’s modulus (E: MPa) | Poisson’s ratio (ν) |
|---|---|---|---|---|
| Cortical bone | Solid | 288613 | 17 000 | 0.3 |
| Trabecular bone | Solid | 282588 | 70 | 0.2 |
| Articular cartilage | Solid | 21839 | 15 | 0.45 |
| Acetabular labrum | Solid | 2613 | 15 | 0.45 |
| Pubic symphysis | Solid | 15 | 0.45 | |
| Sacroiliac | Solid | 15 | 0.45 | |
| Mount | Solid | 69 000 | 0.35 | |
| Articular surface | Contact | Frictionless |
The 3 DDH models with decreased coverage of acetabular cartilage were generated by deforming the acetabular rim toward the posteromedial direction of the normal hip model. The presupposed target CE angle and ACE angle were both 10 degrees. Compared to the normal hip, the DDH-1 model had the same acetabular cartilage shape but less contact area (1585.4 mm2). The shape of the acetabular cartilage of the 2 other models – DDH-2 and DDH-3 – were trimmed to the superior defect and anterosuperior defect, respectively. However, the 3 models had similar acetabular cartilage area through adding certain elements in the acetabular fossae. The area of acetabular cartilage in the superior defect model (DDH-2) was 1523.23 mm2 and in the anterosuperior defect model (DDH-3) it was 1492.67 mm2 (Figure 1).
Post-PAO model
First, PAO were implemented in clinical settings by rotating the acetabular bone fragment around the femoral head anterolaterally until the target CE and VCA angles were 25 degrees. Then, the osteotomized fragments were re-meshed. Thus, the DDH-1, DDH-2, and DDH-3 models were rotated by 15 degrees in the anterolateral direction to create PAO-1, PAO-2, and PAO-3, respectively.
Boundary and loading conditions
The boundary and loading conditions were based on single-leg stance [6,17,18]. Vertically, a load of 620 N (body weight of 74 kg) was placed on the center of the superior aspect of the sacral mount. The simulated abductor force of the middle gluteal muscle was defined as 460 N [19] (Figure 2). The sacral mount was fixed on the transverse plane, and the distal femur was fixed in all directions. For nonlinear analysis, force control was used as the numerical procedure. The Newton-Raphson method was applied as an iterative method, applying the load in 20 steps by an incremental loading method.
Results
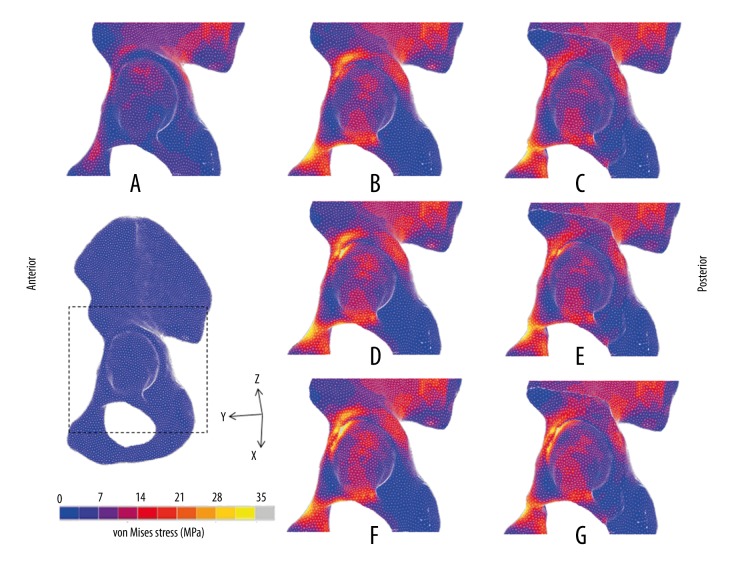
Stress distribution on the acetabular cortical bone (Figures 3, 4).
Figure 3.
von Mises stress distributions on surface of acetabular bones in DDH models. (A) Normal; (B) DDH-1; (C) PAO-1; (D) DDH-2; (E) PAO-2; (F) DDH-3; (G): PAO-3.
Figure 4.

Maximum value of von Mises stress on the surface of the acetabulum in the FEA models.
In the normal hip, the von Mises stress showed a uniform distribution pattern, mainly distributed in dispersed fashion on the superior region of the lunate surface, and mostly concentrated on the intermediate region. The maximum value was 13.06 MPa. However, the von Mises stress in the 3 DDH models concentrated intensively on the edge of the acetabulum, which was higher than in the normal model. The maximum value of von Mises stress on the load-bearing area of the acetabulum decreased from 15.49 MPa pre-PAO to 14.28 MPa post-PAO in the DDH-1 model. The maximum value in DDH-2 fell from 30.46 MPa pre-PAO to 26.04 MPa post-PAO. The maximum value in DDH-3 decreased from 33.89 MPa pre-PAO to 27.48 MPa post-PAO. Although the 3 models were adjusted to the same angle, the stress on the anterosuperior edge of the acetabulum in DDH-1 became dispersed after surgery, while the stress in the DDH-2 and DDH-3 models remained concentrated on this region.
Discussion
Severe acetabular dysplasia has been proven to be prone to progression to hip osteoarthritis [2,20,21]. In DDH patients, the shallow acetabulum may cause increased stress on the cartilage matrix [22–24]. PAO is widely applied in patients with DDH because the acetabular osteotomy fragment is rotated in the anterolateral direction to cover the femoral head load-bearing area through the preserved articular cartilage. Generally, PAO can decrease the maximum stress on the load-bearing area and, subsequently, improve the biomechanical environment of the hip joint [11]. However, PAO can result in unsatisfactory outcomes [25]. There are several potential factors that can lead to undesirable outcomes of PAO in patients with DDH [5,25,26]. Acetabular cartilage insufficiency of varying extents appears to be a major cause [6]. Hiroshi Ito et al. [9] demonstrated different defects of acetabular cartilage.
Given the above, the present study aimed to verify whether different types of acetabular cartilage deficiency affect the overall hip joint biomechanical environment, both pre- and post-PAO. The normal and DDH-1 models were generated through previous work [11]. Based on clinical work, we first developed the DDH-2 and DDH-3 models (Figure 1). Postoperatively, the maximum value of von Mises stress on the load-bearing area of the acetabulum decreased from 15.49 MPa pre-PAO to 14.28 MPa post-PAO in the DDH-1 model, which was close to the normal value (13.06 MPa). The stress concentration area also shifted from the lateral portion pre-PAO to the medial portion post-PAO, which showed satisfactory outcomes, as previously reported [6,27]. The von Mises stress distribution on the acetabulum in the DDH-2 model (superior defect) decreased to some extent (the maximum value fell from 30.46 MPa pre-PAO to 26.04 MPa post-PAO). The stress concentration area was still distributed on the anterosuperior edge of the acetabulum, not as ideal as in the DDH-1 model, which could cause biomechanical environment disorder of the hip due to high contact stress (Figures 3, 4). Zou et al. [6] reported that the stress was reduced by 13.4% post-PAO of a 15-degree-rotation in a patient with a CE angle of 10 degree. Moreover, the von Mises stress on the acetabulum in the DDH-3 model (anterosuperior defect) barely improved (the maximum value decreased from 33.89 MPa pre-PAO to 27.48 MPa post-PAO). Therefore, stress concentration might be a crucial reason for the development of osteoarthritis in some DHH patients post-PAO [25,28].
Zou et al. [6] reported that about 25 degrees would be the optimal CE angle for rotational osteotomy based on FEA, which closely approximates the study results of Armiger et al. [27]and Steppacher et al. [4]. In our DDH-1 model with normally shaped acetabular cartilage, the target CE angle post-PAO was also 25 degrees. Because the DDH-2 and DDH-3 models originated from the DDH-1 model, these models had similar CE and ACE angles, similar acetabular cartilage areas, the same PAO surgery, and the same boundary and loading conditions. Post-PAO, the outcome in models with different extents and locations of acetabular cartilage defect (DDH-2 with superior defect and DDH-3 with anterosuperior defect) was not as satisfactory as in the DDH-1 model (normal shape of acetabular cartilage). These findings showed that dysplastic hips (superior or anterosuperior side), even treated with the “optimal 25 degrees,” still can cause long-term hip osteoarthritis due to the stress concentration on the outer edge. This suggests a limitation in the application of PAO for treating patients with severe defect of the outer rim of dysplastic cartilage.
Acetabular reorientation is the most important and difficult step during PAO. Even with the ideal angle, the femoral weight-bearing area cannot be completely covered by acetabular cartilage due to the decreased size of the lunate surface. Hence, the superior and anterior coverage should be simultaneously guaranteed during PAO, according to the morphology of the lunate surface in hip dysplasia. However, excessive coverage might result in femoroacetabular impingement [29]. It is essential to execute accurate preoperative design for planning individualized osteotomy. It appears that detailed 3D information about the acetabular weight-bearing surface, namely the lunate surface, is crucial for preoperative assessment for PAO. So far, the precise morphology of the lunate surface has only been discussed in the normal hip, not in the dysplastic hip [30,31]. In the future, we plan to evaluate 3D morphology of the acetabular lunate surface in patients with DDH and to make possible real optimal preoperative planning of PAO through FEA and an intraoperative navigation system [18]. Through these effects, optimum coverage of the weight-bearing area of the femoral head might be achieved with cartilaginous congruency. The acetabular osteotomy bone fragments might then be effectively reoriented to diminish contact stress per unit area, contributing to more satisfactory postoperative prognoses.
The present study had several limitations. First, the models used were only involved in rough superior and anterosuperior defects. Due to deficiency of acetabular coverage, DDH might lead to dysplastic and usually aspherical femoral head [32,33]. Thus, it is necessary to ascertain accurate morphology of dysplastic acetabular cartilage and its matchability to the femoral head. Second, the DDH model deformities were derived from the normal hip model, which was not suited for revealing the abnormal anatomy of the femoral head and acetabulum in patients with dysplastic hips. The post-PAO models were only generated by 25 degrees of rotation. We will develop individual DDH models in the future.
Conclusions
In conclusion, this study shows that different types of cartilage deficiency, such as anterosuperior or superior defects, affect the biomechanical environment both pre- and post-PAO in 3D FE analysis. It is crucial to acquire accurate and comprehensive 3D information on the size and shape of the acetabular cartilage in dysplastic hips to better inform surgeons who are making decisions regarding PAO procedures.
Footnotes
Source of support: Departmental sources
References
- 1.Hartofilakidis G, Karachalios T, Stamos KG. Epidemiology, demographics, and natural history of congenital hip disease in adults. Orthopedics. 2000;23(8):823–27. doi: 10.3928/0147-7447-20000801-16. [DOI] [PubMed] [Google Scholar]
- 2.Jacobsen S, Sonne-Holm S, Soballe K, et al. Hip dysplasia and osteoarthrosis: A survey of 4151 subjects from the Osteoarthrosis Substudy of the Copenhagen City Heart Study. Acta Orthop. 2005;76(2):149–58. doi: 10.1080/00016470510030517. [DOI] [PubMed] [Google Scholar]
- 3.Trousdale RT, Cabanela ME. Lessons learned after more than 250 periacetabular osteotomies. Acta Orthop Scand. 2003;74(2):119–26. doi: 10.1080/00016470310013824. [DOI] [PubMed] [Google Scholar]
- 4.Steppacher SD, Tannast M, Ganz R, Siebenrock KA. Mean 20-year followup of bernese periacetabular osteotomy. Clin Orthop Relat Res. 2008;466(7):1633–44. doi: 10.1007/s11999-008-0242-3. [DOI] [PMC free article] [PubMed] [Google Scholar]
- 5.Troelsen A, Elmengaard B, Soballe K. Medium-term outcome of periacetabular osteotomy and predictors of conversion to total hip replacement. J Bone Joint Surg Am. 2009;91(9):2169–79. doi: 10.2106/JBJS.H.00994. [DOI] [PubMed] [Google Scholar]
- 6.Zou Z, Chavez-Arreola A, Mandal P, et al. Optimization of the position of the acetabulum in a ganz periacetabular osteotomy by finite element analysis. J Orthop Res. 2013;31(3):472–79. doi: 10.1002/jor.22245. [DOI] [PubMed] [Google Scholar]
- 7.Steppacher SD, Lerch TD, Gharanizadeh K, et al. Size and shape of the lunate surface in different types of pincer impingement: Theoretical implications for surgical therapy. Osteoarthritis Cartilage. 2014;22(7):951–58. doi: 10.1016/j.joca.2014.05.010. [DOI] [PubMed] [Google Scholar]
- 8.van Bosse H, Wedge JH, Babyn P. How are dysplastic hips different? A three-dimensional CT study. Clin Orthop Relat Res. 2015;473(5):1712–23. doi: 10.1007/s11999-014-4103-y. [DOI] [PMC free article] [PubMed] [Google Scholar]
- 9.Ito H, Matsuno T, Hirayama T, Tanino H, et al. Three-dimensional computed tomography analysis of non-osteoarthritic adult acetabular dysplasia. Skeletal Radiol. 2009;38(2):131–39. doi: 10.1007/s00256-008-0601-x. [DOI] [PubMed] [Google Scholar]
- 10.Schuller HM, Dalstra M, Huiskes R, Marti RK. Total hip reconstruction in acetabular dysplasia. A finite element study. J Bone Joint Surg Br. 1993;75(3):468–74. doi: 10.1302/0301-620X.75B3.8496225. [DOI] [PubMed] [Google Scholar]
- 11.Zhao X, Chosa E, Totoribe K, Deng G. Effect of periacetabular osteotomy for acetabular dysplasia clarified by three-dimensional finite element analysis. J Orthop Sci. 2010;15(5):632–40. doi: 10.1007/s00776-010-1511-z. [DOI] [PubMed] [Google Scholar]
- 12.Vafaeian B, Zonoobi D, Mabee M, et al. Finite element analysis of mechanical behavior of human dysplastic hip joints: A systematic review. Osteoarthritis Cartilage. 2016 doi: 10.1016/j.joca.2016.10.023. [Epub ahead of print] [DOI] [PubMed] [Google Scholar]
- 13.Li L, Yu M, Ma R, et al. Initial stability of subtrochanteric oblique osteotomy in uncemented total hip arthroplasty: A preliminary finite element study. Med Sci Monit. 2015;21:1969–75. doi: 10.12659/MSM.893717. [DOI] [PMC free article] [PubMed] [Google Scholar]
- 14.Anderson AE, Peters CL, Tuttle BD, Weiss JA. Subject-specific finite element model of the pelvis: Development, validation and sensitivity studies. J Biomech Eng. 2005;127(3):364–73. doi: 10.1115/1.1894148. [DOI] [PubMed] [Google Scholar]
- 15.Shepherd DE, Seedhom BB. The ‘instantaneous’ compressive modulus of human articular cartilage in joints of the lower limb. Rheumatology (Oxford) 1999;38(2):124–32. doi: 10.1093/rheumatology/38.2.124. [DOI] [PubMed] [Google Scholar]
- 16.Zielinska B, Donahue TL. 3D finite element model of meniscectomy: Changes in joint contact behavior. J Biomech Eng. 2006;128(1):115–23. doi: 10.1115/1.2132370. [DOI] [PubMed] [Google Scholar]
- 17.Wei HW, Sun SS, Jao SH, et al. The influence of mechanical properties of subchondral plate, femoral head and neck on dynamic stress distribution of the articular cartilage. Med Eng Phys. 2005;27(4):295–304. doi: 10.1016/j.medengphy.2004.12.008. [DOI] [PubMed] [Google Scholar]
- 18.Liu L, Ecker T, Xie L, et al. Biomechanical validation of computer assisted planning of periacetabular osteotomy: A preliminary study based on finite element analysis. Med Eng Phys. 2015;37(12):1169–73. doi: 10.1016/j.medengphy.2015.09.002. [DOI] [PubMed] [Google Scholar]
- 19.Dostal WF, Andrews JG. A three-dimensional biomechanical model of hip musculature. J Biomech. 1981;14(11):803–12. doi: 10.1016/0021-9290(81)90036-1. [DOI] [PubMed] [Google Scholar]
- 20.Qu Y, Jiang T, Zhao H, et al. Mid-term results of metal-on-metal hip resurfacing for treatment of osteoarthritis secondary to developmental dysplasia of the hip: a minimum of 8-years of follow-up. Med Sci Monit. 2014;20:2363–68. doi: 10.12659/MSM.890892. [DOI] [PMC free article] [PubMed] [Google Scholar]
- 21.Okano K, Jingushi S, Ohfuji S, et al. Relationship of acetabular dysplasia in females with osteoarthritis of the hip to the distance between both anterior superior iliac spines. Med Sci Monit. 2014;20:116–22. doi: 10.12659/MSM.889704. [DOI] [PMC free article] [PubMed] [Google Scholar]
- 22.Jessel RH, Zurakowski D, Zilkens C, et al. Radiographic and patient factors associated with pre-radiographic osteoarthritis in hip dysplasia. J Bone Joint Surg Am. 2009;91(5):1120–29. doi: 10.2106/JBJS.G.00144. [DOI] [PubMed] [Google Scholar]
- 23.Liu L, Ecker TM, Schumann S, et al. Evaluation of constant thickness cartilage models vs. patient specific cartilage models for an optimized computer-assisted planning of periacetabular osteotomy. PLoS One. 2016;11(1):e0146452. doi: 10.1371/journal.pone.0146452. [DOI] [PMC free article] [PubMed] [Google Scholar]
- 24.Pompe B, Antolic V, Mavcic B, et al. Hip joint contact stress as an additional parameter for determining hip dysplasia in adults: Comparison with Severin’s classification. Med Sci Monit. 2007;13(5):CR215–19. [PubMed] [Google Scholar]
- 25.Sambandam SN, Hull J, Jiranek WA. Factors predicting the failure of Bernese periacetabular osteotomy: A meta-regression analysis. Int Orthop. 2009;33(6):1483–88. doi: 10.1007/s00264-008-0643-7. [DOI] [PMC free article] [PubMed] [Google Scholar]
- 26.Wells J, Millis M, Kim YJ, et al. Survivorship of the bernese periacetabular osteotomy: What factors are associated with long-term failure? Clin Orthop Relat Res. 2016 doi: 10.1007/s11999-016-4887-z. [Epub ahead of print] [DOI] [PMC free article] [PubMed] [Google Scholar]
- 27.Armiger RS, Armand M, Tallroth K, et al. Three-dimensional mechanical evaluation of joint contact pressure in 12 periacetabular osteotomy patients with 10-year follow-up. Acta Orthop. 2009;80(2):155–61. doi: 10.3109/17453670902947390. [DOI] [PMC free article] [PubMed] [Google Scholar]
- 28.Harris-Hayes M, Royer NK. Relationship of acetabular dysplasia and femoroacetabular impingement to hip osteoarthritis: A focused review. PM R. 2011;3(11):1055–67.e1. doi: 10.1016/j.pmrj.2011.08.533. [DOI] [PMC free article] [PubMed] [Google Scholar]
- 29.Clohisy JC, Nunley RM, Carlisle JC, Schoenecker PL. Incidence and characteristics of femoral deformities in the dysplastic hip. Clin Orthop Relat Res. 2009;467(1):128–34. doi: 10.1007/s11999-008-0481-3. [DOI] [PMC free article] [PubMed] [Google Scholar]
- 30.Hammond AS, Plavcan JM, Ward CV. Precision and accuracy of acetabular size measures in fragmentary hominin pelves obtained using sphere-fitting techniques. Am J Phys Anthropol. 2013;150(4):565–78. doi: 10.1002/ajpa.22228. [DOI] [PubMed] [Google Scholar]
- 31.Gillard FC, Dickinson AS, Schneider U, et al. Multi-pelvis characterisation of articular cartilage geometry. Proc Inst Mech Eng H. 2013;227(12):1255–64. doi: 10.1177/0954411913500265. [DOI] [PubMed] [Google Scholar]
- 32.Henebry A, Gaskill T. The effect of pelvic tilt on radiographic markers of acetabular coverage. Am J Sports Med. 2013;41(11):2599–603. doi: 10.1177/0363546513500632. [DOI] [PubMed] [Google Scholar]
- 33.Sankar WN, Neubuerger CO, Moseley CF. Femoral head sphericity in untreated developmental dislocation of the hip. J Pediatr Orthop. 2010;30(6):558–61. doi: 10.1097/BPO.0b013e3181e4f53e. [DOI] [PubMed] [Google Scholar]


