

Abstract
Microglial clusters with C3d deposits are observed in the periplaque of multiple sclerosis (MS) brains and were proposed as early stage of lesion formation. As such they should appear in the brain of MS donors with acute disease but thus far this has not been shown. Using postmortem brain tissue from acute (n = 10) and chronic (n = 15) MS cases we investigated whether C3d+ microglial clusters are part of an acute attack against myelinated axons, which could have implications for disease pathogenesis. The specificity of our findings to MS was tested in ischemic stroke cases (n = 8) with initial or advanced lesions and further analyzed in experimental traumatic brain injury (TBI, n = 26), as both conditions are primarily nondemyelinating but share essential features of neurodegeneration with MS lesions. C3d+ microglial clusters were found in chronic but not acute MS. They were not associated with antibody deposits or terminal complement activation. They were linked to slowly expanding lesions, localized on axons with impaired transport and associated with neuronal C3 production. C3d+ microglial clusters were not specific to MS as they were also found in stroke and experimental TBI. We conclude that C3d+ microglial clusters in MS are not part of an acute attack against myelinated axons. As such it is unlikely that they drive formation of new lesions but could represent a physiological mechanism to remove irreversibly damaged axons in chronic disease. GLIA 2017;65:264–277
Keywords: microglia, pathology, lesions
Introduction
Multiple sclerosis (MS) is an inflammatory, demyelinating disease of the central nervous system (CNS), with an important neurodegenerative component (Ferguson et al., 1997; Peterson et al., 2001; Trapp and Nave, 2008; Trapp et al., 1998). Its pathological hallmark consists of focal white matter lesions but the initial trigger and underlying mechanisms of lesion formation are still unresolved. Importantly, monocyte‐derived macrophages and resident microglia contribute to MS lesion formation as they phagocytose myelin, leading to extensive demyelination and oligodendrocyte dysfunction (Hendriks et al., 2005).
A frequently reported observation in the brain of donors with MS consists of clusters of microglial cells (Barnett et al., 2009; Prineas et al., 2001; Ramaglia et al., 2012). Because they are found in the normal appearing white matter (NAWM) (van der Valk and Amor, 2009), or at the lesion border (Prineas et al., 2001) and they occur in the absence of overt inflammation (van Horssen et al., 2012; van Noort et al., 2010), these microglial clusters have been suggested as the earliest stage of MS lesion formation (van der Valk and Amor, 2009). Further, recent evidence indicates that they adjoin degenerating axons (Singh et al., 2013) and are therefore thought to mediate axonal damage (Howell et al., 2010; Kutzelnigg et al., 2005; Moreno et al., 2011; Palin et al., 2008).
We (Ramaglia et al., 2012) and others (Barnett et al., 2009; Prineas et al., 2001) detected deposits of the activated product of the complement component C3 (C3d) at clusters of microglia in the brain of donors with chronic MS. The complement component C3 is the core protein of the complement system and the converging point of all pathways of activation. Its cleavage results in the formation of the opsonin C3b (and its downstream activation products, including iC3b and C3d), which flags cells for elimination by phagocytes, and the soluble anaphylatoxin C3a, which recruits phagocytes at the targeted site (Ricklin et al., 2010). As such, activation of C3 can either be detrimental by mediating myelin loss and axonal injury during active demyelination or it can be part of a physiological process to clear myelin debris and irreversibly damaged axons in chronic disease. The question remains whether the C3d+ microglial clusters seen in the MS brain are part of an acute attack against myelinated axons, thereby driving the formation of a new lesion, or whether they are involved in the removal of damaged axons during the chronic disease stage. Answering this question will have important implications for the understanding of disease pathogenesis in MS.
Our hypothesis is that C3d+ microglial clusters occur in chronic but not acute disease. To test this hypothesis, we first examined the frequency and localization of C3d deposits and microglial clusters in a cohort of chronic MS patients with either slowly expanding or inactive lesions, and compared the findings with acute MS cases. Secondly, we tested the specificity of our findings to MS by comparing our observations with pathologically initial or advanced lesions in a cohort of patients with ischemic stroke and in experimental traumatic brain injury (TBI). These conditions are primarily nondemyelinating but share essential features of neurodegeneration with MS lesions.
Materials and Methods
Autopsy Tissue
Postmortem brain tissue samples of cortical grey matter and subcortical white matter, including a total of 116 white matter lesions identified in 73 blocks, were obtained from 15 donors with primary progressive (PP) MS, secondary progressive (SP) MS or progressive MS of undetermined type (SP/PP). Brain tissue from all donors with chronic MS was obtained from the Netherlands Brain Bank (NBB) in Amsterdam (male/female ratio: 9/6; age, range: 41.0–81.0 years, median: 55.0 years; disease duration (DD), range: 11.0–59.0 years, median: 23.0 years). In this study, donors with PP, SP, or SP/PP were pooled and referred to as chronic MS (Table 1).
Table 1.
Clinical Data and Demographics of MS, Ischemic Stroke and Non‐neurological Control Donors
| Donors | Sex | Age | Disease course | Disease duration | Lesion activity and type |
|---|---|---|---|---|---|
| Acute MS | Months | ||||
| 1 | M | 45 | Monophasic | 0.2 | Active (Pattern III) |
| 2 | M | 45 | Monophasic | 0.6 | Active (Pattern III) |
| 3 | M | 35 | Monophasic | 1.5 | Active (Pattern III) |
| 4 | F | 69 | Monophasic | 2.0 | Active (Pattern III) |
| 5 | M | 78 | Monophasic | 2.0 | Active (Pattern III) |
| 6 | F | 46 | Monophasic | 7.0 | Active (Pattern II) |
| 7 | F | 46 | Monophasic | 0.5 | Active (Pattern II) |
| 8 | F | 51 | Monophasic | 5.0 | Active (Pattern II) |
| 9 | M | 52 | Monophasic | 1.5 | Active (Pattern II) |
| 10 | F | 46 | Monophasic | 3.0 | Active (Pattern II) |
| Chronic MS | Years | ||||
| 1 | F | 41 | SP | 11 | Slowly expanding |
| 2 | F | 56 | PP | 20 | Inactive |
| 3 | M | 41 | SP/PP | 22 | Slowly expanding |
| 4 | F | 66 | SP | 23 | Slowly expanding |
| 5 | M | 49 | SP | 26 | Slowly expanding |
| 6 | M | 55 | SP | 31 | Slowly expanding |
| 7 | M | 61 | SP | 31 | Inactive |
| 8 | F | 81 | SP/PP | 59 | Inactive |
| 9 | M | 50 | SP/PP | 24 | Inactive |
| 10 | M | 44 | PP | 16 | Slowly expanding |
| 11 | F | 68 | SP/PP | 42 | Inactive |
| 12 | M | 44 | SP | 21 | Slowly expanding |
| 13 | M | 51 | SP | 20 | Inactive |
| 14 | F | 57 | SP/PP | 27 | Slowly expanding |
| 15 | M | 58 | SP | 19 | Inactive |
| Stroke | Weeks | ||||
| 1 | M | 84 | Acute | 0.1 | Initial |
| 2 | F | 88 | Acute | 0.6 | Initial |
| 3 | F | 85 | Acute | 0.3 | Initial |
| 4 | F | 85 | Acute | 1.1 | Initial |
| 5 | M | 66 | Acute | 1.3 | Initial and advanced |
| 6 | M | 66 | Acute | 1.1 | Initial and advanced |
| 7 | F | 92 | Acute | 4.4 | Advanced |
| 8 | M | 68 | Acute–subacute | 6.0 | Advanced |
| Controls | |||||
| 1 | F | 36 | – | – | – |
| 2 | F | 39 | – | – | – |
| 3 | F | 45 | – | – | – |
| 4 | F | 42 | – | – | – |
| 5 | F | 30 | – | – | – |
| 6 | M | 46 | – | – | – |
| 7 | F | 47 | – | – | – |
| 8 | M | 56 | – | – | – |
| 9 | F | 64 | – | – | – |
| 10 | F | 60 | – | – | – |
| 11 | M | 74 | – | – | – |
| 12 | M | 65 | – | – | – |
| 13 | F | 84 | – | – | – |
| 14 | F | 71 | – | – | – |
| 15 | F | 80 | – | – | – |
| 16 | M | 72 | – | – | – |
| 17 | F | 88 | – | – | – |
| 18 | M | 83 | – | – | – |
| MS, multiple sclerosis; F, female; M, male. | |||||
In addition, brain autopsy tissue from 10 donors with acute MS (male/female ratio: 5/5; age, range: 35.0–78.0 years, median: 46.0 years; DD, range: 0.2–7.0 months, median: 1.8 months) (Table 1) and 1 donor with neuromyelitis optica (NMO; female; age: 20 years; DD: 4 years) was obtained from the Center for Brain Research at the Medical University of Vienna in Austria. All patients with acute MS included in this cohort died within 1 year after disease onset (Marburg, 1906).
One group of controls included autopsy brain tissue from 18 non‐neurological control donors (male/female ratio: 6/12) obtained from the NBB or the Medical University of Vienna. This group of controls included both young and old donors to exclude aging as potential confounding factor in our analyses (age, range: 30.0–88.0 years, median: 62.0 years) (Table 1).
A second group of controls consisted of autopsy brain tissue, collected at the Medical University of Vienna, obtained from eight patients who died after an ischemic stroke and showed lesions at initial and/or advanced stage of progression (male/female ratio: 4/4; age, range: 66.0–92.0 years, median: 84.5 years) (Table 1).
Informed consent was ensured for brain autopsies and for the use of material and clinical data for research purposes, in compliance with institutional and Dutch national ethical guidelines. Studies on the archival material derived from the Medical University of Vienna have been approved by the local Ethics Committee (EK Number 78/11/2015). Specimens obtained from brain autopsies were either fixed in 10% buffered formalin and processed for embedding in paraffin or immediately frozen in liquid nitrogen and stored at −80°C until they were used. For the neuropathological examination of all MS and stroke donors, paraffin sections of multiple tissue blocks sampled from all brain regions of each donor were stained with hematoxylin/eosin (H&E), Luxol fast blue (LFB) and Bielschowsky silver stain. Basic neuropathological stainings were also performed on multiple blocks of non‐neurological control donors to exclude occurrence of brain lesions. The clinical course of MS for each donor was defined by the retrospective analysis of the clinical history and the pathological analysis at autopsy (Lublin and Reingold, 1996).
Characterization of MS and Ischemic Stroke Lesions
For the characterization of white matter MS lesions, sections of 3–5 µm thickness were cut from formalin‐fixed paraffin‐embedded tissue blocks, collected from multiple brain areas of each donor. Demyelination was assessed by immunostaining for myelin‐associated glycoprotein (MAG), myelin oligodendrocyte glycoprotein (MOG) and proteolipid protein (PLP), in addition to LFB. The morphology and distribution of microglia/macrophages were examined by immunostaining for ionized calcium‐binding adaptor molecule 1 (IBA‐1), human leukocyte antigen (HLA‐DR), CD45, and the lysosomal marker CD68. The CD3, CD4, and CD8 markers were used to assess inflammatory activity (Table 2).
Table 2.
Primary Antibodies, Dilution, Source
| Antigen | Clone | Dilution | Source |
|---|---|---|---|
| MAG | B11F7 | 1:1,000c | ATCC |
| MOG | Y10 and Z12 | 1:1,000b | Piddlesden et al. (1993) |
| MOG | EP4281 | 1:1,000b | Abcam |
| PLP | plpc1 | 0.3 μg/mLa | Serotec |
| NF | SMI312 | 1:20,000c | Sternberger |
| IBA‐1 | Polyclonal | 1:3,000c; 1:1,000b† | Wako |
| HLA‐DP‐DQ‐DR | CR3/43 | 8.6 μg/mLa | Dako |
| HIF‐1α | 54 | 1:30c | BD Biosciences |
| CD3 | Polyclonal | 1:1,000b | Dako |
| CD4 | 4B12 | 1:2,000c | Dako |
| CD8 | C8/144B | 1:250c | Dako |
| CD45 | 2B11 + PD7/26 | 1:100b | Dako |
| CD68 | KP1 | 1:100c | Dako |
| C3/C3b/iC3b/C3d | 2/11 | 1:100b† | Hycult Biotech |
| CNPase | SMI 91 | 1:2,000c | Sternberger |
| CD3 | SP7 | 1:500b | Thermo Scientific |
| p22phox | Polyclonal | 1:100b | Santa Cruz |
| C3/C3b/iC3b/C3d | Polyclonal | 1.5 μg/mLb | Dako |
| C9neo (C5b9) | aE11 | 0.2 μg/mLb† | Dako |
| C1q | Polyclonal | 31.5 μg/mL | Dako |
| IgG | Polyclonal | 1:32,000c | Dako |
| IgM | Polyclonal | 1:16,000c | Dako |
| NeuN | A60 | 1:1,000c | Chemicon |
| Calnexin | AF18 | 1 μg/mLb | Abcam |
| APP | 22c11 | 0.3 μg/mLb | Chemicon |
Antigen retrieval of paraffin sections was performed by heat in a0.05M Tris buffered saline pH 7.6; b10 mM citric acid buffer pH 6.0; c10 mM Tris/1 mM EDTA buffer pH 9.0. The cross (†) indicates dilutions for frozen sections.
Lesion activity in MS was evaluated as previously published (Frischer et al., 2009, 2015; Lucchinetti et al., 2000). Briefly, white matter lesions in chronic MS cases were either slowly expanding (also called smouldering) or inactive (Frischer et al., 2009, 2015). Slowly expanding lesions showed loss of LFB, MOG and PLP with a few macrophages at the lesion edge containing MOG+ myelin degradation products (Fig. 1A–D). These cases also showed lymphocytic perivascular “cuffing” (Fig. 1E) and an inactive lesion center with few or no macrophages surrounded by a rim of activated HLA‐DR+ microglia (Fig. 1F). On the other hand, inactive plaques showed loss of LFB, MOG, and PLP with a sharp plaque border, and no evidence of myelin degradation products. In these cases, we observed a paucity of inflammatory T‐lymphocytes and microglia activation (data not shown).
Figure 1.
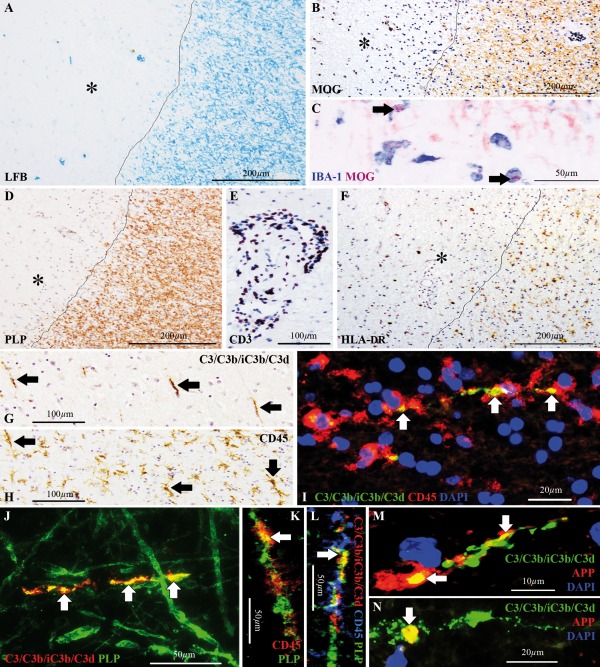
C3d+ microglial clusters in chronic MS cases with slowly expanding lesions. Slowly expanding white matter lesion in a chronic MS case (chronic MS#1), showing (A) loss of Luxol fast blue (LFB) staining (asterisk), (B) loss of immunoreactivity for the myelin oligodendrocyte glycoprotein (MOG, asterisk) (C) with intracellular inclusions of MOG+ myelin degradation products inside ionized calcium‐binding adapter molecule 1 (IBA‐1)+ macrophages (arrows) at the lesion edge and (D) loss of immunoreactivity for the proteolipid protein (PLP, asterisk). Lesion edge is indicated by the line in A,B,D. (E) Perivascular “cuffing” with CD3+ T‐lymphocytes, expanding within the Virchow‐Robin space of capillaries, located within the lesion or at the perilesional area. (F) Human leukocyte antigen (HLA‐DR)+ microglia accumulated at the lesion edge (indicated by the line), whereas the lesion core was generally hypocellular (asterisk). (G,H) Consecutive sections stained for (G) C3/C3b/iC3b/C3d and (H) CD45, showing corresponding profiles of (G) C3d+ linear deposits (arrows) and (H) linear clusters of microglia (arrows). (I) Double immunolabeling for C3/C3b/iC3b/C3d (green) and CD45 (red) showing that a cluster of CD45+ microglia surrounds the C3d+ linear deposit. Nuclei are stained with 4′,6‐diamidino‐2‐phenylindole (DAPI, blue). (J) Double immunolabeling for C3/C3b/iC3b/C3d (red) and PLP (green) showing that C3d is deposited on axons which are partially immunoreactive for PLP, indicative of partial demyelination. (K) Confocal microscopy of double immunolabeling for CD45 (red) and PLP (green), demonstrating localization of PLP within a CD45+ microglial cluster. (L) Confocal microscopy of triple immunolabeling for C3/C3b/iC3b/C3d (red), CD45 (blue) and PLP (green), showing C3d deposition on a partially demyelinated axon within a CD45+ microglial cluster. (M,N) C3d deposits (green) on amyloid precursor protein (APP)+ axons or terminal bulbs (red), indicative of transection or impaired protein transport. Nuclei are stained with DAPI (blue). Arrows in I‐N point to sites of markers colocalization. Scale bars: (A,B,D,F) 200 μm; (E,G,H) 100 μm; (C,J–L) 50 μm; (I,N) 20 μm; (M) 10 μm. Hematoxylin was used as counterstain in B,D–H. [Color figure can be viewed at wileyonlinelibrary.com]
Acute MS cases contained active white matter lesions (Frischer et al., 2009; Lucchinetti et al., 2000). They featured myelin loss and accumulation of CD68+ macrophages within the lesion (Fig. 2A,B). Immunoreactivity for MOG was rarefied in the lesion core but MOG+ myelin degradation products were present both within the lesion and at the lesion edge (Fig. 2C,D). Immunoreactivity for PLP was preserved, showing a patchy staining pattern indicative of ongoing demyelination (Fig. 2E). CD3+ T‐lymphocytes accumulated at the Virchow–Robin space of capillaries located in and around the lesion and in some cases infiltrated the parenchyma. Most of these T‐lymphocytes were CD8+ whereas CD4+ staining, although present, was less pronounced and detected only at the perivascular spaces (Fig. 2F–I). MAG+ degradation products were detected in the lesion core with abundant phagocytes (Fig. 2J,K), and at the lesion edge with CD68+ cells of morphology consistent with active microglia and phagocytic macrophages (Fig. 2L,M).
Figure 2.
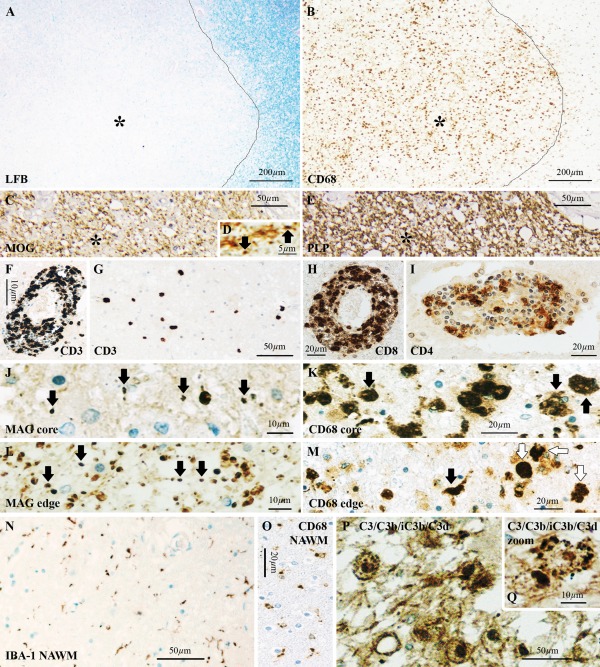
Acute MS cases lack C3d+ microglial clusters. Actively demyelinating lesions in an acute MS case (acute MS#2), showing (A) loss of Luxol fast blue (LFB, asterisk) staining, and (B) accumulation of CD68+ macrophages in the lesion core (asterisk). Lesion edge is indicated by the line in A,B. (C) Immunoreactivity for the myelin oligodendrocyte glycoprotein (MOG) showed a general loss of staining within the lesion (asterisk), (D) with MOG+ myelin degradation products (arrows) at the lesion edge and in the lesion core. (E) Immunostaining for proteolipid protein (PLP), showing a patchy pattern (asterisk), indicative of active demyelination. (F–I) T‐lymphocyte immunostaining, showing (F) “cuffing” of CD3+ T‐lymphocytes around blood vessels and (G) abundance in the parenchyma. (H) Most of these T‐lymphocytes were CD8+ whereas (I) CD4+ staining, although present, was less pronounced and detected only at the perivascular spaces. (J) Myelin‐associated glycoprotein (MAG)+ myelin products were found in the lesion core (arrows) where (K) CD68+ cells had phagocytic morphology (arrows), and (L) at the lesion edge (arrows) where (M) we observed CD68+ cells of morphology consistent with activated microglia (black arrow) and phagocytic macrophages (white arrows). (N) Periplaque area with normal appearing white matter (NAWM), showing sparse ionized calcium‐binding adapter molecule 1 (IBA‐1)+ microglia with nonreactive/nonphagocytic morphology, (O) confirmed by the small morphology of CD68 reactive cells in the same area. C3/C3b/iC3b/C3d immunostaining, showing (P) abundant immunoreactivity within macrophages in the lesion core, (Q) in a staining pattern consistent with debris. Scale bars: (A,B) 200 μm; (C,E,G,N,P) 50 μm; (H,I,K,M,O) 20 μm; (F,J,L,Q) 10 μm; (D) 5 μm. Hematoxylin was used as counterstain in C–Q. [Color figure can be viewed at wileyonlinelibrary.com]
White matter lesions of cases with acute MS were classified into patterns I–IV, as previously described (Lucchinetti et al., 2000). Of the 10 acute MS cases included in the present study, 5 showed active lesions resembling the hypoxia‐like pattern III lesions, and 5 showed active lesions with pattern II pathology (Table 1). Evidence of complement activation in and around the lesions has been previously shown for the MS cases with pattern II pathology (Lucchinetti et al., 2000; Metz et al., 2014) and the NMO case (Misu et al., 2013) used in this study.
For the characterization of white matter ischemic stroke lesions, sections of 3–5 µm thickness were cut from formalin‐fixed paraffin‐embedded tissue blocks sampled from multiple brain areas of each donor. For the characterization of stroke lesions we first performed the routine LFB, H&E and Bielschowsky silver stainings described above. Then sections were immunostained for hypoxia induced factor 1 alpha (HIF‐1α) to detect the hypoxic insult area, for PLP to detect demyelination, for the pan‐neurofilament (NF) marker for axons to assess axonal loss/damage, and for p22phox, which is the catalytic subunit of nicotinamide adenine dinucleotide phosphate (NADPH) oxidase, to assess the extent of macrophage and granulocyte infiltration. Immunostaining for CD68 and IBA‐1 was used to assess microglia/macrophages activation and immunostaining for CD3 was used to assess T‐lymphocyte infiltration (Table 2). Ischemic stroke lesions were classified into initial and advanced (Table 1) as previously published (Lassmann, 2015; Mena et al., 2004) and further described in results. The initial stroke lesions showed acute neuronal injury. The advanced stroke lesions showed chronic neuronal injury and inflammation (Lassmann, 2015; Mena et al., 2004).
Animals
Male 8 weeks old C57BL/6 (n = 26) mice were obtained from Harlan (Bicester, UK) and housed in groups for at least 1 week before the start of the experiments. Animals weighed on average 25.36 g ± 1.68 g at the beginning of the study and were given food and water ad libitum. They were kept at room temperature (RT) on a 12 h light: 12 h dark cycle. All experiments were approved by the Academic Medical Center Animal Ethics Committee and complied with the Dutch national policy on humane care and the use of laboratory animals.
Closed Head Injury Model
Focal brain injury was induced by a standardized free‐falling weight drop device, reproduced from Flierl et al. (2009). The trauma was induced under deep isoflurane anesthesia (1.5v/l isoflurane and 1.0v/l O2). Five minutes before the trauma, mice were treated subcutaneously with one dose (0.05 mg/kg) of buprenorphine (Temgesic®, Schering‐Plough, The Netherlands) as analgesic. All mice were subjected to a weight drop of 2 cm, which determines a severe injury (Fluiter et al., 2014). After trauma, the scalp was closed with small clamps and mice were placed on a 37°C pad to recover from anesthesia before being returned to their home cages. One group of mice (n = 17) was left to recover for 3 days post‐trauma. Another group of mice (n = 9) was left to recover for 1 week post‐trauma.
Immunohistochemical Analyses
Paraffin or frozen sections were incubated with the primary antibody (Table 2) diluted in Normal Antibody Diluent (Immunologic, Duiven, The Netherlands) overnight at 4°C. Immunohistochemical analysis was performed according to established techniques (King et al., 1997; Michailidou et al., 2015).
For light microscopy double immunostainings, the mouse antihuman neuronal nuclei (NeuN) antibody (Table 2) was visualized with the BrightVision poly AP‐Anti‐Mouse IgG biotin‐free (Immunologic) followed by the Vector Blue AP substrate kit (Vector Laboratories, Burlingame, CA). The mouse antihuman MOG and rabbit antihuman IBA‐1 primary antibodies (Table 2) were visualized with species‐specific biotinylated antimouse or antirabbit secondary antibodies (Jackson ImmunoResearch Laboratories, Inc., West Grove, PA) after incubation with avidin‐peroxidase (Sigma‐Aldrich, Steinheim, Germany) and developed with Fast Blue staining [Fast Blue BB Salt hemi (zinc chloride) salt, Sigma‐Aldrich] and 3‐amino‐9‐ethyl‐carabzole (AEC, Sigma‐Aldrich).
For fluorescent double immunostaining, primary antibodies (Table 2) were incubated simultaneously overnight followed by incubation with species‐specific antirabbit or antimouse secondary antibodies conjugated with fluorescein isothiocyanate (FITC, Sigma‐Aldrich) or Cy3 (Sigma‐Aldrich), as previously described in detail (Michailidou et al., 2015). Nuclear staining was visualized by 4',6‐diamidino‐2‐phenylindole, (DAPI, Vector Laboratories) and sections were mounted in Vectashield (Vector Laboratories).
To test for the deposition of C3/activated C3 in human tissue, an antibody that recognizes the shared epitope of the uncleaved C3 protein and the cleaved products of C3 (C3b/iC3b/C3d) was used. Therefore, in the text, the antibody is referred to as C3/C3b/iC3b/C3d (Table 2). When in the text we refer to the activated C3 only, C3d is used, as it is likely the cleaved C3 product to be deposited in the tissue and the one to be detected by the antibody. To control for the specificity of the C3/C3b/iC3b/C3d primary antibody, human brain sections were stained according to the standard protocol for immunohistochemistry except for the C3/C3b/iC3b/C3d incubation step, which was omitted. In a second experiment, C3/C3b/iC3b/C3d was subjected to an adsorption test, using purified human complement component C3d (Alpha Diagnostic International San Antonio, TX), following an established protocol (Michailidou et al., 2015; Saper and Sawchenko, 2003). In this case, no signal was observed.
Images were acquired with a digital camera (DP25; Olympus, Zoeterwoude, The Netherlands) attached to a light microscope (Olympus BX41) for colorimetric staining or with a digital camera (Olympus DFC345FX) attached to a Leica‐2 DM IRBE confocal microscope (LEICA Microsystems B.V., Rijswijk, The Netherlands) for immunofluorescent staining. Confocal image stacks were processed with LEICA Application Suite (LAS) AF microscope software V2.3.5 (LEICA Microsystems B.V.).
In Situ Hybridization
In situ hybridization was performed as previously published (Budde et al., 2008). Briefly, formalin‐fixed paraffin‐embedded human or mouse brain sections were prehybridized for 15 min and then hybridized for 45 min at 55 or 60°C, respectively, in hybridization mix (Budde et al., 2008; Michailidou et al., 2015). Prior to the hybridization step, each probe (final concentration 1 mM; human C3: 5′ fluorescein (FAM)‐TaaTccAccAauCauTucT, mouse C3: FAM‐TucTccAccAccGuuTccC; upper case indicates locked nucleic acid (LNA) and lower case indicates 2′‐O‐methyl (2′‐O‐Me)‐RNA; Ribo Task ApS, Odense, Denmark) was boiled for 5 min. After hybridization, sections were washed consecutively in saline‐sodium citrate buffer and probes were detected using a sheep Anti‐Fluorescein–AP Fab fragment (Roche Diagnostics GmbH, Penzberg, Germany) and then a rabbit antisheep IgG/HRP (Dako, Glostrup, Denmark), followed by a substrate kit for peroxidase (Vector NovaRED™ substrate kit, Vector Laboratories). Sections were enclosed in permanent mounting medium (VectaMount™, Vector Laboratories).
For the double labeling of human or mouse C3 mRNA with the neuronal marker NeuN (Table 2), the in situ hybridization protocol was performed immediately after the immunostaining for the NeuN marker.
Results
Complement C3d+ Microglial Clusters are Present in the Slowly Expanding Lesion Stage of Chronic MS
We identified linear deposits of C3d (Fig. 1G) and linear clusters of microglia (Fig. 1H) in approximately 55% of all chronic MS cases included in our collection. All blocks examined from chronic MS cases with C3d+ microglial clusters (Fig. 1I) showed slowly expanding lesions only, with clusters occurring at the edge or in the periplaque area. The remaining chronic MS cases, which did not show C3d+ microglial clusters, had only inactive lesions.
Colocalization studies in chronic MS cases with slowly expanding lesions showed that the deposits of C3d localize on partially demyelinated axons, as shown by the loss of PLP immunoreactivity, adjunct to linear clusters of microglia (Fig. 1J–L). These axons showed terminal amyloid precursor protein (APP)+ bulbs and accumulation of APP, indicative of transection or disturbed protein transport (Fig. 1M,N).
In acute MS cases with either pattern II or pattern III lesion pathology we found no evidence of microglial clusters or linear deposits of C3d, suggesting that clusters formation is independent of active demyelination. In the periplaque white matter, microglia showed a sparse distribution and a resting morphology, as indicated by the thin appearance of IBA‐1+ ramifications and the low immunoreactivity for CD68 (Fig. 2N,O). In the lesion core, we detected C3d+ inclusions within cells with a macrophage morphology (Fig. 2P,Q), as expected (Storch et al., 1998). Only one case with NMO and longer disease duration (4 years) showed microglial clusters in the periplaque white matter (data not shown). C3d+ microglial clusters were always absent from non‐neurological controls.
Complement C3d+ Microglial Clusters Occur in the Absence of Antibody Deposition and Terminal Complement Activation
To test whether C3d+ microglial clusters are associated with essential features of antibody‐ and complement‐mediated demyelination, we stained sections for evidence of antibody, C1q and terminal membrane attack complex (MAC) of complement deposition. Notably, C3d+ microglial clusters were consistently negative for immunoglobulins, C1q and the MAC (data not shown), suggesting that deposition of activated C3 is apparently independent of antigen/antibody binding to C1q and terminal complement activation.
C3 is Locally Produced by Neurons in Chronic MS
Chronic MS cases with C3d+ microglial clusters at the edge of slowly expanding lesions all showed neuronal reactivity for C3/C3b/iC3b/C3d (Fig. 3A) in close spatial relation with the clusters (see TOCI). In contrast, cases with inactive lesions were negative. The C3/C3b/iC3b/C3d neuronal staining pattern was consistent with its localization at organelles of the secretory machinery, suggesting that the protein detected is likely C3 and is locally produced by neurons. In situ hybridization for C3 mRNA (Fig. 3B) and neuronal colocalization of C3/C3b/iC3b/C3d with Calnexin, a marker of endoplasmic reticulum (ER, Fig. 3C), confirmed local neuronal synthesis of C3. Notably, the C3 signal was detected in the ER of neurons that were immunopositive for APP (Fig. 3D), suggesting that neuronal C3 production is associated with impaired protein transport.
Figure 3.
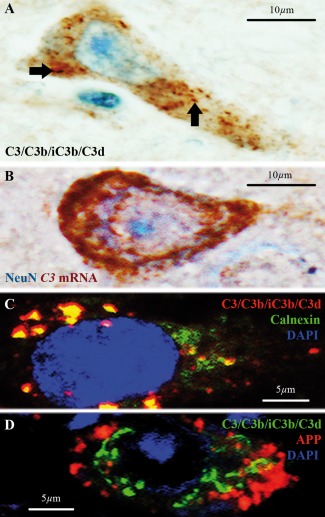
C3d+ microglial clusters are associated with neuronal C3 production in chronic MS cases. (A) A subset of neurons in a chronic MS case with slowly expanding white matter lesions, showing C3/C3b/iC3b/C3d immunoreactivity in a punctate pattern consistent with the neuronal secretory machinery (arrows), suggesting neuronal synthesis of C3. (B) In situ hybridization for C3 mRNA (red) and immunostaining for neuronal nuclei (NeuN, blue) proving production of C3 mRNA by neurons. (C) Double immunolabeling showing colocalization of C3/C3b/iC3b/C3d (red) and the endoplasmic reticulum marker Calnexin (green), further supporting neuronal synthesis of C3. (D) Double immunolabeling of C3/C3b/iC3b/C3d (green) and amyloid precursor protein (APP, red) showing neuronal localization. Nuclei in C and D are stained with 4′,6‐diamidino‐2‐phenylindole (DAPI, blue). Scale bars: (A,B) 10 μm; (C,D) 5 μm. Hematoxylin was used as counterstain in A. [Color figure can be viewed at wileyonlinelibrary.com]
C3d+ Microglial Clusters Occur in Advanced but not Initial Stroke Lesions
To test whether C3d+ microglial clusters are linked to the chronic neurological disease course and not specifically to MS, we also analyzed brain tissue from patients who died of ischemic stroke. To this end, we screened cases with defined initial and/or advanced white matter stroke lesions.
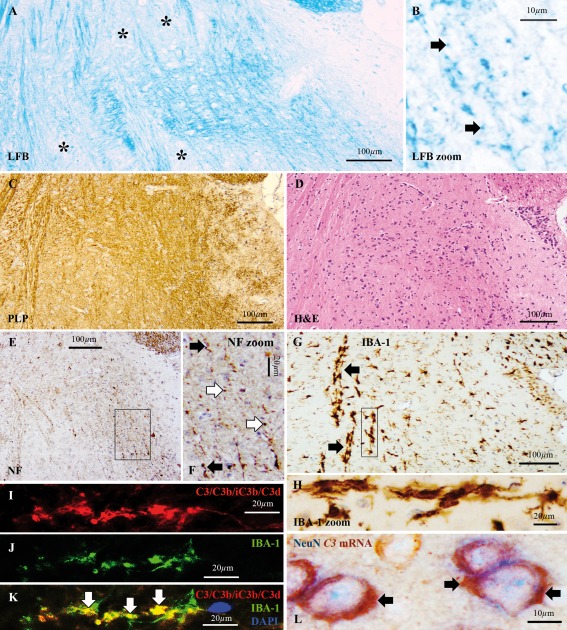
In initial stroke lesions, the LFB staining was lost whereas the immunoreactivity for PLP and for the NF marker of axons was preserved (Fig. 4A–C). These lesions showed a hypocellular core, with a paucity of microglial cells (Fig. 4D) and were often infiltrated by granulocytes immunopositive for p22phox, sign of inflammation‐associated oxidative stress (Fischer et al., 2012; Lassmann, 2015). Advanced stroke lesions showed loss of LFB staining (Lassmann, 2015), axonal spheroids (Mena et al., 2004) and accumulation at the lesion edge of p22phox+ macrophages. Few p22phox+ macrophages infiltrated the lesion core (Fig. 4E).
Figure 4.
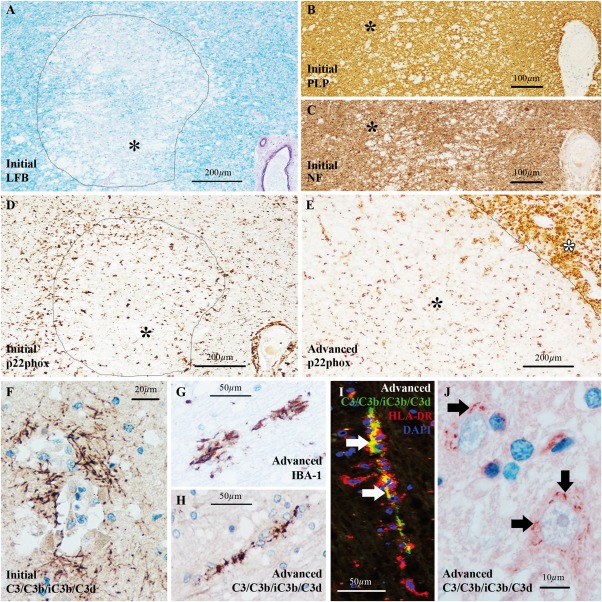
C3d+ microglial clusters and neuronal C3 in ischemic stroke cases with advanced lesions. (A–D) Ischemic stroke case with initial white matter lesions showing (A) loss of Luxol fast blue (LFB) staining from the lesion core (asterisk), (B) preservation of immunoreactivity for proteolipid protein (PLP, asterisk) and (C) preservation of immunoreactivity for pan‐neurofilament (NF, asterisk). (D) Microglial cells, expressing the nicotinamide adenine dinucleotide phosphate (NADPH) oxidase p22phox marker of oxidative stress, were accumulated at the lesion edge forming an ill‐defined rim in initial lesions whereas the lesion core was generally hypocellular (asterisk). (E) Advanced white matter stroke lesions showed massive accumulation of p22phox+ macrophages at the lesion edge (white asterisk) and some microglia/macrophages within the lesion (black asterisk). Lesion edge is indicated by the line in A,D,E. (F) In ischemic stroke cases with initial lesions, C3d was deposited on axons located close to blood vessels exclusively. (G,H) In ischemic stroke cases with advanced lesions, we found (G) ionized calcium‐binding adapter molecule 1 (IBA‐1)+ microglial clusters in areas corresponding to (H) linear C3d deposits. (I) Double immunolabeling for C3/C3b/iC3b/C3d (green) and human leukocyte antigen (HLA‐DR, red) showed that HLA‐DR+ microglial clusters surround the C3d+ linear deposits (arrows point to sites of markers co‐localization). Nuclei are stained with 4',6‐diamidino‐2‐phenylindole (DAPI, blue). (J) In advanced stroke lesions, punctate staining for C3/C3b/iC3b/C3d was detected at the neuronal bodies (arrows) in a subset of neurons located in close proximity to a lesion. Scale bars: (A,D,E) 200 μm; (B,C) 100 μm; (G–I) 50 μm; (F) 20 μm; (J) 10 μm. Hematoxylin was used as counterstain in A‐C,F–H,J. [Color figure can be viewed at wileyonlinelibrary.com]
C3d+ microglial clusters and C3+ neurons were both absent from cases with initial stroke lesions. In these cases, C3d deposits were found on axons located close to blood vessels at the site of injury (Fig. 4F). MAC deposits were also found at the same site as previously reported (Barnett et al., 2009), supporting the acute inflammatory nature of these axonal C3d deposits.
In contrast, C3d+ microglial clusters were found in cases with advanced stroke lesions (Fig. 4G–I) at a distance from the site of injury, in brain areas with no obvious signs of inflammation as indicated by the lack of T‐lymphocytes, macrophages and MAC (data not shown). These cases also showed neuronal immunoreactivity for C3/C3b/iC3b/C3d (Fig. 4J) in close spatial relation with the clusters (data not shown), similar to the findings in chronic MS tissue.
Taken together, C3d+ microglial clusters are not specific to MS. Their occurrence in advanced but not initial stroke lesions, further supports the link with axonal injury in the advanced lesional stage.
C3d+ Microglial Clusters Occur at 1 Week but Not at 3 Days after Experimental TBI
To further study the link between C3d+ microglial clusters and essential neurodegenerative features, we made use of the closed head injury model of TBI in mice because it reproduces complement activation and axonal injury in the brain (Fluiter et al., 2014; Ruseva et al., 2015).
At 3 days post‐trauma, lesions showed rarefied LFB staining, hemorrhage and signs of axonal transection (data not shown). C3d+ microglial clusters were not found in any of the animals tested at 3 days post‐trauma.
At 1 week post‐trauma, lesions showed diffuse loss of LFB staining and presence of LFB+ myelin products, both signs of demyelination. No signs of hemorrhage were detected in these lesions (Fig. 5A–D). PLP reactivity was preserved (Fig. 5C) but axonal transection was widespread (Fig. 5E,F). We also found no evidence of T‐lymphocyte influx (data not shown). Importantly, we detected C3d+ microglial clusters at a distance from the lesions (Fig. 5G–K). These clusters were always negative for immunoglobulins, C1q and MAC. In addition, in situ hybridization for C3 mRNA and immunostaining for NeuN showed local neuronal synthesis of C3 (Fig. 5L).
Figure 5.
C3d+ microglial clusters and neuronal C3 in the mouse brain at 1 week after TBI. Sagittal sections of mouse brain at 1 week after experimental closed head injury at a distance from the impact site. (A) Loss of Luxol fast blue (LFB) staining (asterisks) and (B) LFB+ myelin degradation products (arrows), indicative of demyelination. (C) Immunostaining for proteolipid protein (PLP) showing reactivity. (D) Hematoxylin and eosin (H&E) staining showing no signs of hemorrhage. (E,F) Immunostaining for the pan‐neurofilament (NF) marker of axons, showing a punctate staining pattern (white arrows in F) or disrupted axonal profiles (black arrows in F), consistent with axonal transection. (G,H) Immunostaining for ionized calcium‐binding adapter molecule 1 (IBA‐1) showing microglial clusters (arrows). (I–K) Immunoreactivity for (I) C3/C3b/iC3b/C3d (red) was detected within (J) IBA‐1+ microglial clusters (green) as indicated by the sites of markers co‐localization (arrows in K). Nuclei are stained with 4′,6‐diamidino‐2‐phenylindole (DAPI, blue). (L) In situ hybridization for C3 mRNA (red) and immunostaining for neuronal nuclei (NeuN, blue) showing localization of the C3 mRNA signal in the cytoplasm of NeuN+ cells, indicating local synthesis of C3 by neurons. Scale bars: (A,C,D,E,G) 100 μm; (F,H,I–K) 20 μm; (B,L) 10 μm. Hematoxylin was used as counterstain in C–H. [Color figure can be viewed at wileyonlinelibrary.com]
Taken together, the longitudinal analysis of mouse brains with TBI showed C3d+ microglial clusters near advanced but not initial lesions, providing further evidence that clusters formation is not part of an acute attack against myelinated axons but occurs at a later stage.
Discussion
This study establishes that C3d+ microglial clusters in MS occur in chronic but not in acute disease. They are present exclusively at the edge or periplaque of slowly expanding lesions, on stretches of partially demyelinated axons with evidence of transection or impaired protein transport. They are negative for immunoglobulins, C1q and the MAC, indicating that C3d+ microglial clusters are independent of antibody‐mediated demyelination and terminal complement activation. They are associated with neuronal synthesis of C3, suggesting that, at least in part, the source of C3 (and therefore its activation products, C3b/iC3b/C3d) is not systemic, through a disrupted blood–brain barrier (BBB), but its local production may be part of a physiological process in chronic disease.
Importantly, we prove that the C3d+ microglial clusters are a nonspecific feature of MS pathology as they also occur in stroke and experimental brain trauma. Earlier studies showed that the C3d+ microglial clusters engage short segments of disrupted myelin and the authors proposed that such disrupted myelin could be a possible source of the putative MS antigen (Prineas et al., 2001). Although in this study we cannot exclude that myelin components are also tagged by activated C3 and attract microglia, the occurrence of C3d+ microglial clusters in other conditions constitute evidence that cannot be interpreted as a distinct pathogenesis in MS.
Microglial clusters have been previously identified in the NAWM, around blood vessels with peri‐ and intra‐ vascular lymphocytic accumulation (De Groot et al., 2001) but in the absence of leukocyte infiltration (van Noort et al., 2010; van Horssen et al., 2012). They were suggested to be the earliest stage of MS lesion formation and therefore they were also termed preactive lesions (van der Valk and Amor, 2009). We now establish that they are not present in acute MS cases but occur in chronic disease, therefore it is unlikely that they represent an early stage in the evolution of MS lesions. Notably, microglial clustering can be highly heterogeneous ranging from a bushy‐like appearance (De Groot et al., 2001; Singh et al., 2013; van Horssen et al., 2010, 2012) to a linear arrangement, as we (Ramaglia et al., 2012) and others (Barnett et al., 2009; Prineas et al., 2001) have reported. The bushy‐like clusters of microglial cells/macrophages were also shown to adjoin damaged axons, possibly undergoing Wallerian degeneration (WD) (Singh et al., 2013) or dying‐back axonopathy (Geurts et al., 2012). However, they were found near inactive lesions (Singh et al., 2013; van Horssen et al., 2012) and were not shown to be associated with C3d deposits. Therefore, it is unclear whether the bushy‐like clustered microglia are the same pathological phenomenon as the linear C3d+ microglial clusters we found on injured axons at the edge or periplaque of slowly expanding white matter lesions in chronic MS.
The linear clusters of microglia were previously found to be associated with deposits of activated C3 but not found to adjoin injured axons (Barnett et al., 2009). On the other hand, the bushy‐like clustered microglial cells were found to adjoin injured axons (Singh et al., 2013) but they were not shown to be associated with C3d deposition. We now locate activated complement C3 on injured axons surrounded by linear clusters of microglia. What could be the role of activated C3 products at microglial clusters on injured axons? Complement activation on injured axons within clusters of microglia may signal ongoing WD, as previously suggested (Singh et al., 2013), with microglia recruited to clear axonal/myelin debris. Recruitment of microglia at the site of C3d deposition is likely driven by the complement receptor 3 (CR3, CD11b/CD18) on microglia but we cannot exclude that other signals flag the stressed or injured axon. For example, leakage of adenosine triphosphate (ATP) (Davalos et al., 2005), imbalanced glutamate homeostasis (Liu et al., 2009), immunogenicity of repaired myelin stretches (Peferoen et al., 2015), or chemokine release (Liang et al., 2009) have all been shown to attract microglial cells.
Complement deposition in MS tissue is typically driven by the classical pathway, via the activation of C1q by antigen–antibody complexes (Ricklin et al., 2010) or altered nerve structures (Michailidou et al., 2015; Vanguri et al., 1982). Interestingly, we did not detect C1q or antibodies at the site of microglial clusters. We also did not detect MAC deposits at this site. MAC would facilitate removal of axonal/myelin debris by inducing lysis of the target nerve cell, thereby solubilizing cellular debris for tagging by activated C3 products (C3b, iC3b). Tagged debris would then be eliminated by CR3 bearing phagocytes (Ricklin et al., 2010). Our observations point to the possibility that activation of C3 on axons within microglial clusters occurs independently of the classical and terminal pathways of complement, as previously proposed (Barnett et al., 2009; Prineas et al., 2001) but may be mediated by the alternative pathway of complement or a C3 convertase‐independent mechanism, as recently described in lymphocytes (Liszewski et al., 2013).
Notably, we found that C3d+ microglial clusters are associated with local production of C3 by neurons. These neurons showed accumulation of APP, a sign of impaired protein transport. C3 biosynthesis might be triggered by injured axons via a retrograde signal or by the exposure of neurons to factors released in the microenvironment surrounding a lesion such as iron (Li et al., 2015), a factor involved in both MS (Hametner et al., 2013) and stroke (Lipscomb et al., 1998) pathology. Importantly, neuronal production of C3 suggests that, at least in part, the source of C3 is not systemic, through a disrupted BBB. Since a leaky BBB is a key pathological hallmark of acute inflammation in MS, our observation that acute MS cases lack C3d+ microglial clusters further confirms the nonacute noninflammatory origin of the C3d+ microglial clusters.
The significance of C3d+ microglial clusters formation is an important question. Their presence in the chronic but not acute disease stage, their localization on injured axons, their association to local production of C3 by neurons, their occurrence in the absence of antibody, C1q or MAC deposits, suggest that they are not part of an acute immune attack against myelinated axons, but may represent a physiological process linked to the progressive disease stage such as the elimination of myelin debris or transected axons or terminal axonal ovoids (Trapp et al., 1998), the protection against energy deficiency (Nijland et al., 2014) or the uptake of extracellular glutamate (Nakajima et al., 2001) for protection against glutamate‐mediated excitotoxicity (Geurts et al., 2003). Notably, our observations suggest that C3d+ microglial clusters formation is a transient phenomenon, as it does not occur in pathologically inactive disease where processes such as axonal injury are essentially dying out (Frischer et al., 2009).
Altogether, our data support the noninflammatory nature of C3d+ microglial clusters, pointing to the possibility that they are involved in the physiological removal of irreversibly damaged axons. This process is substantially different from the acute complement attack against myelinated axons, seen in actively demyelinating lesions. In such scenario, pharmacological interventions to halt C3d+ microglial clusters formation might have no effect in the propagation of chronic MS pathology. Our study adds to the identification of physiological and/or pathological processes in MS, ultimately guiding therapeutic choices.
Funding
This work was funded by the Boehringer Ingelheim Fonds travel grant to I.M.; the Stichting MS Research travel grant no. ES63 to I.M.; the National Multiple Sclerosis Society grant no. RG 4775A1/1 to F.B. and V.R.; the Brain Foundation of the Netherlands Fellowship F2010(1)‐05 to V.R.
Disclosure
H.L. reports personal fees from Teva, Novartis, Biogen and Sanofi Aventis, outside the submitted work. All other authors declare no conflicts of interest.
Acknowledgment
We thank Dr. Kees Fluiter for assistance with the TBI experiment and Ulrike Koeck for technical support with the immunostaining. We thank the donors of the NBB and of the Medical University of Vienna.
References
- Barnett MH, Parratt JD, Cho ES, Prineas JW. 2009. Immunoglobulins and complement in postmortem multiple sclerosis tissue. Ann Neurol 65:32–46. [DOI] [PubMed] [Google Scholar]
- Budde BS, Namavar Y, Barth PG, Poll‐The BT, Nurnberg G, Becker C, van RF, Weterman MA, Fluiter K, te Beek ET, Aronica E, van der Knaap MS, Hohne W, Toliat MR, Crow YJ, Steinling M, Voit T, Roelenso F, Brussel W, Brockmann K, Kyllerman M, Boltshauser E, Hammersen G, Willemsen M, Basel‐Vanagaite L, Krageloh‐Mann I, de Vries LS, Sztriha L, Muntoni F, Ferrie CD, Battini R, Hennekam RC, Grillo E, Beemer FA, Stoets LM, Wollnik B, Nurnberg P, Baas F. 2008. tRNA splicing endonuclease mutations cause pontocerebellar hypoplasia. Nat Genet 40:1113–1118. [DOI] [PubMed] [Google Scholar]
- Davalos D, Grutzendler J, Yang G, Kim JV, Zuo Y, Jung S, Littman DR, Dustin ML, Gan WB. 2005. ATP mediates rapid microglial response to local brain injury in vivo . Nat Neurosci 8:752–758. [DOI] [PubMed] [Google Scholar]
- De Groot CJ, Bergers E, Kamphorst W, Ravid R, Polman CH, Barkhof F, van der Valk P. 2001. Post‐mortem MRI‐guided sampling of multiple sclerosis brain lesions: Increased yield of active demyelinating and (p)reactive lesions. Brain 124:1635–1645. [DOI] [PubMed] [Google Scholar]
- Ferguson B, Matyszak MK, Esiri MM, Perry VH. 1997. Axonal damage in acute multiple sclerosis lesions. Brain 120:393–399. [DOI] [PubMed] [Google Scholar]
- Fischer MT, Sharma R, Lim JL, Haider L, Frischer JM, Drexhage J, Mahad D, Bradl M, van HJ, Lassmann H. 2012. NADPH oxidase expression in active multiple sclerosis lesions in relation to oxidative tissue damage and mitochondrial injury. Brain 135:886–899. [DOI] [PMC free article] [PubMed] [Google Scholar]
- Flierl MA, Stahel PF, Beauchamp KM, Morgan SJ, Smith WR, Shohami E. 2009. Mouse closed head injury model induced by a weight‐drop device. Nat Protoc 4:1328–1337. [DOI] [PubMed] [Google Scholar]
- Fluiter K, Opperhuizen AL, Morgan BP, Baas F, Ramaglia V. 2014. Inhibition of the membrane attack complex of the complement system reduces secondary neuroaxonal loss and promotes neurologic recovery after traumatic brain injury in mice. J Immunol 192:2339–2348. [DOI] [PubMed] [Google Scholar]
- Frischer JM, Bramow S, Dal‐Bianco A, Lucchinetti CF, Rauschka H, Schmidbauer M, Laursen H, Sorensen PS, Lassmann H. 2009. The relation between inflammation and neurodegeneration in multiple sclerosis brains. Brain 132:1175–1189. [DOI] [PMC free article] [PubMed] [Google Scholar]
- Frischer JM, Weigand SD, Guo Y, Kale N, Parisi JE, Pirko I, Mandrekar J, Bramow S, Metz I, Bruck W, Lassmann H, Lucchinetti CF. 2015. Clinical and pathological insights into the dynamic nature of the white matter multiple sclerosis plaque. Ann Neurol 78:710–721. [DOI] [PMC free article] [PubMed] [Google Scholar]
- Geurts JJ, Calabrese M, Fisher E, Rudick RA. 2012. Measurement and clinical effect of grey matter pathology in multiple sclerosis. Lancet Neurol 11:1082–1092. [DOI] [PubMed] [Google Scholar]
- Geurts JJ, Wolswijk G, Bo L, van d, V , Polman CH, Troost D, Aronica E. 2003. Altered expression patterns of group I and II metabotropic glutamate receptors in multiple sclerosis. Brain 126:1755–1766. [DOI] [PubMed] [Google Scholar]
- Hametner S, Wimmer I, Haider L, Pfeifenbring S, Bruck W, Lassmann H. 2013. Iron and neurodegeneration in the multiple sclerosis brain. Ann Neurol 74:848–861. [DOI] [PMC free article] [PubMed] [Google Scholar]
- Hendriks JJ, Teunissen CE, de Vries HE, Dijkstra CD. 2005. Macrophages and neurodegeneration. Brain Res Rev 48:185–195. [DOI] [PubMed] [Google Scholar]
- Howell OW, Rundle JL, Garg A, Komada M, Brophy PJ, Reynolds R. 2010. Activated microglia mediate axoglial disruption that contributes to axonal injury in multiple sclerosis. J Neuropathol Exp Neurol 69:1017–1033. [DOI] [PMC free article] [PubMed] [Google Scholar]
- King G, Payne S, Walker F, Murray GI. 1997. A highly sensitive detection method for immunohistochemistry using biotinylated tyramine. J Pathol 183:237–241. [DOI] [PubMed] [Google Scholar]
- Kutzelnigg A, Lucchinetti CF, Stadelmann C, Bruck W, Rauschka H, Bergmann M, Schmidbauer M, Parisi JE, Lassmann H. 2005. Cortical demyelination and diffuse white matter injury in multiple sclerosis. Brain 128:2705–2712. [DOI] [PubMed] [Google Scholar]
- Lassmann H. 2015. Immune response in the human central nervous system in multiple sclerosis and stroke In: David S, editor. Neuroinflammation: New insights into beneficial and detrimental functions. Hoboken: Wiley; pp 1–19. [Google Scholar]
- Li Y, Song D, Song Y, Zhao L, Wolkow N, Tobias JW, Song W, Dunaief JL. 2015. Iron‐induced Local complement component 3 (C3) up‐regulation via non‐canonical transforming growth factor (TGF)‐beta signaling in the retinal pigment epithelium. J Biol Chem 290:11918–11934. [DOI] [PMC free article] [PubMed] [Google Scholar]
- Liang KJ, Lee JE, Wang YD, Ma W, Fontainhas AM, Fariss RN, Wong WT. 2009. Regulation of dynamic behavior of retinal microglia by CX3CR1 signaling. Invest Ophthalmol Vis Sci 50:4444–4451. [DOI] [PMC free article] [PubMed] [Google Scholar]
- Lipscomb DC, Gorman LG, Traystman RJ, Hurn PD. 1998. Low molecular weight iron in cerebral ischemic acidosis in vivo . Stroke 29:487–492. [DOI] [PubMed] [Google Scholar]
- Liszewski MK, Kolev M, Le FG, Leung M, Bertram PG, Fara AF, Subias M, Pickering MC, Drouet C, Meri S, Arstila TP, Pekkarinen PT, Ma M, Cope A, Reinheckel T, Rodriguez de CS, Afzali B, Atkinson JP, Kemper C. 2013. Intracellular complement activation sustains T cell homeostasis and mediates effector differentiation. Immunity 39:1143–1157. [DOI] [PMC free article] [PubMed] [Google Scholar]
- Liu GJ, Nagarajah R, Banati RB, Bennett MR. 2009. Glutamate induces directed chemotaxis of microglia. Eur J Neurosci 29:1108–1118. [DOI] [PubMed] [Google Scholar]
- Lublin FD, Reingold SC. 1996. Defining the clinical course of multiple sclerosis: Results of an international survey. National Multiple Sclerosis Society (USA) Advisory Committee on Clinical Trials of New Agents in Multiple Sclerosis. Neurology 46:907–911. [DOI] [PubMed] [Google Scholar]
- Lucchinetti C, Bruck W, Parisi J, Scheithauer B, Rodriguez M, Lassmann H. 2000. Heterogeneity of multiple sclerosis lesions: Implications for the pathogenesis of demyelination. Ann Neurol 47:707–717. [DOI] [PubMed] [Google Scholar]
- Marburg O. 1906. Die sogenannte “akute multiple sklerose”. Jahrb Psychiat Neurol 27:211–312. [Google Scholar]
- Mena H, Cadavid D, Rushing EJ. 2004. Human cerebral infarct: A proposed histopathologic classification based on 137 cases. Acta Neuropathol 108:524–530. [DOI] [PubMed] [Google Scholar]
- Metz I, Weigand SD, Popescu BF, Frischer JM, Parisi JE, Guo Y, Lassmann H, Bruck W, Lucchinetti CF. 2014. Pathologic heterogeneity persists in early active multiple sclerosis lesions. Ann Neurol 75:728–738. [DOI] [PMC free article] [PubMed] [Google Scholar]
- Michailidou I, Willems JG, Kooi EJ, van EC, Gold SM, Geurts JJ, Baas F, Huitinga I, Ramaglia V. 2015. Complement C1q–C3‐associated synaptic changes in multiple sclerosis hippocampus. Ann Neurol 77:1007–1026. [DOI] [PubMed] [Google Scholar]
- Misu T, Hoftberger R, Fujihara K, Wimmer I, Takai Y, Nishiyama S, Nakashima I, Konno H, Bradl M, Garzuly F, Itoyama Y, Aoki M, Lassmann H. 2013. Presence of six different lesion types suggests diverse mechanisms of tissue injury in neuromyelitis optica. Acta Neuropathol 125:815–827. [DOI] [PMC free article] [PubMed] [Google Scholar]
- Moreno B, Jukes JP, Vergara‐Irigaray N, Errea O, Villoslada P, Perry VH, Newman TA. 2011. Systemic inflammation induces axon injury during brain inflammation. Ann Neurol 70:932–942. [DOI] [PubMed] [Google Scholar]
- Nakajima K, Tohyama Y, Kohsaka S, Kurihara T. 2001. Ability of rat microglia to uptake extracellular glutamate. Neurosci Lett 307:171–174. [DOI] [PubMed] [Google Scholar]
- Nijland PG, Michailidou I, Witte ME, Mizee MR, van der Pol SM, van Het HB, Reijerkerk A, Pellerin L, van d, V , de Vries HE, van HJ. 2014. Cellular distribution of glucose and monocarboxylate transporters in human brain white matter and multiple sclerosis lesions. Glia 62:1125–1141. [DOI] [PubMed] [Google Scholar]
- Palin K, Cunningham C, Forse P, Perry VH, Platt N. 2008. Systemic inflammation switches the inflammatory cytokine profile in CNS Wallerian degeneration. Neurobiol Dis 30:19–29. [DOI] [PubMed] [Google Scholar]
- Peferoen LA, Vogel DY, Ummenthum K, Breur M, Heijnen PD, Gerritsen WH, Peferoen‐Baert RM, van d, V , Dijkstra CD, Amor S. 2015. Activation status of human microglia is dependent on lesion formation stage and remyelination in multiple sclerosis. J Neuropathol Exp Neurol 74:48–63. [DOI] [PubMed] [Google Scholar]
- Peterson JW, Bo L, Mork S, Chang A, Trapp BD. 2001. Transected neurites, apoptotic neurons, and reduced inflammation in cortical multiple sclerosis lesions. Ann Neurol 50:389–400. [DOI] [PubMed] [Google Scholar]
- Piddlesden SJ, Lassmann H, Zimprich F, Morgan BP, Linington C. 1993. The demyelinating potential of antibodies to myelin oligodendrocyte glycoprotein is related to their ability to fix complement. Am J Pathol 143:555–564. [PMC free article] [PubMed] [Google Scholar]
- Prineas JW, Kwon EE, Cho ES, Sharer LR, Barnett MH, Oleszak EL, Hoffman B, Morgan BP. 2001. Immunopathology of secondary‐progressive multiple sclerosis. Ann Neurol 50:646–657. [DOI] [PubMed] [Google Scholar]
- Ramaglia V, Hughes TR, Donev RM, Ruseva MM, Wu X, Huitinga I, Baas F, Neal JW, Morgan BP. 2012. C3‐dependent mechanism of microglial priming relevant to multiple sclerosis. Proc Natl Acad Sci USA 109:965–970. [DOI] [PMC free article] [PubMed] [Google Scholar]
- Ricklin D, Hajishengallis G, Yang K, Lambris JD. 2010. Complement: A key system for immune surveillance and homeostasis. Nat Immunol 11:785–797. [DOI] [PMC free article] [PubMed] [Google Scholar]
- Ruseva MM, Ramaglia V, Morgan BP, Harris CL. 2015. An anticomplement agent that homes to the damaged brain and promotes recovery after traumatic brain injury in mice. Proc Natl Acad Sci USA 112:14319–14324. [DOI] [PMC free article] [PubMed] [Google Scholar]
- Saper CB, Sawchenko PE. 2003. Magic peptides, magic antibodies: Guidelines for appropriate controls for immunohistochemistry. J Comp Neurol 465:161–163. [DOI] [PubMed] [Google Scholar]
- Singh S, Metz I, Amor S, van der Valk P, Stadelmann C, Bruck W. 2013. Microglial nodules in early multiple sclerosis white matter are associated with degenerating axons. Acta Neuropathol 125:595–608. [DOI] [PMC free article] [PubMed] [Google Scholar]
- Storch MK, Piddlesden S, Haltia M, Iivanainen M, Morgan P, Lassmann H. 1998. Multiple sclerosis: In situ evidence for antibody‐ and complement‐mediated demyelination. Ann Neurol 43:465–471. [DOI] [PubMed] [Google Scholar]
- Trapp BD, Nave KA. 2008. Multiple sclerosis: An immune or neurodegenerative disorder? Annu Rev Neurosci 31:247–269. [DOI] [PubMed] [Google Scholar]
- Trapp BD, Peterson J, Ransohoff RM, Rudick R, Mork S, Bo L. 1998. Axonal transection in the lesions of multiple sclerosis. N Engl J Med 338:278–285. [DOI] [PubMed] [Google Scholar]
- van der Valk P, Amor S. 2009. Preactive lesions in multiple sclerosis. Curr Opin Neurol 22:207–213. [DOI] [PubMed] [Google Scholar]
- van Horssen J, Singh S, van der Pol S, Kipp M, Lim JL, Peferoen L, Gerritsen W, Kooi EJ, Witte ME, Geurts JJ, de Vries HE, Peferoen‐Baert R, van den Elsen PJ, van d, V , Amor S. 2012. Clusters of activated microglia in normal‐appearing white matter show signs of innate immune activation. J Neuroinflamm 9:156. [DOI] [PMC free article] [PubMed] [Google Scholar]
- van Noort JM, Bsibsi M, Gerritsen WH, van der Valk P, Bajramovic JJ, Steinman L, Amor S. 2010. Alphab‐crystallin is a target for adaptive immune responses and a trigger of innate responses in preactive multiple sclerosis lesions. J Neuropathol Exp Neurol 69:694–703. [DOI] [PubMed] [Google Scholar]
- Vanguri P, Koski CL, Silverman B, Shin ML. 1982. Complement activation by isolated myelin: Activation of the classical pathway in the absence of myelin‐specific antibodies. Proc Natl Acad Sci USA 79:3290–3294. [DOI] [PMC free article] [PubMed] [Google Scholar]