

Abstract
Objective
To quantify the gestational age specific morbidity of black versus white neonates.
Study Design
Population-based retrospective cohort study of singleton live births in Ohio, 2006 and 2007. The primary outcome was a composite of adverse neonatal outcome of ≥ 1 morbidity: Apgar score < 7 at 5 minutes, assisted ventilation > 6 hours, seizures, or neonatal transport to a tertiary care facility. Generalized linear regression estimated the relative risk of adverse neonatal outcome by week of gestation after adjustment for influential coexistent risk factors.
Results
The frequency distribution curve of composite morbidity by gestational age were similar, but shifted to left (earlier gestational age) for black compared to white neonates. Adverse outcome was lower for black compared to white births at each preterm week of gestational age. The lowest adverse outcome rate for black neonates was at 38 weeks and 39 weeks for white, each increasing by week of gestation thereafter.
Conclusion
These data suggest that pregnancies in black women perhaps have a shorter physiologic gestational length.
Keywords: Racial disparity, preterm birth, neonatal outcome
Introduction
Prior studies have demonstrated a higher frequency of preterm birth and lower frequency of post term birth in black compared to white women.1, 2 Additionally, gestational age specific neonatal morbidity is lower in black compared to white births at preterm gestational ages. These prior studies suggest that the “normal” gestational length of black women may be shorter than that of white women. The aim of this study was to quantitatively assess the gestational age specific difference in neonatal morbidity of black versus white infants.
Material and Methods
This study was approved by the Ohio Department of Health and Human Subjects Institutional Review Board and a de-identified data set was provided by the Child Policy Research Center of Cincinnati Children's Hospital Medical Center. The study was exempt from review by the Institutional Review Board at the University of Cincinnati, Cincinnati, Ohio.
We conducted a population-based retrospective cohort study using the Ohio Department of Health's birth certificate database (2006 and 2007) to assess racial differences in the frequency of adverse neonatal outcomes, stratified by week of gestation. We examined birth records of all singleton live births excluding major congenital anomalies, births < 20 or > 44 weeks, births to mothers with any self reported race other than white or black, missing race and mothers listing race as both black and white (Figure 1). After exclusions, 273,256 births remained for analysis.
Figure 1.

Flow diagram of the study population
The primary outcome was a composite of adverse neonatal outcome consisting of one or more of the following: Apgar score < 7 at 5 minutes, assisted ventilation > 6 hours, neonatal seizures, or neonatal transport to a tertiary care facility. We focused our assessment of neonatal outcomes to those occurring in the immediate (24–48 hours) post delivery period as those occurring later would not be captured at the time of birth certificate generation. The frequency and risk of adverse outcome was compared between black and white newborns by week of gestational age, from 32 to 41 weeks. Less than 1% of deliveries occurred after 41 weeks, thus analysis was limited to these earlier gestational ages. At gestational ages less than 32 weeks the high rate of morbidities present regardless of race, as well as far fewer births at these early preterm gestational ages, limited our ability to make accurate week-by-week outcome comparisons at early gestational ages. As such the analysis was limited to 32 to 41 weeks of gestation The variable “combined EGA”, which is an estimate of gestational age using a combination of LMP, ultrasound, and clinical dating – as commonly used in clinical practice- was used for this analysis.
There was minimal missing data for the exposure variables and primary outcomes of interest in this study. The data set included complete data on maternal race in 307,496 (99.7%) and gestational age in 307,880 (99.8%) births. Maternal race information was missing in only 815 (0.3%) birth records, and these were excluded from analysis. Data on father's race was missing in 26,987 (11.8%) of white mothers and 22,298 (49.2%) of black mothers. For the purposes of this study, the neonate's race was considered the same as the mother's race. As the reported identity and race of the father on the birth record is subject to error, misreport, or missing data, it was not considered as part of the definition of neonatal race in this study. There was minimal missing data (<5%) for each of the covariates included in the adjusted analysis, except for maternal weight which had 7.9% missing data.
Statistical analyses were performed using STATA Release 10 software (StataCorp, College Station, TX) and SAS version 9.2 (SAS Institute Inc., Cary, N.C.). Demographic characteristics were compared using the unpaired Student's t-test for continuous variables, and chi-square or Fisher's exact test as appropriate for categorical variables. We utilized generalized linear regression (GLM) to estimate adjusted relative risks (aRR) for the influence of race on composite adverse neonatal outcome stratified by week of gestation. Risk estimates were adjusted for statistically significant and biologically plausible coexisting risk factors including maternal hypertension, diabetes, limited prenatal care, hospital level, neonatal gender and tobacco use. As there is no clearly defined standard metric for quantity of prenatal care, we defined limited prenatal care as less than 5 prenatal visits for the purposes of this study. Adjustment for birth weight did not change the interpretation of the results, but in some models caused collinearity between covariates. For this reason, birth weight was not included in the final adjusted model. Adjusted relative risks (aRR) and 95% confidence intervals were reported for each of the primary outcomes. Comparisons with a p-value of less than 0.05 or 95 percent confidence interval not inclusive of the null were considered significant.
Results
There were 308,380 births in Ohio during the study period. After exclusions, 293,877 births remained for analysis, see Figure 1. Of those births, 227,910 (77.6) were to white mothers, 45,346 (15.4%) black, 1997 (0.7%) biracial (race reported as both black and white), and 18,624 (6.3%) were births to mothers of other race.
Demographic differences of the population are outlined in Table 1. Black mothers were younger but had a higher parity compared to white mothers. Black mothers were more likely to be obese, have a prior preterm birth, or a preexisting medical complication of hypertension or diabetes. Black mothers were more likely to have a limited number of prenatal care visits, be unmarried, and have state Medicaid insurance. The reported race of the father of the baby was the same as the mother in 96.4% of white and 93.1% of black mothers, although data on paternal race was missing for 11.8% of white mothers and 49.2% of black mothers. Mode of delivery was similar between black and white parturients.
Table I.
Demographic and Obstetric Characteristics of the Study Population, n=273,256.
| White n=227,910 (77.55 %) | Black n= 47,343 (16.11%) | |
|---|---|---|
| Parity mean | 1.05 ± 0.003 | 1.27 ± 0.008 |
| Parity Median (Interquartile range) | 1 (1,3) | 1 (1,3) |
| Age of mother | 28.3± 0.02 | 24.8 ±0.03 |
| Married | 150,347 (66.3) | 10,295 (21.8) |
| Prepregnancy BMI Mean | 25.83 ±.01 | 27.40 ±.03 |
| Obesity (BMI ≥ 30) | 61,685 (27.1) | 16,246 (35.8) |
| Prior PTB n (%) | 6,651 (3.0) | 1,943 (4.2) |
| Father's race – black* | 7,107 (3.6) | 22,087 (93.1) |
| Father's race – white* | 188,549 (96.4) | 1,648 (6.9) |
| AMA, age > 35 | 29,277(13.0) | 3576 (7.9) |
| Tobacco use | 47,662 (21.5) | 6350 (14.3) |
| Limited PNC (≤5 visits) | 15,382 (7.4) | 6754 (18.4) |
| Chronic HTN | 3708 (1.7) | 1057 (2.4) |
| Gestational hypertensive disorders | 8485 (3.8) | 1724 (3.9) |
| Pregestational DM | 1609 (0.7) | 443 (1.0) |
| Gestational DM | 10,329 (4.7) | 1818 (4.1) |
| Medicaid | 67,652 (32.1) | 27,927 (68.2) |
| Route of Delivery | ||
| Spontaneous Vaginal | 148,747 (65.3) | 29,930 (66.1) |
| Forceps | 4,337 (1.9) | 744 (1.6) |
| Vacuum Extraction | 10,665 (4.7) | 1,565 (3.5) |
| Cesarean | 63,931 (28.1) | 13,053 (28.7) |
All comparisons were significantly different (p-value <0.05).
Data on father's race was missing in 26,987 (11.8%) of white mothers and 22,298 (49.2%) of black mothers.
The most frequent gestational age at birth was 39 weeks for both black and white neonates. The frequency of adverse neonatal outcome was higher for white compared to black infants at all preterm gestational ages, but higher for black neonates at all term gestational ages, Table 2. This is graphically demonstrated in Figure 2, showing a similar appearing frequency distribution curve of adverse neonatal morbidity in black compared to white births by gestational age, but with the curve shifted to left (earlier gestational age) for black births by one week. The highest rate of adverse neonatal outcome was at the earliest gestational ages of prematurity for both black and white births. Births to both black and white mothers had declining rates of adverse neonatal outcome as the gestational age increased to term. Although the rate of morbidity was low at all term gestational ages in both races, and the week-by-week differences were small, the lowest rate of adverse outcome for black neonates was for birth at 38 weeks of gestation, 3.9%, and for white neonates was for birth at 39 weeks of gestation, 2.4%. The rate of adverse outcome in black births increased progressively from 38 to 41 weeks of gestational age, with a rate of 5.4% at 41 weeks of gestation. The rate of adverse outcome in white births also increased by week of gestation at term, but the rate did not increase until after 39 weeks and reached a maximum of 3.0% at 41 weeks of gestation.
Table II.
Neonatal Morbidity in Black and White Neonates by Week of Gestation.
| Combined neonatal morbidity | |||
|---|---|---|---|
| Gestational Age | White n (%) | Black n (%) | p-value |
| 32 | 280/1071 (26.1) | 90/421 (21.4) | 0.04 |
| 33 | 347/1504 (23.0) | 102/585 (17.4) | 0.005 |
| 34 | 572/2801 (20.4) | 142/962 (14.8) | <.001 |
| 35 | 648/4829 (13.4) | 149/1451 (10.3) | 0.001 |
| 36 | 780/9649 (8.1) | 150/2502 (6.0) | <.001 |
| 37 | 953/20,794 (4.6) | 248/4680 (5.3) | 0.064 |
| 38 | 1,342/48,146 (2.8) | 332/8610 (3.9) | <.001 |
| 39 | 1,574/65,309 (2.4) | 455/11,351 (4.0) | <.001 |
| 40 | 1,163/43,444 (2.7) | 357/8000 (4.5) | <.001 |
| 41 | 510/17,013 (3.0) | 175/3267 (5.4) | <.001 |
Combined neonatal morbidity defined as neonatal transfer, mechanical ventilation>6 hours, seizures, or Apgar score < 7 at 5 minutes.
Nadir of morbidity highlighted for each race.
Figure 2.
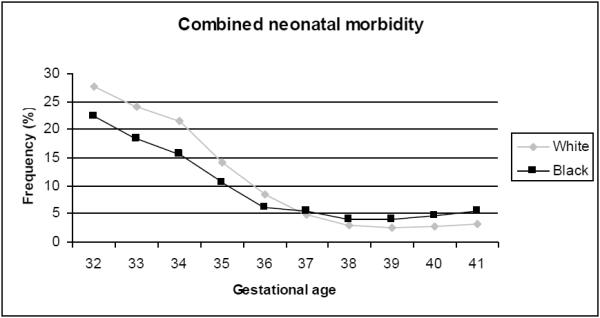
Frequency of neonatal morbidity by week of gestation in black and white infants
Individual neonatal morbidities occurred more frequently in black neonates compared to white, except neonatal transport to tertiary care facility and neonatal seizure, Table 3. To account for the influence of racial differences in births occurring at a tertiary facility, which would not necessitate neonatal transfer in most instances, we quantified the frequency of transport separately after accounting for hospital level. The proportion of black births occurring at a level III hospital, i.e. a tertiary facility, was higher than that for white births, 57% versus 31%, and these black births had a lower frequency of transport than white births (1.0% vs. 1.9%). However, black births at level I and II hospitals had higher frequency of transport than white births. When births in all hospital levels were included, the overall frequency of transport for black neonates was only slightly lower than white neonates (1.8% vs. 2.0%). After adjustment for hospital levels in the regression model, black neonates still had lower rate of composite morbidity from 32 to 36 weeks but higher rate of composite morbidity from 38 to 41 weeks.
Table III.
Frequency of Neonatal Morbidity by Race
| Neonatal Morbidity | White n (%) | Black n (%) | p Value |
|---|---|---|---|
| Antibiotic use | 2,462 (1.1) | 522 (1.2) | 0.309 |
| Mechanical ventilation >6 hours | 1,303 (0.6) | 311 (0.7) | <0.01 |
| Surfactant administration | 551 (0.2) | 126 (0.3) | 0.207 |
| NICU Admission | 10,039 (4.5) | 3,218 (7.2) | <0.01 |
| 5 min Apgar <7 | 5,508 (2.4) | 2,299 (5.1) | <0.01 |
| Birth Injury | 149 (0.1) | 21 (0.1) | 0.141 |
| Neonatal Transport | 4,524 (2.0) | 820 (1.8) | <0.01 |
| Neonatal Seizure | 155 (0.1) | 10 (0.02) | <0.01 |
| Composite Morbidity | 10,043 (4.6) | 3,105 (7.0) | <0.01 |
The overall frequency of composite neonatal morbidity was higher in black neonates (7.0%) than white (4.6%), p < 0.01. Compared to white neonates, black neonates have a reduced risk of gestational age specific composite morbidity during the preterm period through 36 weeks of gestation (Figure 3). The relative risk of adverse outcome for back compared to white births was 0.79 (95% CI 0.62–1.01) at 32 weeks of gestation, and was similarly less than 1.0 for each week of preterm gestational age thereafter up to 36 weeks of gestation. At 37 weeks of gestation the risk was borderlinely different between black and white neonates, aRR 1.17 (95% CI 0.99–1.38). After 37 weeks, the relative risk of adverse outcome in black neonates compared to white increased by each week of gestation to a maximum relative risk of 1.82 (95% CI 1.51–2.21) at 41 weeks of gestation.
Figure 3.
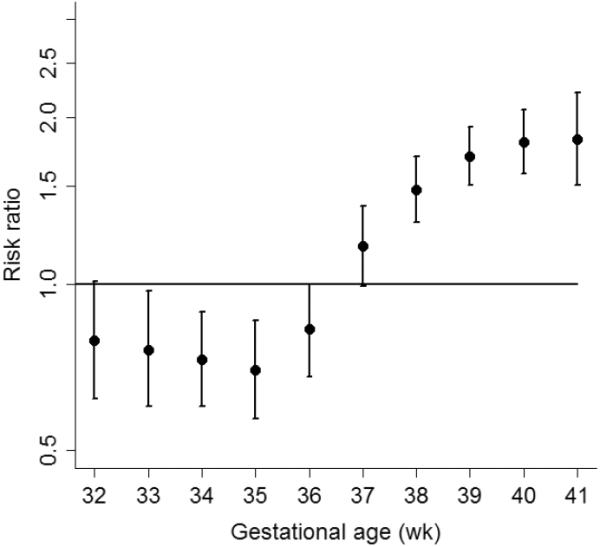
Relative Risk of neonatal morbidity in black compared to white infants by week of gestation
* footer: Risk estimates were adjusted for maternal hypertension, diabetes, limited prenatal care, hospital level, neonatal gender and tobacco use
Comment
These data demonstrate that black and white neonates have similar frequency distribution curves of neonatal morbidity, but the curve for black births is shifted to the left indicating a shorter normal gestational length. When matched for gestational age, black neonates have lower rates of morbidity in the preterm period than white neonates, indicating that black preterm neonates are inherently more mature. The lowest morbidity for black neonates is when birth occurs at 38 weeks, versus 39 weeks for white neonates. After 38 weeks of gestation, the relative risk of adverse outcome in black compared to white neonates modestly increases by each week of continued pregnancy.
The increase in preterm birth rates in black women is well described1. Increased risk for adverse outcome such as preterm birth and small for gestational age infants is increased in the black population3–5. Overall fetal and neonatal mortality is also higher in black mothers6. However, improved neonatal survival in black neonates compared to white at low birth weight and in premature infants has been described7–9. Alexander and colleagues have shown that the lowest tenth percentile of birth weight by gestational age increases less with each week of gestational age for black neonates compared with white. The flattened curve of weight gain by gestational age in their study may indicate an earlier point at which the placental function of black women becomes insufficient for continued support of the pregnancy. Our data would be consistent with the finding that black women may have a shorter programmed gestational length, with increased morbidity after 38 weeks.
One of the most significant strengths of this study includes the large population-based cohort utilized for analysis. The large sample size provides sufficient power to assess infrequent events such as adverse neonatal outcome, and stratify the frequency of this outcome by week of gestational age. The population-based nature of the cohort includes births to a wide variety of patient types, both low and high risk, delivered at a variety of hospital types including both community and tertiary referral centers. Thus we feel our findings are generalizable to many populations.
Weaknesses of the study include issues related to the validity of birth certificate data as it is reported. The reporting of morbidities on the birth certificate may miss morbidities that develop more than 2 days after birth. However, as the majority of early neonatal morbidity is present within the first 2 days of life, the effect of these late occurring morbidities is likely to be small and therefore unlikely to significantly underestimate the true morbidity. The primary outcomes studied have very little missing data in the dataset; however in controlling for co-morbid conditions, there may be under-represented conditions. The underreporting of medical conditions in birth certificate data has been previously reported10. As medical comorbidities were not the primary outcome of the study, and rather only used as a covariate, it is unlikely to significantly bias the resulting risk estimates. The exposure variable for this study, race, itself has been shown to be highly accurate by self report11. Concerns arise over assignment of gestational age; however the collected data is a combined gestational age by self report and clinical records, thus represents the best obstetric estimate of gestational age. If misclassification of gestational age is present, it is not likely to be systematic in nature and therefore randomly distributed and unlikely to bias outcome estimates in one direction of effect. Although the father's race is subject to considerable lack of data, with more data missing in the records of black mothers, this is also unlikely to significantly bias the results, and if so would most likely bias the results toward the null considering underreported biracial status.
The composite variables include the need for ventilation greater than 6 hours, neonatal transport, seizures and Apgar score less than 7 at 5 minutes. Each of these is discretely noted in the birth certificate record. The birth certificate contains separate codes for neonates intubated at birth versus those who required ventilator support for more than 6 hours. As those requiring prolonged support likely indicate a true morbidity compared to those who may have been intubated for prophylactic suctioning of meconium or other indications that did not require continuation of mechanical ventilation, we chose the variable “ventilator support > 6 hours” to include in our composite of neonatal morbidity. Neonatal seizures are more likely to occur in the first 48 hours of life, and thus this would be accurately reflected in the birth certificate record. Neonatal transport is also most likely to occur in the first 2 days of life and would be accurately recoded. The validity of composite neonatal morbidity has been previously reported12.
Fetal and neonatal deaths have been shown to be underreported in black women6. As the outcomes analyzed in this study (1–2 days post birth) would not have captured most neonatal deaths, those at the highest risk of death would have likely exhibited one of the morbidities included in our composite of adverse neonatal outcome. Additionally, not including stillbirths in this study would be unlikely to significantly impact the week by week comparisons of neonatal outcome as the overall rate of fetal mortality at the gestational ages analyzed in this study is low, less than 0.3 percent per week. Thus the impact of unanalyzed fetal or neonatal deaths is less likely to significantly change the outcome in this particular study, but could more significantly influence the result in a study of extreme prematurity.
To further characterize the effect of the variables included in the composite neonatal morbidity, the data were analyzed for other morbidities (birth injury, NICU admission, neonatal antibiotic administration, surfactant administration). These did not significantly change the frequency distribution curves. The effect of neonatal transport on composite morbidity was also analyzed. When neonatal transport was removed from the composite morbidity, the separation between the preterm curves was diminished, but the term curves stayed the same. This effect may in part be explained by the fact that neonatal transport was one of the most frequent adverse outcomes within the composite. With its removal, outcome differences became less prominent and statistical power to identify these differences decreased. Because the rate of neonatal transport was higher in white neonates than black neonates the effect was greater in white morbidity curve. As improved neonatal morbidity in black preterm neonates has been previously published, the absence of a difference was felt to be due to factors related to differences in delivery location. If black neonates are delivered more frequently at tertiary care centers, there will be less need for transport than would be expected for white neonates delivered at community hospitals. This could represent a socio-demographic bias. Conversely, if black neonates fare better (as has been previously reported) the need for neonatal transport may be less in that preterm population. Considering the population-based nature of this study, the births analyzed occurred in a multiracial community at differing levels of care by a variety of care provider types. Taking into consideration the inherent differences among individuals and between sites, we chose to include neonatal transport in the final composite outcome variable, rather than make inferences into the reason for its differential influence and potentially decrease the generalizability of our findings.
In conclusion, our study findings suggest that the optimal gestational length for black mothers may be shorter than that of white mothers. We find that black neonates have lower frequency of adverse outcome at preterm gestational ages than white, and “post-term” risk of adverse outcome occurs at an earlier gestational age in black than white mothers. Our findings suggest that consideration could be given to earlier initiation of antenatal fetal surveillance for black women at term. To provide the basis for clinical practice change, however, would require further study. Furthermore, we propose that future studies evaluating birth outcomes by gestational age should assess neonatal outcomes separately for black and white births.
Footnotes
Disclosure: None of the authors have a conflict of interest to report
Presented as an oral presentation at the Central Association of Obstetricians and Gynecologists Annual Meeting, Nassau, Bahamas Oct 27, 2011
Condensation: Black neonates have lower morbidity risk at preterm gestational ages and higher morbidity at term compared to white, suggesting a shorter optimal gestational length.
References
- 1.Martin JA, Hamilton BE, Sutton PD, et al. Births: final data for 2007. Natl Vital Stat Rep. 2010;58:1–85. [PubMed] [Google Scholar]
- 2.Macdorman MF. Race and ethnic disparities in fetal mortality, preterm birth, and infant mortality in the United States: an overview. Semin Perinatol. 2011;35:200–8. doi: 10.1053/j.semperi.2011.02.017. [DOI] [PubMed] [Google Scholar]
- 3.Nabukera SK, Wingate MS, Owen J, et al. Racial disparities in perinatal outcomes and pregnancy spacing among women delaying initiation of childbearing. Matern Child Health J. 2009;13:81–9. doi: 10.1007/s10995-008-0330-8. [DOI] [PubMed] [Google Scholar]
- 4.Alexander GR, Kogan MD, Himes JH, Mor JM, Goldenberg R. Racial differences in birthweight for gestational age and infant mortality in extremely-low-risk US populations. Paediatr Perinat Epidemiol. 1999;13:205–17. doi: 10.1046/j.1365-3016.1999.00174.x. [DOI] [PubMed] [Google Scholar]
- 5.Besculides M, Laraque F. Racial and ethnic disparities in perinatal mortality: applying the perinatal periods of risk model to identify areas for intervention. J Natl Med Assoc. 2005;97:1128–32. [PMC free article] [PubMed] [Google Scholar]
- 6.Wingate MS, Alexander GR. Racial and ethnic differences in perinatal mortality: the role of fetal death. Ann Epidemiol. 2006;16:485–91. doi: 10.1016/j.annepidem.2005.04.001. [DOI] [PubMed] [Google Scholar]
- 7.Alexander GR, Tompkins ME, Allen MC, Hulsey TC. Trends and racial differences in birth weight and related survival. Matern Child Health J. 1999;3:71–9. doi: 10.1023/a:1021849209722. [DOI] [PubMed] [Google Scholar]
- 8.Alexander GR, Tompkins ME, Altekruse JM, Hornung CA. Racial differences in the relation of birth weight and gestational age to neonatal mortality. Public Health Rep. 1985;100:539–47. [PMC free article] [PubMed] [Google Scholar]
- 9.Allen MC, Alexander GR, Tompkins ME, Hulsey TC. Racial differences in temporal changes in newborn viability and survival by gestational age. Paediatr Perinat Epidemiol. 2000;14:152–8. doi: 10.1046/j.1365-3016.2000.00255.x. [DOI] [PubMed] [Google Scholar]
- 10.Hosler AS, Nayak SG, Radigan AM. Agreement between self-report and birth certificate for gestational diabetes mellitus: New York State PRAMS. Matern Child Health J. 2010;14:786–9. doi: 10.1007/s10995-009-0529-3. [DOI] [PubMed] [Google Scholar]
- 11.Tang H, Quertermous T, Rodriguez B, et al. Genetic structure, self-identified race/ethnicity, and confounding in case-control association studies. Am J Hum Genet. 2005;76:268–75. doi: 10.1086/427888. [DOI] [PMC free article] [PubMed] [Google Scholar]
- 12.Lain SJ, Algert CS, Nassar N, Bowen JR, Roberts CL. Incidence of Severe Adverse Neonatal Outcomes: Use of a Composite Indicator in a Population Cohort. Matern Child Health J. 2011 doi: 10.1007/s10995-011-0797-6. [DOI] [PubMed] [Google Scholar]