

Abstract
New‐onset diabetes after liver transplantation (NODALT) is a frequent complication with an unfavorable outcome. We previously demonstrated a crucial link between donor graft genetics and the risk of NODALT. We selected 15 matched pairs of NODALT and non‐NODALT liver recipients using propensity score matching analysis. The donor liver tissues were tested for the expression of 10 microRNAs (miRNAs) regulating human hepatic glucose homeostasis. The biological functions of potential target genes were predicted using gene ontology and Kyoto Encyclopedia of Genes and Genomes (KEGG) enrichment analysis. Both miR‐103 and miR‐181a were significantly highly expressed in the NODALT group as compared to the non‐NODALT group. The predicted target genes (e.g. Irs2, Pik3r1, Akt2, and Gsk3b) were involved in glucose import and the insulin signaling pathway. We also observed dysregulation of miRNAs (e.g. let‐7, miR‐26b, miR‐145, and miR‐183) in cultured human hepatocytes treated with tacrolimus or high glucose, the two independent risk factors of NODALT identified in this cohort. The hepatic miRNA profiles altered by tacrolimus or hyperglycemia were associated with insulin resistance and glucose homeostatic imbalance as revealed by enrichment analysis. The disease susceptibility miRNA expressive pattern could be imported directly from the donor and consolidated by the transplant factors.
Keywords: translational research/science, liver transplantation/hepatology, diabetes: new onset/posttransplant, donors and donation: donor evaluation, immunosuppressant, calcineurin inhibitor: tacrolimus, microarray/gene array, liver allograft function/dysfunction
Short abstract
Donor graft microRNAs, initially controlling hepatic glucose homeostasis, could be affected by transplant factors such as early hyperglycemia and immunosuppressive drugs, and could subsequently contribute to the development of new‐onset diabetes in liver transplant recipients.
Abbreviations
- BMI
body mass index
- CREB
cyclic adenosine monophosphate responsive element binding protein
- GO
gene ontology
- KEGG
Kyoto Encyclopedia of Genes and Genomes
- miRNA
microRNA
- mRNA
messenger RNA
- NFAT
nuclear factor of activated T cell
- NODALT
new‐onset diabetes after liver transplantation
- TAC
tacrolimus
Introduction
New‐onset diabetes after liver transplantation (NODALT) is a frequent complication in liver recipients and is associated with an unfavorable clinical outcome 1, 2. Some well‐known risk factors in recipients have been identified, such as overweight, family history of diabetes mellitus, hepatitis C viral infection and immunosuppressive regimens 1, 2. However, the underlying mechanism for the development of NODALT remains poorly understood.
In our recent review, we proposed that the liver graft itself could be the origin of NODALT 3. The liver is a well‐known metabolic center and plays a key role in the glucose metabolism and homeostasis in liver transplant recipients. An increased amount of evidence has emerged that both the phenotype and genotype of the graft are involved in the development of NODALT 4, 5.
MicroRNA (miRNA) is a small, noncoding, single‐stranded RNA that functions in RNA silencing and posttranscriptional regulation. It plays important roles in maintaining normal physiology and in disease processes. Compared to messenger RNA (mRNA), miRNA is well conserved among vast species and highly stable in tissues, which makes it a promising modality in disease diagnosis, prognosis and therapy. It has been revealed that graft miRNA profiles could identify the risk of hepatitis C virus recurrence after liver transplantation 6. It is also known that miRNAs are involved in hepatic glucose metabolism. For instance, let‐7 7, miR‐29a 8, miR‐103/107 9, 10, miR‐143/145 11, 12, miR‐181a 13, miR‐183 14, and miR‐802 15 impair hepatic insulin sensitivity, whereas miR‐130a 16 and miR‐26a 17 increase insulin signaling. In addition, miR‐22‐3p 18 and miR‐26a 17 suppress gluconeogenesis. The dysregulation of hepatic miRNAs is closely associated with metabolic diseases. Therefore, in this study, we aimed to evaluate the impact of donor graft miRNAs on the development of NODALT.
Patients and Methods
Patients
A total of 213 adult patients with non‐pre‐existing diabetes who underwent liver transplantation between September 2011 and December 2014 at First Affiliated Hospital, College of Medicine, Zhejiang University, China, were included. There were 193 males and 19 females with a mean age of 46.8 ± 11.3 years. The majority of patients had hepatitis B–induced cirrhosis (89.6%). All patients were given lamivudine and low‐dose intramuscular hepatitis B immunoglobulin as a prophylactic measure. The immunosuppressive regimen was composed of tacrolimus (TAC), mycophenolate and steroids 4. All surgical procedures, including the organ procurement and transplantation, were performed by the same surgical team. This study was approved by the Institutional Review Board of First Affiliated Hospital at Zhejiang University following the guidelines of the Declaration of Helsinki. Informed consent was obtained. No donor livers were recovered from executed prisoners.
Data collection and definition
Patient demographics and clinical characteristics such as body mass index (BMI), primary liver disease, comorbidities, and biochemistry parameters (collected 24 h before transplantation) were obtained from the hospital's electronic medical records. The posttransplant blood glucose levels and TAC concentrations were monitored as closely as possible within the first 3 months after liver transplantation 4. NODALT was defined as a fasting blood glucose level of ≥7 mmol/L, a nonfasting blood glucose level of ≥11.1 mmol/L confirmed on at least two occasions or a need for antidiabetic drugs persisting beyond the first month after transplantation 4. Early hyperglycemia was defined as a fasting blood glucose level of ≥7.0 mmol/L confirmed on at least two occasions within the first posttransplant month (<30 days) 19. Extended‐criteria donors include those over the age of 50, or with steatosis > 30%, or cold ischemia time > 12 h 20.
Cell culture
Human hepatocellular carcinoma cell lines HepG2 and HUH7, purchased from the China Center for Type Culture Collection, were cultured in Dulbecco's Modified Eagle's medium (Thermo Fisher Scientific, Waltham, MA, USA) containing 1.0 g/L of glucose and 10% fetal bovine serum (FBS) at 37°C in a humidified atmosphere of 5% CO2. Cell line authentication was carried out using short tandem repeats profiling at the China Center for Type Culture Collection. TAC injection was supplied by Astellas Ireland Co., Ltd. (Killorglin, Kerry, Ireland). Cells were seeded at 2.5 × 10⁵ cells per well in six‐well plates and treated with different concentrations of TAC (0, 5, or 20 ng/mL) or glucose (5.5, 10, or 30 mM). Protein was extracted after 72 h of culture.
Quantitative real‐time polymerase chain reaction (PCR) analysis
Total RNA was extracted from the donor graft tissues and cultured human cell lines with TRIzol reagent (Invitrogen, Carlsbad, CA). MicroRNA detection was performed using an SYBR PrimeScript miRNA RT‐PCR Kit (TaKaRa, Dalian, China) according to the manufacturer's instructions. Ten miRNAs—miR‐22 18, miR‐26a 17, miR‐29a 8, miR‐103 9, miR‐107 10, miR‐130a 16, miR‐145 12, miR‐181a 13, miR‐183 14, and miR‐802 15—that have been reported to be associated with hepatic glucose metabolism in human tissue or cell lines were included (Table S1). Specific miRNA reverse transcription primers were purchased from Shanghai GenePharma Co., Ltd (Shanghai, China). Real‐time PCR was performed using an SYBR PCR kit in an Applied Biosystems 7900 Sequence Detection System (Life Technologies, Carlsbad, CA). All tests were run in triplicate. The expression of miRNA/mRNA was plotted as the average cycle threshold value for each triplicate sample minus the average triplicate value for U6/glyceraldehyde‐3‐phosphate dehydrogenase (GAPDH) using the 2−▵▵cycle threshold method.
miRNA microarray and bioinformatics analysis
Microarray profiles were obtained using a human Affymetrix GeneChip miRNA 4.0 Array (Affymetrix Technologies, Santa Clara, CA) in different concentrations (0, 5, or 20 ng/mL) of TAC‐treated HepG2 cells. After the significance (analysis of variance [ANOVA]) and false discovery rate (FDR) analyses, differentially expressed genes were selected according to certain criteria (p‐value <0.05, Q value <0.2 and fold change >1.2). Potential target genes of miRNAs were predicted by databases (miRanda and TargetScan) and underwent gene ontology (GO) and Kyoto Encyclopedia of Genes and Genomes (KEGG) pathway enrichment analyses using KOBAS 2.0 21. The glucose metabolism– and insulin signaling–associated pathways were identified. Gene‐Cloud of Biotechnology Information (https://www.gcbi.com.cn/gclib/html/index) was used to perform microarray data analysis. The microarray data were uploaded to the Gene Expression Omnibus (GSE81767, http://www.ncbi.nlm.nih.gov/geo/query/acc.cgi?acc=GSE81767).
Western blot analysis
Western blot analysis was performed as described previously. The primary antibodies used were antihuman IRS2 antibody (Catalog No. bs‐0173R, 1:500, bioss, Beijing, China), antihuman AKT antibody (Catalog No. 4685, 1:2000, Cell Signaling, Danvers, MA), antihuman pAKT (Ser473) antibody (Catalog No. 4060, 1:2000, Cell Signaling), antihuman FoxO1 antibody (Catalog No. 2880, 1:1000, Cell Signaling), antihuman TCF7L2 (TCF4) antibody (Catalog No. 2565, 1:1000, Cell Signaling), and anti‐β actin antibody (Catalog No. 3700, 1:3000, Cell Signaling). Actin was used as a loading control.
Statistical analysis
Quantitative variables were described as the mean ± standard deviation (SD), while categorical variables were presented as values (percentages). Quantitative variables were compared using an independent‐samples t‐test or the Mann–Whitney test, and categorical variables were compared using Pearson's χ2 test (Fisher's exact test). Cumulative survival was compared using Kaplan–Meier analysis with the log‐rank method. The risk factors were evaluated by logistic regression analysis. Patient selection was performed by propensity score matching 22. Pearson's product–moment correlation coefficient was used to evaluate the correlation. SPSS version 13.0 (SPSS Inc., Chicago, IL) was used to complete the analyses. A p‐value of <0.05 was considered statistically significant.
Results
Donor graft miRNAs are expressed differently in NODALT and non‐NODALT patients
Out of 213 liver recipients, 61 (28.2%) developed NODALT, with a median duration of 38 days (range: 30–423 days) postoperatively. As determined by logistic analysis, early hyperglycemia and high blood TAC concentration were two independent risk factors of NODALT, increasing disease risk by 1.7‐fold and 2.1‐fold, respectively (Table 1).
Table 1.
Logistic regression analysis of risk factors associated with NODALT
| Variable | Univariate analysis | Multivariate analysis | ||
|---|---|---|---|---|
| p | OR (95% CI) | p | OR (95% CI) | |
| Recipient age >55 years (0 = no, 1 = yes) | 0.039 | 2.052 (1.038–4.056) | – | – |
| Hyperglycemia <30 days (0 = no, 1 = transient, 2 = persistent) | 0.003 | 1.802 (1.217–2.669) | 0.006 | 1.743 (1.170–2.596) |
| Acute rejection (steroid pulse) <30 days (0 = no, 1 = yes) | 0.033 | 4.111 (1.117–15.13) | – | – |
| TAC level at 1 month >10 ng/mL (0 = no, 1 = yes) | 0.021 | 2.190 (1.127–4.254) | 0.036 | 2.067 (1.049–4.073) |
NODALT, new‐onset diabetes after liver transplantation; OR, odds ratio; CI, confidence interval; TAC, tacrolimus.
Matched by the aforementioned two risk factors as well as age and gender, 43 pairs of NODALT and non‐NODALT patients were initially selected. After eliminating recipients with extended‐criteria donors, 15 matched NODALT and non‐NODALT cases were chosen (Table 2). Compared to the non‐NODALT group, the NODALT patients had significantly higher miR‐103 (p = 0.013, fold change = 2.6) and miR‐181a (p = 0.002, fold change = 3.5) expression (Figure 1A). The expression of the other eight miRNAs did not differ significantly between the two groups (Figure S1). Furthermore, donor graft miR‐103 and miR‐181a levels were positively correlated with fasting blood glucose levels following liver transplantation (p < 0.05) (Figure 1B). According to GO and KEGG pathway analyses, the predicted target genes of miR‐103 and miR‐181a were involved in glucose import and the insulin signaling pathway—e.g. Irs1, Irs2, Pik3r1, Akt2, Gsk3b, Gys2, G6pc2, Hnf1a, Tcf7l2, and Foxo1 (Table S2).
Table 2.
Demographics and clinical data for NODALT and non‐NODALT groups
| Variable | NODALT group (n = 15) | Non‐NODALT group (n = 15) | p |
|---|---|---|---|
| Donor characteristics | |||
| Age (years) | 30.3 ± 7.6 | 33.8 ± 8.7 | 0.195 |
| Male/female (n) | 15/0 | 15/0 | – |
| Hepatic steatosis (n) | 0 | 0 | – |
| WITa (min) | 19.3 ± 4.0 | 20.6 ± 3.2 | 0.488 |
| CITb (h) | 8.9 ± 1.1 | 8.6 ± 1.7 | 0.387 |
| DCD/DBD/LDLT | 15/0/0 | 15/0/0 | – |
| Causes of injury (n) | |||
| Trauma | 12 | 11 | 0.425 |
| Stroke | 2 | 4 | |
| Anoxia | 1 | 0 | |
| Recipient characteristics | |||
| Age (years) | 47.9 ± 10.2 | 47.5 ± 9.2 | 0.899 |
| Male/female (n) | 15/0 | 15/0 | – |
| BMI (kg/m2) | 24.2 ± 3.7 | 23.3 ± 3.4 | 0.435 |
| HBV cirrhosis | 15 | 15 | – |
| HCC | 4 | 3 | 1.000 |
| MELD score | 16.0 ± 10.4 | 19.0 ± 8.9 | 0.465 |
| Kidney dysfunction | 1 | 2 | 1.000 |
| Dialysis | 0 | 0 | – |
Kidney dysfunction was defined as serum creatinine >1.5 mg/dL.
NODALT, new‐onset diabetes after liver transplantation; WIT, warm ischemia time; CIT, cold ischemia time; DCD, circulatory death donation; DBD, donation after brain death; LDLT, living donor liver transplantation; BMI, body mass index; HBV, hepatitis B virus; HCC, hepatocellular carcinoma; MELD, model for end‐stage liver diseases.
Time from hypotension (Systolic Blood Pressure <50 mmHg) until organ flushing.
Time from organ flushing until implantation.
Figure 1.
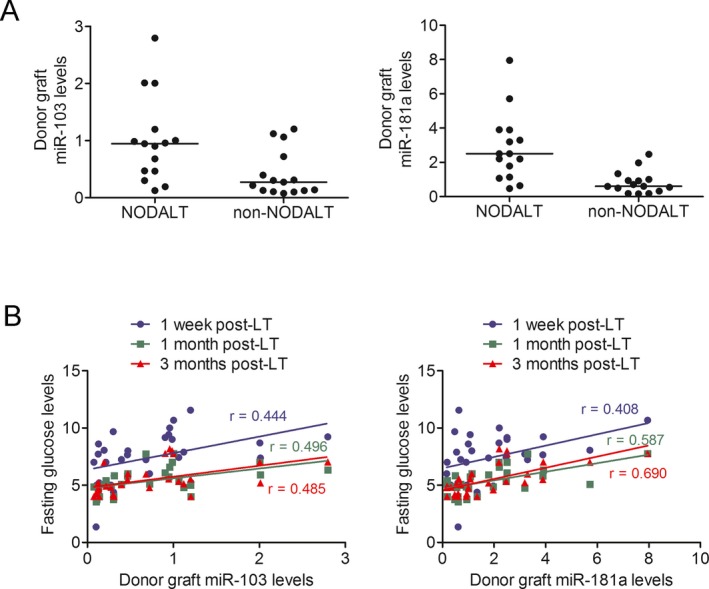
Donor grafts miR‐103 and miR‐181a were associated with NODALT . (A) Donor grafts miR‐103 and miR‐181a were significantly differentially expressed between 15 propensity‐matched patients with and without NODALT (both p < 0.05). (B) Donor graft miR‐103 and miR‐181a expressions were significantly correlated with fasting glucose levels at 1 week, 1 month and 3 months following liver transplantation. NODALT, new‐onset diabetes after liver transplantation; LT, liver transplantation.
TAC and hyperglycemia induce dysregulation of hepatic miRNAs
TAC has been considered a predominant contributor of new‐onset diabetes after solid organ transplantation. To evaluate the impact of TAC on hepatic miRNA profiles, we treated HepG2 cells with 0, 5 and 20 ng/mL of TAC for 24 h and compared the expression of miRNAs using microarrays. We observed 124 and 60 different expressed miRNAs between the low‐dose TAC group and the control group, as well as between the high‐dose TAC group and the control group, respectively (Table S3). Twenty‐seven miRNAs were significantly upregulated by both low‐ and high‐dose TAC, mostly in a dose‐related manner (Table 3). Their predicted target genes underwent GO and KEGG pathway analyses (Figure S2). We observed that TAC inhibited the calcium signaling pathway—e.g. Calm1, Camk2b, and Camk2g. Furthermore, two well‐described molecular targets of TAC in regulating insulin secretion—the cyclic adenosine monophosphate (cAMP) responsive element binding protein (CREB) transcriptional coactivator and the nuclear factor of activated T cells (NFAT)—were predicted to be the targets of miR‐4492 and miR‐320e, respectively. The main glucose metabolism– and insulin signaling–associated pathways are presented in Table 4. Out of the 27 miRNAs, let‐7 7 and miR‐183 14 were reported to impair hepatic insulin sensitivity, and miR‐26b 23 was revealed to promote lipid synthesis and accumulation. We also noted that Tcf7l2 and Foxo1, which are key molecules in the activation of gluconeogenesis, are targeted by miR‐183. In addition, Irs2/Akt2 and Gsk3b, which are associated with insulin signal transduction, are targeted by let‐7 and miR‐26b. We then verified the results in both HepG2 and HUH7 cells using real‐time PCR that TAC increased the expressions of let‐7a, miR‐26b and miR‐183 in a dose‐related manner (Figure 2A). We also found that prolonged incubation time resulted in elevated expressions of let‐7a, miR‐26b and miR‐183 only after a high concentration of TAC treatment (20 ng/mL) but not in a low concentration (5 ng/mL) (Figures 2BandC). Furthermore, we tested the mRNA levels and protein contents of the potential targets and found that they were decreased by TAC (Figure 2D).
Table 3.
MicroRNAs significantly upregulated by both low‐ and high‐dose TAC
| MicroRNA | Low‐dose TAC | High‐dose TAC | ||||||
|---|---|---|---|---|---|---|---|---|
| Fold change | p‐value | Q value | Trend | Fold change | p‐value | Q value | Trend | |
| Hsa‐let‐7a‐5p | 1.278 | 0.019 | 0.081 | Up | 1.544 | 0.021 | 0.177 | Up |
| Hsa‐let‐7c‐5p | 1.388 | 0.011 | 0.081 | Up | 1.492 | 0.031 | 0.177 | Up |
| Hsa‐let‐7f‐5p | 1.732 | 0.020 | 0.081 | Up | 2.036 | 0.007 | 0.177 | Up |
| Hsa‐miR‐26b‐3p | 1.518 | 0.002 | 0.000 | Up | 1.686 | 0.010 | 0.177 | Up |
| Hsa‐miR‐26b‐5p | 1.969 | 0.037 | 0.084 | Up | 2.108 | 0.025 | 0.177 | Up |
| Hsa‐miR‐146b‐5p | 1.440 | 0.007 | 0.062 | Up | 1.249 | 0.036 | 0.177 | Up |
| Hsa‐miR‐183‐5p | 1.239 | 0.019 | 0.081 | Up | 1.296 | 0.023 | 0.177 | Up |
| Hsa‐miR‐320e | 1.265 | 0.022 | 0.081 | Up | 1.285 | 0.035 | 0.177 | Up |
| Hsa‐miR‐374b‐5p | 3.199 | 0.003 | 0.000 | Up | 2.805 | 0.008 | 0.177 | Up |
| Hsa‐miR‐502‐5p | 1.642 | 0.002 | 0.000 | Up | 1.558 | 0.002 | 0.177 | Up |
| Hsa‐miR‐584‐5p | 2.697 | 0.050 | 0.084 | Up | 3.087 | 0.039 | 0.177 | Up |
| Hsa‐miR‐885‐3p | 1.888 | 0.009 | 0.081 | Up | 2.259 | 0.019 | 0.177 | Up |
| Hsa‐miR‐1184 | 2.237 | 0.005 | 0.053 | Up | 2.166 | 0.017 | 0.177 | Up |
| Hsa‐miR‐1343‐5p | 1.479 | 0.033 | 0.084 | Up | 1.435 | 0.048 | 0.177 | Up |
| Hsa‐miR‐3147 | 1.589 | 0.014 | 0.081 | Up | 1.662 | 0.027 | 0.177 | Up |
| Hsa‐miR‐3197 | 2.435 | 0.006 | 0.062 | Up | 2.547 | 0.011 | 0.177 | Up |
| Hsa‐miR‐3652 | 1.987 | 0.003 | 0.000 | Up | 2.046 | 0.006 | 0.177 | Up |
| Hsa‐miR‐4284 | 1.422 | 0.046 | 0.084 | Up | 1.759 | 0.019 | 0.177 | Up |
| Hsa‐miR‐4492 | 1.712 | 0.039 | 0.084 | Up | 2.181 | 0.031 | 0.177 | Up |
| Hsa‐miR‐4667‐5p | 1.582 | 0.032 | 0.084 | Up | 1.671 | 0.017 | 0.177 | Up |
| Hsa‐miR‐6735‐5p | 1.974 | 0.020 | 0.081 | Up | 2.537 | 0.017 | 0.177 | Up |
| Hsa‐miR‐6795‐5p | 1.650 | 0.004 | 0.053 | Up | 1.829 | 0.019 | 0.177 | Up |
| Hsa‐miR‐6861‐5p | 1.472 | 0.023 | 0.081 | Up | 1.771 | 0.030 | 0.177 | Up |
| Hsa‐miR‐6875‐5p | 2.079 | 0.006 | 0.062 | Up | 2.163 | 0.017 | 0.177 | Up |
| Hsa‐miR‐6887‐5p | 1.731 | 0.011 | 0.081 | Up | 1.806 | 0.012 | 0.177 | Up |
| Hsa‐miR‐7106‐5p | 2.213 | 0.036 | 0.084 | Up | 2.795 | 0.026 | 0.177 | Up |
| Hsa‐miR‐7111‐5p | 3.352 | 0.028 | 0.084 | Up | 3.176 | 0.030 | 0.177 | Up |
TAC, tacrolimus.
Table 4.
The glucose metabolism‐associated pathways identified by GO and KEGG pathway analysis using potential targets of microRNAs upregulated by both low‐ and high‐dose TAC
| ID | Name | Enrichment score | p‐value | FDR | Gene symbols |
|---|---|---|---|---|---|
| GO analysis | |||||
| 0006006 | Glucose metabolic process | 4.327 | 5.91E‐08 | 4.09E‐06 | PGAM1, GPI, PGM1, BRS3, PRKACA, PKLR, SERP1, KCNJ11, TNF, PFKFB2, PFKM, AKT2, PHKG2, PFKFB4, ADIPOQ, GYG2, IGFBP5, CALM1, IRS2, WDTC1 |
| 0042593 | Glucose homeostasis | 3.938 | 4.42 × 10⁻⁵ | 1.08 × 10⁻³ | TCF7L2, STAT3, MLXIPL, RPH3AL, IGFBP5, PFKM, ADIPOQ, PRKAA2, HNF4A, NGFR, SLC2A4, NCOR2, CACNA1E |
| 0008286 | Insulin receptor signaling pathway | 3.684 | 6.87 × 10⁻⁸ | 4.51 × 10⁻⁶ | IRS2, FOXC2, TSC1, FOXO4, PRKAA2, NAMPT, AKT2, EIF4G1, NRAS, PIK3R1, MAPK1, IDE, SOCS7, EEF2K, PRKAB2, PRKAG1, EIF4B, PDPK1, IGF1R, APPL1, STXBP4, FOXO1, FGFR1, EIF4EBP2 |
| 0046326 | Positive regulation of glucose import | 7.573 | 2.78 × 10⁻⁶ | 1.10 × 10⁻⁴ | PRKCD, GPC3, AKT2, PIK3R1, ARPP19, CREBL2, PRKCI, IRS2, ADIPOQ |
| 0009749 | Response to glucose stimulus | 4.309 | 7.87 × 10⁻⁵ | 1.70 × 10⁻³ | HNF4A, PRKCD, THBS1, TCF7L2, ADIPOQ, NNAT, ACVR2B, IRS2, PFKFB2, VAMP2, PKLR |
| 0032869 | Cellular response to insulin stimulus | 5.274 | 1.44 × 10⁻⁶ | 6.35 × 10⁻⁵ | SLC2A4, ACSL6, ADIPOQ, PKLR, AKT2, PRKCI, PDPK1, PRKCD, HDAC9, IRS2, VAMP2, PAK1, WDTC1 |
| KEGG pathway analysis | |||||
| 04910 | Insulin signaling pathway | 4.219 | 9.39 × 10⁻¹⁰ | 1.42 × 10⁻⁸ | SOCS4, PHKG2, CALM3, IRS2, ACACA, RAPGEF1, PKLR, AKT3, PRKACA, PDPK1, PRKAB2, PIK3R1, CBL, CALM1, AKT2, SLC2A4, FOXO1, GSK3B, PPP1R3D, PRKAA2, NRAS, PRKAG1, MAPK1, ELK1, PRKCI, TSC1 |
GO, gene ontology; KEGG, Kyoto Encyclopedia of Genes and Genomes; TAC, tacrolimus; FDR, false discovery rate.
Figure 2.
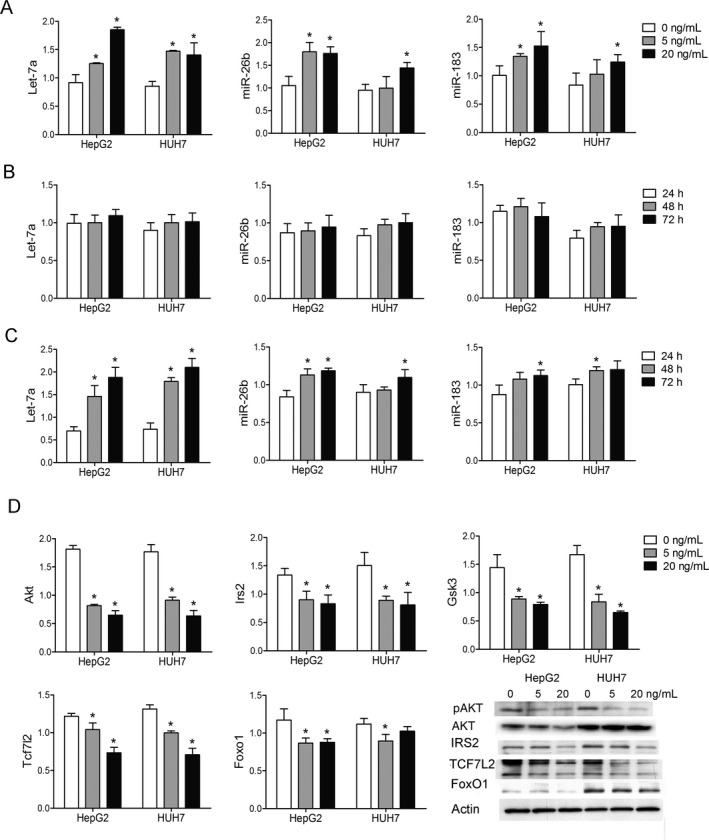
TAC‐induced dysregulation of mi RNA s and their potential targets. (A) The expressions of let‐7a, miR‐26b, and miR‐183 were significantly increased after different concentrations of TAC treatment (5 or 20 ng/mL vs. 0 ng/mL). (B) The expressions of let‐7a, miR‐26b, and miR‐183 did not significantly change after different culture times (48 or 72 h vs. 24 h) in physiological concentrations of TAC treatment (5 ng/mL). (C) The expressions of let‐7a, miR‐26b, and miR‐183 were increased in a time‐related manner (48 or 72 h vs. 24 h) in extremely high concentrations of TAC treatment (20 ng/mL). (D) The selected glucose metabolism‐associated targets (Akt, Irs2, Gsk3, Tcf7l2, and Foxo1) of let‐7, miR‐26b, and miR‐183 were significantly decreased after TAC treatment. The protein content of p‐AKT, AKT, IRS2, TCF7L2, and FoxO1 decreased after TAC treatment. HepG2 and HUH7 cells were seeded at 2.5 × 10⁵ cells per well in six‐well plates and treated with different concentrations of TAC (0, 5, or 20 ng/mL). Protein was extracted after 72 h of culture. *p < 0.05 versus control group. TAC, tacrolimus; miRNA, microRNA.
Early hyperglycemia was the other independent risk factor of NODALT besides TAC. To assess the effect of high glucose on hepatic miRNA levels, we treated HepG2 and HUH7 cells with 5.5, 10, and 30 mM of glucose for 24 h and tested for the expression of miRNAs. The expressions of miR‐145 and miR‐183 were increased after high glucose exposure in both cell lines (Figure 3), whereas the other eight miRNAs were not increased (Figure S3). Furthermore, we found that the elevation of miR‐145 and miR‐183 was time related in a 10‐mM glucose medium (Figure 3). The predicted target genes are key regulators involved in gluconeogenesis (e.g. Tcf7l2, Foxo1), glycogen synthesis (e.g. Gyg2, Gys1) and insulin signaling (e.g. Irs1, Irs2, Akt1, Akt2, Akt3).
Figure 3.
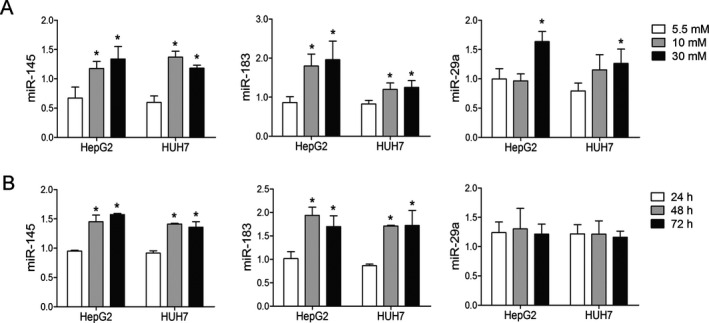
High glucose led to changed mi RNA levels in a dose‐ and time‐dependent manner. (A) The expressions of miR‐145, miR‐183, and miR‐29a significantly increased after high‐glucose culture. HepG2 and HUH7 cells were seeded at 2.5 × 10⁵ cells per well in six‐well plates and treated with different concentrations of glucose (5.5, 10, or 30 mM). (B) The expressions of miR‐145 and miR‐183 elevated in a time‐dependent manner when cultured with 10 mM of glucose. RNA was extracted after 24, 48, and 72 h of culture. *p < 0.05 versus control group. miRNA, microRNA.
Discussion
We have previously demonstrated that donor grafts carry disease susceptibility genes to recipients and contribute to the development of metabolic disorders 4, 24. This study, from the view of miRNA, further confirmed our previous findings and demonstrated that donor grafts with certain miRNA profiles had a greater risk of developing NODALT. We found markedly higher hepatic miR‐103 and miR‐181a expression in liver recipients with NODALT as compared to those without NODALT in a propensity‐matched cohort. Elevated miR‐103 and miR‐181a levels in the donor grafts correlated with increased blood glucose levels following liver transplantation. The possible underlying mechanism is that the two miRNAs target several key genes involved in insulin signal transduction and glucose homeostasis, as revealed by the enrichment analysis. Among these predicted targets, some have been verified by previous studies. Trajkovski et al 10 have demonstrated that miR‐103 directly targets caveolin‐1, thereby diminishing the number of insulin receptors and reducing downstream insulin signaling in both human and rodent models. Zhou et al 13 have shown that miR‐181a directly targets sirtuin‐1 and induces hepatic insulin resistance in human hepatocytes and transgenic mouse models. Therefore, we believe that the addition of miR‐103 and miR‐181a to the donor graft impairs hepatic insulin sensitivity, which could be the “first hit” in the development of NODALT.
Furthermore, we propose that hyperglycemia and TAC—the two identified independent risk factors of NODALT in this study—act as a “second hit” in the development of NODALT. Immunosuppressive drugs have long been regarded as the major contributor to the development of diabetes in almost all types of solid organ transplantation. Since the implementation of the steroid‐free protocol among organ transplantation recipients, calcineurin inhibitors, mainly TAC, have been regarded as one of the primary diabetogenic agents 19, 25. Clinical studies—as well as our current work—have shown the significance of TAC in the development of NODALT 4, 19, 25, 26. However, the underlying mechanism has not yet been fully elucidated. Previous experimental studies have demonstrated that TAC reduces insulin secretion in pancreatic β cells 27 and may also induce insulin resistance 28. We provide evidence that the liver is another target organ of TAC. Hepatic glucose homeostasis could be altered by TAC via regulating miRNA expression. As revealed by the enrichment analyses, TAC could potentially upregulate the expression of 27 miRNAs and affect the glucose metabolic process and insulin signaling transduction. We further proved that TAC can induce hepatic insulin resistance via upregulation of let‐7 and miR‐26b, which target the IRS2/PI3K/AKT pathway. TAC also attenuated gluconeogenesis by upregulation of miR‐183, which targets TCF7L2 and FoxO1. Only a high concentration of TAC could induce the time‐dependent elevation of certain miRNA profiles that are involved in hepatic glucose metabolism. This may explain the higher risk of developing NODALT in patients with a high concentration of TAC.
According to a recent national report, hyperglycemia in the immediate posttransplant period is considered a major predictor of NODALT 19. In kidney transplant recipients, immediate posttransplant insulin therapy, leading to better blood glucose control, was found to reduce the risk of developing new‐onset diabetes 29. One possible explanation is glucose's direct toxicity in pancreatic β cells 30; another is hyperglycemia‐induced peripheral insulin resistance 31. In vitro experiments usually require high glucose exposure to establish insulin‐resistant models. In human and rodent hepatocytes, high glucose treatment significantly inhibits AKT phosphorylation and IRS‐1 expression and subsequently reduces glucose uptake 31, 32. A recent gene network analysis in human liver cancer cells showed that high glucose concentration regulates the transcription of genes involved in several signaling pathways, including glycolysis, regulators of reactive oxygen species production (e.g. glucose oxidase, cyclooxygenase 2, adenosine monophosphate kinase [AMPK]) and second‐messenger signaling pathways (e.g. PI3K/AKT) 33. In this study, we showed that high glucose treatment modulated the expression of hepatic miRNAs, which presented as an insulin‐resistant pattern. In high‐glucose stressed human hepatocytes, the expressions of miR‐29a and miR‐145 were significantly increased in a dose‐ and time‐dependent manner. The predicted target genes were involved in hepatic glucose homeostasis and insulin signal transduction. Therefore, hyperglycemia may induce the alteration of hepatic miRNAs and subsequently lead to hepatic insulin resistance and glucose homeostatic imbalance.
We acknowledge that this study has some limitations. First, this was a single‐center study with a small sample size. In order to control confounding factors and better elucidate the effect of the genetic profile, only a limited number of cases were selected for the study. Therefore, the results need to be validated in large cohorts, preferably including other ethnic populations. Second, although the diagnostic criteria of brain death were defined by the Chinese Ministry of Health in 2003, brain death in organ donation has not been widely accepted by the general public in China because of the culture barrier. Donation after circulatory death provides the predominant source of organs for transplantation during the study period. We excluded extended‐criteria donors such as those with aged livers 34, fatty livers 35, and grafts with prolonged ischemia time 36, which could potentially bring diabetes susceptibility genes to the recipients. However, donation after circulatory death of the graft itself might increase the risk of developing NODALT due to warm ischemia 5. Therefore, the results also need to be verified among patients receiving liver grafts from donors after brain death.
In summary, donor graft miRNAs targeting multiple genes involved in hepatic glucose metabolism and insulin signaling are associated with the development of NODALT. The disease susceptibility miRNA expressive pattern could be imported directly from the donor and could be greatly consolidated and augmented by transplant factors such as early hyperglycemia and immunosuppressive drugs. The “two‐hit” mechanism indicates that miRNA‐targeted therapy in donor grafts may be a novel and promising strategy for the prophylaxis and treatment of NODALT and other posttransplant complications.
Disclosure
The authors of this manuscript have no conflicts of interest to disclose as described by the American Journal of Transplantation.
Supporting information
Table S1: The polymerase chain reaction (PCR) primers.
Table S2: The glucose metabolism‐associated gene ontology (GO) and Kyoto Encyclopedia of Genes and Genomes (KEGG) pathway analyses of potential target genes of miR‐103 and miR‐181a.
Table S3: The significant dysregulated microRNAs by tacrolimus.
Table S4: The glucose metabolism‐associated gene ontology (GO) and Kyoto Encyclopedia of Genes and Genomes (KEGG) pathway analyses of potential target genes of miR‐29a and miR‐145.
Figure S1: The expressions of miR‐22, miR‐26a, miR‐29a, miR‐107, miR‐130a, miR‐145, miR‐183, and miR‐802 did not differ significantly between patients with and without new‐onset diabetes after liver transplantation (NODALT).
Figure S2: Gene ontology (GO) and Kyoto Encyclopedia of Genes and Genomes (KEGG) pathway analyses for the target genes of the 27 miRNAs significantly upregulated by both low‐ and high‐dose tacrolimus. Top 50 pathways with p‐value <0.05 and false discovery rate (FDR) value <0.05 are shown.
Figure S3: The expressions of miR‐22, miR‐26a, miR‐103, miR‐107, miR‐130a, and miR‐181a did not differ significantly after high glucose exposure for 24 h in both cell lines (HepG2 and HUH7). The expression of miR‐802 was undetectable. *p < 0.05.
Acknowledgments
This study was supported by the National Natural Science Foundation of China (81470892, 81570589, and 91542205).
Ling Q, Xie H, Li J, Liu J, Cao J, Yang F, Wang C, Hu Q, Xu X & Zheng S. Donor Graft MicroRNAs: A Newly Identified Player in the Development of New‐onset Diabetes After Liver Transplantation. Am J Transplant 2017; 17: 255–264
Contributor Information
X. Xu, Email: zjxu@zju.edu.cn
S. Zheng, Email: zyzss@zju.edu.cn
References
- 1. Sarno G, Mehta RJ, Guardado‐Mendoza R, Jimenez‐Ceja LM, De Rosa P, Muscogiuri G. New‐onset diabetes mellitus: Predictive factors and impact on the outcome of patients undergoing liver transplantation. Curr Diabetes Rev 2013; 9: 78–85. [PubMed] [Google Scholar]
- 2. Parekh J, Corley DA, Feng S. Diabetes, hypertension and hyperlipidemia: Prevalence over time and impact on long‐term survival after liver transplantation. Am J Transplant 2012; 12: 2181–2187. [DOI] [PubMed] [Google Scholar]
- 3. Ling Q, Xu X, Wang B, Li L, Zheng S. The origin of new‐onset diabetes after liver transplantation: Liver, islets, or gut? Transplantation 2016; 100: 808–813. [DOI] [PubMed] [Google Scholar]
- 4. Ling Q, Xie H, Lu D, et al. Association between donor and recipient TCF7L2 gene polymorphisms and the risk of new‐onset diabetes mellitus after liver transplantation in a Han Chinese population. J Hepatol 2013; 58: 271–277. [DOI] [PubMed] [Google Scholar]
- 5. Hartog H, May CJ, Corbett C, et al. Early occurrence of new‐onset diabetes after transplantation is related to type of liver graft and warm ischaemic injury. Liver Int 2015; 35: 1739–1747. [DOI] [PubMed] [Google Scholar]
- 6. Gehrau RC, Mas VR, Villamil FG, et al. MicroRNA signature at the time of clinical HCV recurrence associates with aggressive fibrosis progression post‐liver transplantation. Am J Transplant 2013; 13: 729–737. [DOI] [PubMed] [Google Scholar]
- 7. Frost RJ, Olson EN. Control of glucose homeostasis and insulin sensitivity by the Let‐7 family of microRNAs. Proc Natl Acad Sci U S A 2011; 108: 21075–21080. [DOI] [PMC free article] [PubMed] [Google Scholar]
- 8. Pandey AK, Verma G, Vig S, Srivastava S, Srivastava AK, Datta M. miR‐29a levels are elevated in the db/db mice liver and its overexpression leads to attenuation of insulin action on PEPCK gene expression in HepG2 cells. Mol Cell Endocrinol 2011; 332: 125–133. [DOI] [PubMed] [Google Scholar]
- 9. Xu Q, Li Y, Shang YF, Wang HL, Yao MX. miRNA‐103: Molecular link between insulin resistance and nonalcoholic fatty liver disease. World J Gastroenterol 2015; 21: 511–516. [DOI] [PMC free article] [PubMed] [Google Scholar]
- 10. Trajkovski M, Hausser J, Soutschek J, et al. MicroRNAs 103 and 107 regulate insulin sensitivity. Nature 2011; 474: 649–653. [DOI] [PubMed] [Google Scholar]
- 11. Jordan SD, Kruger M, Willmes DM, et al. Obesity‐induced overexpression of miRNA‐143 inhibits insulin‐stimulated AKT activation and impairs glucose metabolism. Nat Cell Biol 2011; 13: 434–446. [DOI] [PubMed] [Google Scholar]
- 12. Wen F, Yang Y, Jin D, Sun J, Yu X, Yang Z. MiRNA‐145 is involved in the development of resistin‐induced insulin resistance in HepG2 cells. Biochem Biophys Res Commun 2014; 445: 517–523. [DOI] [PubMed] [Google Scholar]
- 13. Zhou B, Li C, Qi W, et al. Downregulation of miR‐181a upregulates sirtuin‐1 (SIRT1) and improves hepatic insulin sensitivity. Diabetologia 2012; 55: 2032–2043. [DOI] [PubMed] [Google Scholar]
- 14. Motino O, Frances DE, Mayoral R, et al. Regulation of microRNA 183 by cyclooxygenase 2 in liver is DEAD‐box helicase p68 (DDX5) dependent: Role in insulin signaling. Mol Cell Biol 2015; 35: 2554–2567. [DOI] [PMC free article] [PubMed] [Google Scholar]
- 15. Kornfeld JW, Baitzel C, Konner AC, et al. Obesity‐induced overexpression of miR‐802 impairs glucose metabolism through silencing of Hnf1b. Nature 2013; 494: 111–115. [DOI] [PubMed] [Google Scholar]
- 16. Xiao F, Yu J, Liu B, et al. A novel function of microRNA 130a‐3p in hepatic insulin sensitivity and liver steatosis. Diabetes 2014; 63: 2631–2642. [DOI] [PubMed] [Google Scholar]
- 17. Fu X, Dong B, Tian Y, et al. MicroRNA‐26a regulates insulin sensitivity and metabolism of glucose and lipids. J Clin Invest 2015; 125: 2497–2509. [DOI] [PMC free article] [PubMed] [Google Scholar]
- 18. Kaur K, Vig S, Srivastava R, et al. Elevated hepatic miR‐22‐3p expression impairs gluconeogenesis by silencing the Wnt‐responsive transcription factor Tcf7. Diabetes 2015; 64: 3659–3669. [DOI] [PubMed] [Google Scholar]
- 19. Ling Q, Xu X, Xie H, et al. New‐onset diabetes after liver transplantation: A national report from China Liver Transplant Registry. Liver Int 2016; 36: 705–712. [DOI] [PubMed] [Google Scholar]
- 20. Chinese Society of Organ Transplantation ; Section of Organ Transplantation, Chinese Society of Surgery ; Chinese College of Transplant Doctors . Expert consensus on evaluation and application of organ donated after cardiac death in China. Chin J Transplant 2014; 8: 117–122. [Google Scholar]
- 21. Xie C, Mao X, Huang J, et al. KOBAS 2.0: A web server for annotation and identification of enriched pathways and diseases. Nucleic Acids Res 2011; 39: W316–W322. [DOI] [PMC free article] [PubMed] [Google Scholar]
- 22. Jo JY, Choi SS, Yi JM, et al. Differential postoperative effects of volatile anesthesia and intraoperative remifentanil infusion in 7511 thyroidectomy patients: A propensity score matching analysis. Medicine (Baltimore) 2016; 95: e2764. [DOI] [PMC free article] [PubMed] [Google Scholar]
- 23. Wang H, Luo J, Zhang T, et al. MicroRNA‐26a/b and their host genes synergistically regulate triacylglycerol synthesis by targeting the INSIG1 gene. RNA Biol 2016; 13: 500–510. [DOI] [PMC free article] [PubMed] [Google Scholar]
- 24. Ling Q, Xu X, Wang K, et al. Donor PPARalpha gene polymorphisms influence the susceptibility to glucose and lipid disorders in liver transplant recipients: A strobe‐compliant observational study. Medicine (Baltimore) 2015; 94: e1421. [DOI] [PMC free article] [PubMed] [Google Scholar]
- 25. Kuo HT, Sampaio MS, Ye X, Reddy P, Martin P, Bunnapradist S. Risk factors for new‐onset diabetes mellitus in adult liver transplant recipients, an analysis of the Organ Procurement and Transplant Network/United Network for Organ Sharing database. Transplantation 2010; 89: 1134–1140. [DOI] [PubMed] [Google Scholar]
- 26. Lankarani KB, Eshraghian A, Nikeghbalian S, Janghorban P, Malek‐Hosseini SA. New onset diabetes and impaired fasting glucose after liver transplant: Risk analysis and the impact of tacrolimus dose. Exp Clin Transplant 2014; 12: 46–51. [DOI] [PubMed] [Google Scholar]
- 27. Chakkera HA, Mandarino LJ. Calcineurin inhibition and new‐onset diabetes mellitus after transplantation. Transplantation 2013; 95: 647–652. [DOI] [PMC free article] [PubMed] [Google Scholar]
- 28. Larsen JL, Bennett RG, Burkman T, et al. Tacrolimus and sirolimus cause insulin resistance in normal Sprague Dawley rats. Transplantation 2006; 82: 466–470. [DOI] [PubMed] [Google Scholar]
- 29. Hecking M, Haidinger M, Doller D, et al. Early basal insulin therapy decreases new‐onset diabetes after renal transplantation. J Am Soc Nephrol 2012; 23: 739–749. [DOI] [PMC free article] [PubMed] [Google Scholar]
- 30. Kawahito S, Kitahata H, Oshita S. Problems associated with glucose toxicity: Role of hyperglycemia‐induced oxidative stress. World J Gastroenterol 2009; 15: 4137–4142. [DOI] [PMC free article] [PubMed] [Google Scholar]
- 31. Hu Y, Hou Z, Liu D, Yang X. Tartary buckwheat flavonoids protect hepatic cells against high glucose‐induced oxidative stress and insulin resistance via MAPK signaling pathways. Food Funct 2016; 7: 1523–1536. [DOI] [PubMed] [Google Scholar]
- 32. Lee CC, Hsu WH, Shen SR, Cheng YH, Wu SC. Fagopyrum tataricum (buckwheat) improved high‐glucose‐induced insulin resistance in mouse hepatocytes and diabetes in fructose‐rich diet‐induced mice. Exp Diabetes Res 2012; 2012: 375673. [DOI] [PMC free article] [PubMed] [Google Scholar]
- 33. Berger E, Vega N, Weiss‐Gayet M, Geloen A. Gene network analysis of glucose linked signaling pathways and their role in human hepatocellular carcinoma cell growth and survival in HuH7 and HepG2 cell lines. Biomed Res Int 2015; 2015: 821761. [DOI] [PMC free article] [PubMed] [Google Scholar]
- 34. Kwekel JC, Desai VG, Moland CL, Branham WS, Fuscoe JC. Age and sex dependent changes in liver gene expression during the life cycle of the rat. BMC Genom 2010; 11: 675. [DOI] [PMC free article] [PubMed] [Google Scholar]
- 35. Sobolewski C, Calo N, Portius D, Foti M. MicroRNAs in fatty liver disease. Semin Liver Dis 2015; 35: 12–25. [DOI] [PubMed] [Google Scholar]
- 36. Farid WR, Pan Q, van der Meer AJ, et al. Hepatocyte‐derived microRNAs as serum biomarkers of hepatic injury and rejection after liver transplantation. Liver Transpl 2012; 18: 290–297. [DOI] [PubMed] [Google Scholar]
Associated Data
This section collects any data citations, data availability statements, or supplementary materials included in this article.
Supplementary Materials
Table S1: The polymerase chain reaction (PCR) primers.
Table S2: The glucose metabolism‐associated gene ontology (GO) and Kyoto Encyclopedia of Genes and Genomes (KEGG) pathway analyses of potential target genes of miR‐103 and miR‐181a.
Table S3: The significant dysregulated microRNAs by tacrolimus.
Table S4: The glucose metabolism‐associated gene ontology (GO) and Kyoto Encyclopedia of Genes and Genomes (KEGG) pathway analyses of potential target genes of miR‐29a and miR‐145.
Figure S1: The expressions of miR‐22, miR‐26a, miR‐29a, miR‐107, miR‐130a, miR‐145, miR‐183, and miR‐802 did not differ significantly between patients with and without new‐onset diabetes after liver transplantation (NODALT).
Figure S2: Gene ontology (GO) and Kyoto Encyclopedia of Genes and Genomes (KEGG) pathway analyses for the target genes of the 27 miRNAs significantly upregulated by both low‐ and high‐dose tacrolimus. Top 50 pathways with p‐value <0.05 and false discovery rate (FDR) value <0.05 are shown.
Figure S3: The expressions of miR‐22, miR‐26a, miR‐103, miR‐107, miR‐130a, and miR‐181a did not differ significantly after high glucose exposure for 24 h in both cell lines (HepG2 and HUH7). The expression of miR‐802 was undetectable. *p < 0.05.