Abstract
We develop a knowledge-based approach (called PROSP) for protein secondary structure prediction. The knowledge base contains small peptide fragments together with their secondary structural information. A quantitative measure M, called match rate, is defined to measure the amount of structural information that a target protein can extract from the knowledge base. Our experimental results show that proteins with a higher match rate will likely be predicted more accurately based on PROSP. That is, there is roughly a monotone correlation between the prediction accuracy and the amount of structure matching with the knowledge base. To fully utilize the strength of our knowledge base, a hybrid prediction method is proposed as follows: if the match rate of a target protein is at least 80%, we use the extracted information to make the prediction; otherwise, we adopt a popular machine-learning approach. This comprises our hybrid protein structure prediction (HYPROSP) approach. We use the DSSP and EVA data as our datasets and PSIPRED as our underlying machine-learning algorithm. For target proteins with match rate at least 80%, the average Q3 of PROSP is 3.96 and 7.2 better than that of PSIPRED on DSSP and EVA data, respectively.
INTRODUCTION
Protein secondary structures serve as important building blocks in comparative modeling and protein threading methods for protein 3D structure prediction. They can be used to generate templates for protein 3D structure prediction algorithms to build protein structure models. The precision of protein secondary structure prediction greatly affects the quality of generated templates (1).
A protein secondary structure prediction algorithm transfers protein sequences to their secondary structures, where each amino acid is assigned one of three structures: helix (H), strand (E) or others (L). Secondary structure prediction is improved using evolutionary information. Either multiple sequence alignment is used to find conserved regions, or PSI-BLAST is used to generate profiles of the sequences. Both conserved regions and profiles provide evolutionary information. Currently, many popular prediction methods use profile to capture evolutionary information, and machine-learning approaches to predict the structure (2–14). Among these prediction methods, PHD (13) and PSIPRED (7,10) are most frequently used, and both are based on a neural network approach. In order to find evolutionary information to feed into the neural network, PHD uses BLAST to find homologues and uses MaxHom for multiple sequence alignment; PSIPRED uses PSI-BLAST to find homologues. (PHD has a newer version PHDpsi, which no longer uses BLAST and MAXHOM; it uses PSI-BLAST as well.) PHD achieves a Q3 accuracy of 75.1 and PSIPRED achieves an accuracy of 76.6 (15). Their behavior is similar for many datasets. The advantage of these machine-learning approaches is that evolutionary information, amino acid and structure propensities, as well as global sequence compositions can all be taken into account. The drawback of the neural network approach is that, it is not clear how the additional evolutionary information affects the prediction accuracy.
In this paper, we present a knowledge-based prediction algorithm, called PROSP, and a new similarity measure, called match rate, with regard to secondary structure prediction. (The source code of PROSP, tools to generate/query peptide knowledge base and knowledge base generated by using EVA dataset are available at http://bioinformatics.iis.sinica.edu.tw/HYPROSP/.) Our hybrid prediction method, HYPROSP, which combines PROSP and PSIPRED, can achieve better overall prediction accuracy. In a certain aspect, the idea of PROSP is similar to that of an earlier work, PREDATOR (16): both of them use local information of remote homologues to improve prediction accuracy. However, PREDATOR uses FASTA to find homologous proteins. It does not create any knowledge base, database nor define any new similarity measure.
METHODS
Our proposed hybrid method is called HYPROSP, which stands for HYbrid PROtein Structure Prediction. HYPROSP combines our knowledge-based approach, PROSP, with the machine-learning approach, PSIPRED. In PROSP, we construct a knowledge base containing small peptide fragments along with their structural information. When a target protein (i.e. a protein whose structure is unknown and targeted for prediction) can extract sufficient structural information from the knowledge base, PROSP can usually make a better prediction than machine-learning approaches and is therefore adopted. Otherwise, its prediction is left to PSIPRED. The match rate is introduced to measure the amount of structural information a protein sequence can extract from the knowledge base. The cornerstone of HYPROSP is the construction of a peptide knowledge base.
Constructing a knowledge base
We construct a knowledge base containing diverse peptide fragments and their structural information as follows. Initially, all peptides in the training set (containing proteins with known structural information, usually a subset of the DSSP database) are included in the knowledge base. Since the information content is not rich enough, PSI-BLAST is used to amplify the effect of the training set by finding more loosely similar peptides from proteins in NCBI nr database, which will inherit structure information from the training set. Most researchers use multiple sequence alignment such as PSI-BLAST profiles to infer global similarity. Since our target is to find similar peptides, we adopt a different strategy here by using local similarity derived from PSI-BLAST high score segment pairs (HSPs). HSPs have good local alignment and provide direct sequence–structural information, which allow similar peptides to inherit structures from their counterparts in the training set.
The DSSP database uses eight secondary structure states, H, I, G, E, B, S, T and – (blank). We follow the same scheme used by PHD and PSIPRED to reduce the eight states to three, where H, I and G become helix (H), E and B become strand (E), and the remaining states become others (L). Each protein in the training set contains its sequence and structural information expressed by H, E and L.
For each protein p in the training set, we apply PSI-BLAST to find its HSPs. Each HSP is an alignment of a subsequence of protein p and a subsequence of another protein, and this pair of subsequences achieves high alignment score. Alignment scores of HSPs are assigned the sum of scores of pairwise aligned amino acids, which are given by the BLOSUM62 scoring matrix (17). In an HSP, the structure of the counterpart of p is very likely unknown. We then try to find similar peptides within HSPs so that we can assign structure of p to those with unknown structure.
In what follows, we use peptides to mean peptides of length w. For each protein p in the training set, carry out the following procedure.
Step 1: Perform three iterations (parameter j is set to 3) of PSI-BLAST on all training set data to find HSPs. Parameter e is set to 0.01 (E-value < 0.01); the search target is NCBI nr protein database. All HSPs obtained from these three rounds are stored.
Step 2: Determine similar peptides in each HSP. Given an HSP, we use a sliding window W of size w to scan the alignment. If at least k out of w positions in the sliding window have positive scores (i.e. the number of exact matches and positive signs in the alignment is at least k), these two peptides are regarded as similar.
Step 3: For each pair of similar peptides, determine the record to store in the knowledge base. We use pl to denote a peptide in protein p that is similar to a peptide ql in another protein. We use s(≥k) to denote the number of exact matches and positive signs between pl and ql. When the structure of ql is unknown, we assign ql the structure of pl and a confidence score S(ql) to reflect the reliability of such structure assignment, where S(ql) is a function of s and the alignment score obtained by PSI-BLAST. Intuitively, larger s and larger alignment score generate larger S(ql), which implies higher confidence. We then store the record (ql, structure of pl, S(ql)) in the knowledge base.
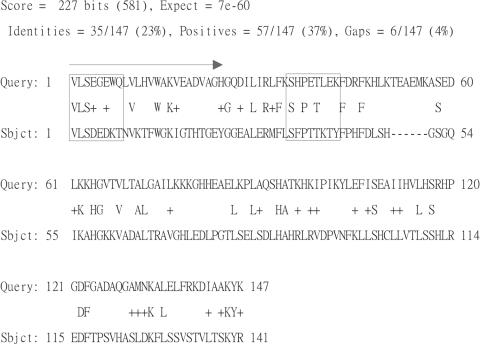
Figure 1 illustrates an HSP found by PSI-BLAST. In this example, the HSP is of length 147, the identity between these two sequences is 23%, and the alignment score is 227. Assume w = 8 and k = 4. Define S(ql) = (s + 1) × alignment score instead of s × alignment score since k is allowed to be 0 and s can be 0 in this case. We show in Figure 1 two instances of a sliding window. In the first window, five amino acid pairs get positive scores. So we regard the two peptides as similar, and assign the secondary structure element of each amino acid in VLSEGEWQ to its corresponding one in VLSDEDKT. We then get a ‘pseudo peptide of known structure’ VLSDEDKT, and store it in the knowledge base along with its confidence score. Since it is possible for two identical peptides to be assigned different structures, we regard them as different peptides and store both records in the knowledge base. Thus, each peptide fragment in the knowledge base is uniquely determined by its sequence, structure and confidence score.
Figure 1.
An HSP found by PSI-BLAST.
In the second window of Figure 1, only three amino acid pairs get positive scores. So the two peptides SHPETLEK and SFPTTKTY are regarded as dissimilar and no structure information is inherited.
The match rate of a target protein
Given a target protein q of length n, we use PSI-BLAST and the constructed knowledge base to determine its match rate as follows. PSI-BLAST is performed on the target protein to find HSPs. For each HSP, we perform Step 1 and Step 2 (as stated in ‘Constructing a knowledge base’) to find peptides similar to peptides of the target protein q. We search through the knowledge base for all peptides found so far and n − w + 1 peptides of size w in the target protein itself. The match rate is defined as follows:
![]()
Match rate represents the percentage of peptides of the target protein that can extract structural information from the knowledge base. Intuitively, when the match rate is higher, the knowledge base can provide relatively more structural information and indeed, our experiment in ‘Results’ shows that the prediction accuracy tends to be better. In HYPROSP, if the match rate is higher than 80%, then we adopt PROSP for the prediction; otherwise, we use PSIPRED.
The PROSP algorithm
We describe how to predict the structure of a target protein p given the knowledge base. Associate with each amino acid x in p three score variables: H(x), E(x) and L(x) corresponding to the three states of structures, H, E and L. The structure of x is predicted based on Maximum(H(x), E(x), L(x)). Each amino acid x appears in w consecutive overlapped peptides of p, say p1, p2, …, pw. Each pj, 1 ≤ j ≤ w, is associated with some similar peptides (including itself), say qr. We use pj[i] and qr[i] to denote the ith position (amino acid) of pj and qr, respectively. qr is matched against the knowledge base.
If qr is in the knowledge base and the alignment score is S, for 1 ≤ i ≤ w, we update H(pj [i]) ← H(pj [i]) + S × S(qr) if qr[i] is H; E(pj [i]) ← E(pj [i]) + S × S(qr) if qr[i] is E; and L(pj [i]) ← L(pj [i]) + S × S(qr) if qr[i] is L.
If qr is not in the knowledge base, it is ignored.
Repeating the above calculation for all similar peptides covering the amino acid x, we assign the structure of x according to Maximum(H(x), E(x), L(x)).
We also use the following modification rules: for any three consecutive amino acids abc in p, if the structure of abc is LHL, then assign LLL to abc; if the structure of abc is HEH, then assign HHH to abc; if the structure of abc is EHE, then assign EEE to abc. If H(x) = E(x) = L(x), then x is assigned the structure state L since L occurs more frequently than H and E. If H(x) = E(x) > L(x), then x is assigned the structure state H since H occurs more frequently than E.
RESULTS
PROSP is developed under Linux Redhat 9.0; it is implemented as a C++ MPI application suit which is run on a PC cluster having 15 nodes; each node contains a Pentium-4 2.8 GHz CPU, 2 GB main memory and a 30 GB hard disk. After performing PSI-BLAST, predicting one protein by PROSP under this configuration takes around three seconds. We use two datasets to verify PROSP: the DSSP dataset and the EVA sequence-unique dataset. The experiment on the DSSP dataset is to simulate the real world scenario; the experiment on the EVA dataset is to perform comprehensive cross-validation. We now describe the experimental results of the DSSP dataset, and then describe those of the EVA dataset.We use Q3 to evaluate our algorithm, which is given by
![]()
Experimental results on different parameters
The DSSP dataset
In the first experiment, we intend to simulate the real world scenario by fully utilizing the strength of known protein structural information to predict the unknown. Therefore, we use as large a dataset as we can get for training. We use the DSSP data before September 2003 (12 714 proteins) to create our training and testing datasets. Because data cleansing of such huge datasets is a tedious work, we generate training and testing datasets according to the protein deposited date rather than perform a comprehensive cross-validation. The experiment is repeated three times for each month of July, August and September. Three pairs of training and testing datasets are generated for July, August and September (see Table 1). For each month, we treat the proteins deposited or modified in that month as potential target proteins and the remaining non-redundant proteins in DSSP as training proteins. Among the target proteins, we only use those whose identities with the training proteins are less than 25%. So there is no direct relation among the three testing datasets, and this is why the resulting datasets have unbalanced number of proteins. Note that in each dataset, the total number of proteins (training + testing) is less than 12 714 because of the following data cleansing procedure:
Table 1. The datasets of July, August and September of 2003.
| Set 1 (July) | Training proteins | DSSP protein records excluding those last modified by July 2003, total 9 213 proteins. |
|---|---|---|
| Target proteins | DSSP protein records last modified by July 2003, total 465 proteins. | |
| Set 2 (August) | Training proteins | DSSP protein records excluding those last modified by August 2003, total 12 248 proteins. |
| Target proteins | DSSP protein records last modified by August 2003, total 41 proteins. | |
| Set 3 (September) | Training proteins | DSSP protein records excluding those last modified by September 2003, total 12 344 proteins. |
| Target proteins | DSSP protein records last modified by September 2003, total 85 proteins. |
perform pairwise exact match to ensure these datasets are non-redundant; all identical sequences are filtered out;
within each set of potential target proteins, remove those that can find similar proteins with sequence identity >25% in the training proteins and treat the remaining ones as target proteins.
The knowledge bases generated by using July, August and September datasets contain 40 106 086, 43 381 886 and 43 478 539 peptides, respectively. Each peptide is of length seven.
In the following subsection, we present the experimental results of PROSP using different parameters. Note that each curve shown in the figures of this subsection is obtained by averaging the prediction results of all three datasets with specified parameters unless otherwise stated.
Results on different window size w and similarity threshold k
Our algorithm aims to utilize, to a greater extent, structural information of similar peptides. The determination of similar relations, which depends on the window size w and the similarity threshold k, can greatly affect the performance of our algorithm. There is a tradeoff in selecting w and k.
Using smaller w, we can generate more peptides for a target protein and match more similar peptides from the knowledge base. However, short peptide sequences are likely to be associated with many incompatible structures, which could create more ambiguity in structure prediction.
For each fixed w, there is also a tradeoff in choosing the similarity threshold k. Smaller k produces looser similarity relations, which would prompt us to extract more ‘similar’ but less reliable peptides from the knowledge base. To make an appropriate selection of w and k, we conduct the experiments for w ranging from 6 to 10 and k ranging from 0 to w.
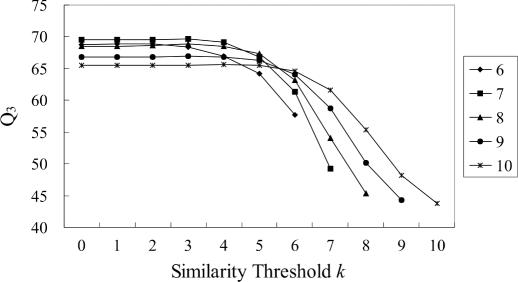
Figure 2 shows the prediction accuracy Q3 for different k, in which each curve represents a given value of w. It is observed that a better performance is obtained when k is within the range (0, w/2). This may imply that peptide diversity is more important than peptide specificity for prediction accuracy.
Figure 2.
Prediction accuracy for different similarity thresholds k (DSSP dataset).
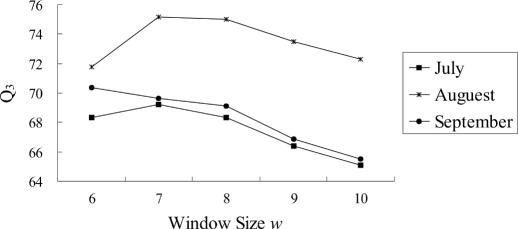
Figure 3 shows the prediction accuracy Q3 for different window size w with the best k given by w/2, and three curves corresponding to the three datasets July, August and September. For July and August datasets, window size 7 produces the best prediction accuracy; there is no more than 4% accuracy difference among all window sizes. For September dataset, the prediction accuracy becomes worse if window sizes get larger. Overall, w = 7 seems to be the best choice, and we choose k to be 3.
Figure 3.
Prediction accuracy for different window sizes w (DSSP dataset).
Results on different match rates
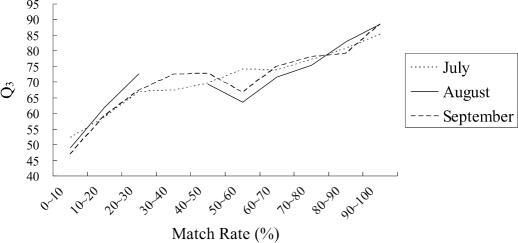
Match rate represents the portion of similar peptides generated from a target protein that are found in the knowledge base. Figure 4 shows the results of different match rates given w = 7 and k = 3. Note, however, the curve of the August dataset is disconnected since no target protein has a match rate between 28% and 45%.
Figure 4.
Prediction accuracy for different match rates on three DSSP datasets.
Intuitively, one can see from Figure 4 that higher matched rate implies higher prediction accuracy. Proteins with match rate higher than 80% can achieve prediction accuracy over 83, which is considerably better than that of PSIPRED. Thus, we set the match rate cutoff threshold at 80% to assure better performance using HYPROSP. That is, HYPROSP uses PSIPRED to predict target proteins with match rate lower than 80%, and uses PROSP for proteins with match rate at least 80%.
Note that, for those proteins in the training data, the match rate is guaranteed to be 100% (since each protein sequence will match with itself in DSSP) and the Q3 is found to be close to 94.
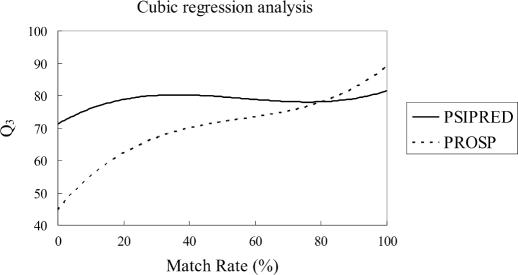
The prediction accuracy with respect to match rate for PROSP and PSIPRED is shown in Figure 5. For PROSP, a monotonically increasing cubic regression line is shown. On the other hand, for PSIPRED, the cubic regression line is rather flat. By comparing these two regression lines, we find that PROSP gets ahead when the match rate is over 80%.
Figure 5.
The relation of PROSP and PSIPRED with respect to match rate (DSSP dataset).
Comparison of HYPROSP and PSIPRED
The performance improvement of our hybrid method depends on the proportion of target proteins with match rate at least 80%. Table 2 shows the match rate distribution of target proteins in each dataset. In Table 3, we show Q3 of PSIPRED and HYPROSP.
Table 2. The distribution of protein match rate.
| Match rate | ||
|---|---|---|
| 0–80% | 80–100% | |
| July | 74.0% | 26.0% |
| August | 58.5% | 41.5% |
| September | 80.0% | 20.0% |
Table 3. The Q3 prediction accuracy of various algorithms.
| PSIPRED | PROSP | HYPROSP | Improvement | |||
|---|---|---|---|---|---|---|
| Match rate | Match rate | |||||
| ≥80% | <80% | Overall | ≥80% | Overall | ||
| July | 79.9 | 77.1 | 77.8 | 83.3 | 78.7 | 0.9 |
| August | 80.4 | 74.7 | 77.1 | 87.9 | 80.2 | 3.1 |
| September | 80.6 | 81.3 | 81.2 | 84.7 | 82.0 | 0.8 |
| Average | 80.0 | 77.7 | 78.3 | 83.9 | 79.3 | 1.04 |
For target proteins with match rate at least 80%, the prediction accuracy of PROSP is better than that of PSIPRED by 3.9. The average prediction accuracy of HYPROSP is 79.3, which is an improvement of 1.04 over PSIPRED. This improvement is statistically significant at p = 0.0008.
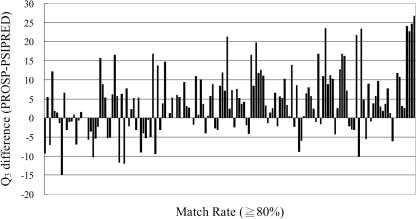
To compare PROSP with PSIPRED on target proteins with match rate at least 80%, we depict the Q3 difference between PROSP and PSIPRED. The result is quite dramatic as can be seen in Figure 6. There are 155 proteins (total over three months) whose match rates are at least 80%. To these 155 proteins, the accuracy improvement of the mean and standard deviation is 3.96 and 8.17, respectively. Among the 155 proteins with match rate at least 80%, PROSP predicts better than PSIPRED in 99 proteins, in which the average accuracy improvement is 8.51; on the other hand, there are 50 proteins that PROSP predicts worse than PSIPRED, in which the average accuracy decrease is 4.58. There are 6 proteins that both methods achieve the same accuracy. The detailed statistics of the 155 proteins over the three datasets are listed in Table 4, in which n, μ and σ mean the number of proteins, average and standard deviation, respectively.
Figure 6.
The difference of Q3 between PROSP and PSIPRED (DSSP dataset).
Table 4. The Q3 of PROSP compared to that of PSIPRED on proteins with match rate at least 80%.
| n | Above PSIPRED improvement | n | Below PSIPRED decrease | Equal to PSIPRED | n | |||
|---|---|---|---|---|---|---|---|---|
| μ | σ | μ | σ | n | ||||
| July | 75 | 8.10 | 6.04 | 42 | 4.57 | 3.43 | 4 | 121 |
| August | 12 | 11.65 | 7.85 | 4 | 3.07 | 1.83 | 1 | 17 |
| September | 12 | 7.90 | 5.42 | 4 | 6.21 | 3.53 | 1 | 17 |
| Average | 8.51 | 6.33 | 4.58 | 3.40 | 155 | |||
For those 50 proteins that PROSP predicts worse than PSIPRED, we observe that these proteins share a lot of ‘ambiguous peptides’, which are associated with multiple incompatible structures. Such ambiguity corrupts the voting procedure.
Experimental results on the EVA sequence-unique dataset
In the second experiment, we use a smaller but commonly used standard dataset, EVA sequence-unique dataset (December 11, 2003), to perform comprehensive cross-validation. Proteins are considered sequence-unique if we cannot find any protein in PDB satisfying at least one of the following conditions:
E-value of <10−2 in PSI-BLAST search;
E-value of <10−2 in pairwise BLAST search;
HSSP threshold <0 in pairwise BLAST or PSI-BLAST search.
EVA dataset contains 3 107 proteins. We filter out those of length <50 or >1000, which yields a new dataset containing 2 509 proteins. The knowledge base created by using the EVA dataset contains 31 252 529 peptides.
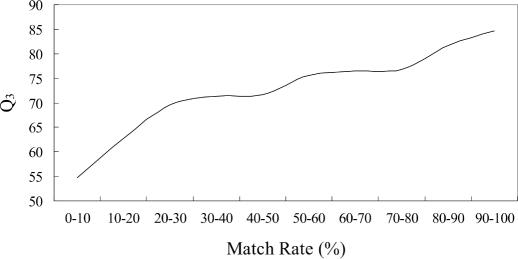
We have performed a 10-fold cross-validation on this dataset and showed the average Q3 with respect to different match rates in Figure 7. (10-fold cross-validation is a standard verification method, in which data is split into 10 approximate equal partitions. Each one is in turn used for testing while the others are used for training, i.e. 9/10 of data is for training and 1/10 for testing. The whole procedure is repeated 10 times.). The average Q3 of PROSP on proteins with match rate at least 80% is 83.2. When compared with PSIPRED whose average Q3 is 76 reported by the EVA website (PSIPRED's accuracy is not much correlated to our match rate from Figure 5), the Q3 of PROSP is 7.2 better than that of PSIPRED, which is even larger than the difference of the experiment on the DSSP dataset. On average, 9.72% of testing proteins have match rate at least 80%.
Figure 7.
Prediction accuracy for different match rates on the EVA dataset.
CONCLUSIONS
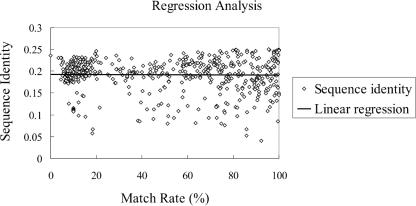
Our knowledge-based approach for protein secondary structure prediction has several advantages. First, the knowledge base provides an interesting measure, match rate, for any protein sequence. As far as the secondary structure is concerned, the match rate can be regarded as a new ‘similarity measure’ for a target protein against our knowledge base. The higher the match rate, the better the prediction accuracy is likely to be. Second, future improvement of our approach is incremental: as more protein structures are discovered each month, the knowledge base (training data) is richer and the prediction accuracy will likely get better automatically. Third, the match rate as defined is not correlated to sequence identity of proteins in DSSP (as seen from Figure 8, in which the regression line has a slope of −0.000 018 and a p-value of 0.69), nor is it much correlated with the prediction accuracy of PSIPRED. This shows our match rate has captured certain remote homologous relations in evolution that are not evident in other methods. Hence, the improvement is likely to stay even after other methods are improved along their respective philosophies.
Figure 8.
The analysis showing that our match rate is not correlated to sequence identity with proteins in DSSP.
Another advantage is that the architecture of our algorithm is flexible enough to allow other biological knowledge as well as machine-learning or corpus analysis techniques in natural language processing to be incorporated into the model to further improve its prediction accuracy.
Acknowledgments
ACKNOWLEDGEMENTS
This work is supported in part by the National Science Council under Grant NSC 92-2213-E-001-026 and the thematic program of Academia Sinica under Grant AS91IIS1PP.
REFERENCES
- 1.McGuffin L.J. and Jones,D.T. (2003) Benchmarking secondary structure prediction for fold recognition. Proteins, 52, 166–175. [DOI] [PubMed] [Google Scholar]
- 2.Chandonia J.M. and Karplus,M. (1999) New methods for accurate prediction of protein secondary structure. Proteins, 35, 293–306. [PubMed] [Google Scholar]
- 3.Cuff J.A. and Barton,G.J. (1999) Evaluation and improvement of multiple sequence methods for protein secondary structure prediction. Proteins, 34, 508–519. [DOI] [PubMed] [Google Scholar]
- 4.Cuff J.A. and Barton,G.J. (1999) Application of enhanced multiple sequence alignment profiles to improve protein secondary structure prediction. Proteins, 40, 502–511. [DOI] [PubMed] [Google Scholar]
- 5.Cuff J.A., Clamp,M.E., Siddiqui,A.S., Finlay,M. and Barton,G.J. (1998) JPred: a consensus secondary structure prediction server. Bioinformatics, 14, 892–893. [DOI] [PubMed] [Google Scholar]
- 6.Hua S. and Sun,Z. (2001) A novel method of protein secondary structure prediction with high segment overlap measure: support vector machine approach. J. Mol. Biol., 308, 397–407. [DOI] [PubMed] [Google Scholar]
- 7.Jones D.T. (1999) Protein secondary structure prediction based on position-specific scoring matrices. J. Mol. Biol., 292, 195–202. [DOI] [PubMed] [Google Scholar]
- 8.Karplus K., Barrett,C., Cline,M., Diekhans,M., Grate,L. and Hughey,R. (1999) Predicting protein structure using only sequence information. Proteins, 3(Suppl.), 121–125. [DOI] [PubMed] [Google Scholar]
- 9.Kim H. and Park,H. (2003) Protein secondary structure prediction by support vector machines and position-specific scoring matrices. Protein Eng., 16, 553–560. [DOI] [PubMed] [Google Scholar]
- 10.McGuffin L.J., Bryson,K. and Jones,D.T. (2000) The PSIPRED protein structure prediction server. Bioinformatics, 16, 404–405. [DOI] [PubMed] [Google Scholar]
- 11.Qian N. and Sejnowski,T.J. (1988) Predicting the secondary structure of globular proteins using neural network models. J. Mol. Biol., 202, 865–884. [DOI] [PubMed] [Google Scholar]
- 12.Riis S.K. and Krogh,A. (1996) Improving prediction of protein secondary structure using structured neural networks and multiple sequence alignments. J. Comput. Biol., 3, 163–183. [DOI] [PubMed] [Google Scholar]
- 13.Rost B. and Sander,C. (1993) Prediction of secondary structure at better than 70% accuracy. J. Mol. Biol., 232, 584–599. [DOI] [PubMed] [Google Scholar]
- 14.Rost B. and Sander,C. (1994) Combining evolutionary information and neural networks to predict protein secondary structure. Proteins, 19, 55–72. [DOI] [PubMed] [Google Scholar]
- 15.Rost B. (2001) Review: protein secondary structure prediction continues to rise. J. Struct. Biol., 134, 204–218. [DOI] [PubMed] [Google Scholar]
- 16.Frishman D. and Argos,P. (1997) Seventy-five percent accuracy in protein secondary structure prediction. Proteins, 27, 329–335. [DOI] [PubMed] [Google Scholar]
- 17.Altschul S.F., Madden,T.L., Schaffer,A.A., Zhang,J., Zhang,Z., Miller,W. and Lipman,D.J. (1997) Gapped BLAST and PSI-BLAST: a new generation of protein database search programs. Nucleic Acids Res., 25, 3389–3402. [DOI] [PMC free article] [PubMed] [Google Scholar]


